X-Rays
X-RAYS AND ENERGY
X-rays have much higher energy and much shorter wavelengths than ultraviolet light, and scientists usually refer to x-rays in terms of their energy rather than their wavelength. This is partially because x-rays have very small wavelengths, between 0.03 and 3 nanometers, so small that some x-rays are no bigger than a single atom of many elements.

DISCOVERY OF X-RAYS
X-rays were first observed and documented in 1895 by German scientist Wilhelm Conrad Roentgen. He discovered that firing streams of x-rays through arms and hands created detailed images of the bones inside. When you get an x-ray taken, x-ray sensitive film is put on one side of your body, and x-rays are shot through you. Because bones are dense and absorb more x-rays than skin does, shadows of the bones are left on the x-ray film while the skin appears transparent.
An x-ray image of teeth. Can you see the filling?
An X-ray photo of a one year old girl who swallowed a sewing pin. Can you find it?
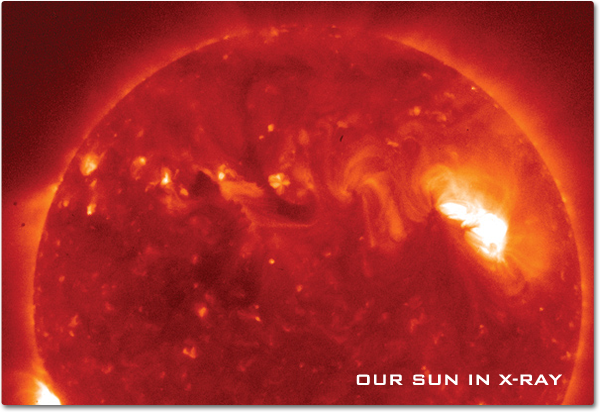
Our Sun's radiation peaks in the visual range, but the Sun's corona is much hotter and radiates mostly x-rays. To study the corona, scientists use data collected by x-ray detectors on satellites in orbit around the Earth. Japan's Hinode spacecraft produced these x-ray images of the Sun that allow scientists to see and record the energy flows within the corona.
TEMPERATURE AND COMPOSITION
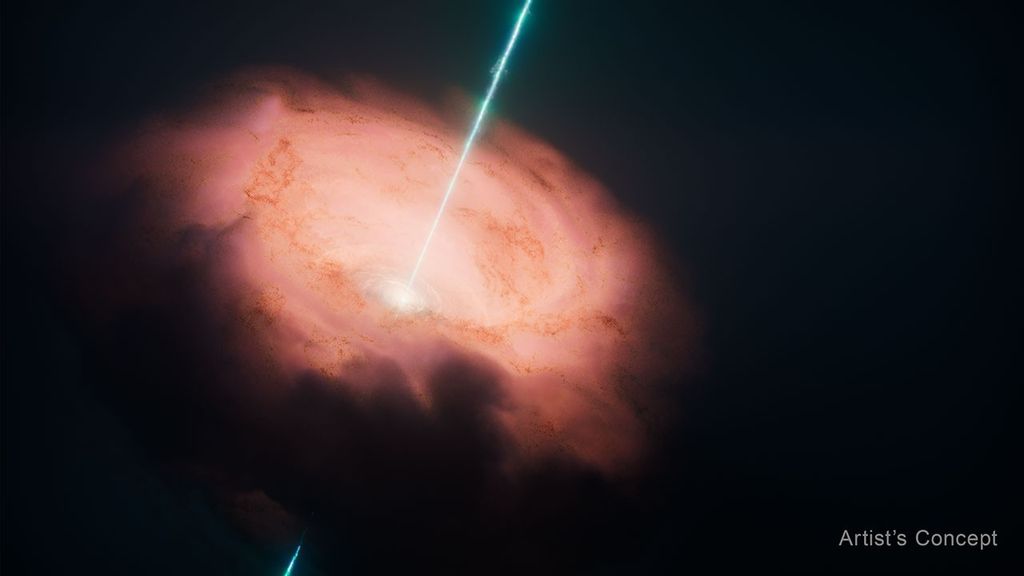
The physical temperature of an object determines the wavelength of the radiation it emits. The hotter the object, the shorter the wavelength of peak emission. X-rays come from objects that are millions of degrees Celsius—such as pulsars, galactic supernovae remnants, and the accretion disk of black holes.
From space, x-ray telescopes collect photons from a given region of the sky. The photons are directed onto the detector where they are absorbed, and the energy, time, and direction of individual photons are recorded. Such measurements can provide clues about the composition, temperature, and density of distant celestial environments. Due to the high energy and penetrating nature of x-rays, x-rays would not be reflected if they hit the mirror head on (much the same way that bullets slam into a wall). X-ray telescopes focus x-rays onto a detector using grazing incidence mirrors (just as bullets ricochet when they hit a wall at a grazing angle).
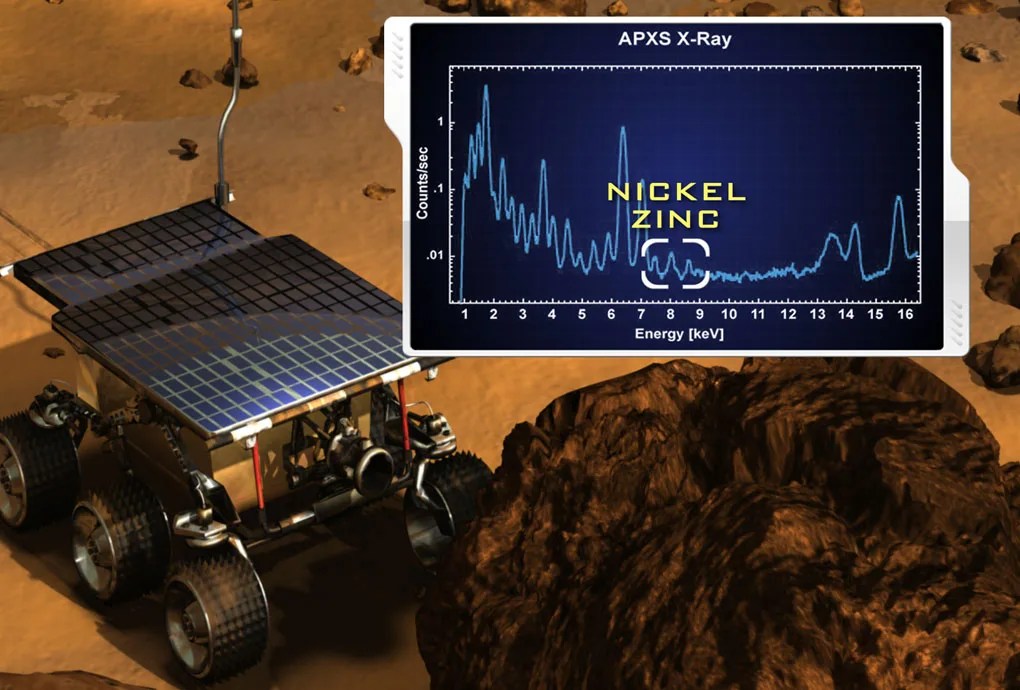
NASA's Mars Exploration Rover, Spirit, used x-rays to detect the spectral signatures of zinc and nickel in Martian rocks. The Alpha Proton X-Ray Spectrometer (APXS) instrument uses two techniques, one to determine structure and another to determine composition. Both of these techniques work best for heavier elements such as metals.
SUPERNOVA
Since Earth's atmosphere blocks x-ray radiation, telescopes with x-ray detectors must be positioned above Earth's absorbing atmosphere. The supernova remnant Cassiopeia A (Cas A) was imaged by three of NASA's great observatories, and data from all three observatories were used to create the image shown below. Infrared data from the Spitzer Space Telescope are colored red, optical data from the Hubble Space Telescope are yellow, and x-ray data from the Chandra X-ray Observatory are green and blue.
The x-ray data reveal hot gases at about ten million degrees Celsius that were created when ejected material from the supernova smashed into surrounding gas and dust at speeds of about ten million miles per hour. By comparing infrared and x-ray images, astronomers are learning more about how relatively cool dust grains can coexist within the super-hot, x-ray producing gas.
EARTH'S AURORA IN X-RAYS
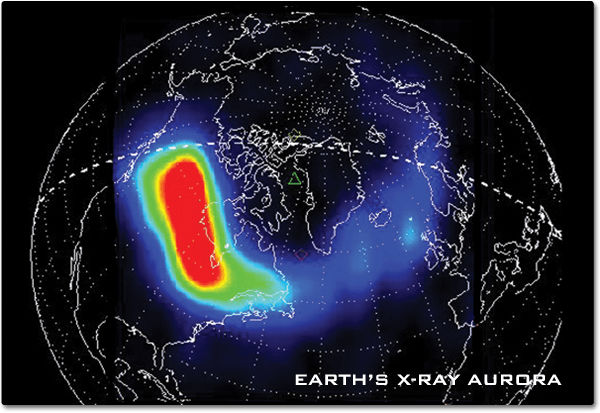
Solar storms on the Sun eject clouds of energetic particles toward Earth. These high-energy particles can be swept up by Earth's magnetosphere, creating geomagnetic storms that sometimes result in an aurora. The energetic charged particles from the Sun that cause an aurora also energize electrons in the Earth's magnetosphere. These electrons move along the Earth's magnetic field and eventually strike the Earth's ionosphere, causing the x-ray emissions. These x-rays are not dangerous to people on the Earth because they are absorbed by lower parts of the Earth's atmosphere. Below is an image of an x-ray aurora by the Polar Ionospheric X-ray Imaging Experiment (PIXIE) instrument aboard the Polar satellite.
Citation
APA
National Aeronautics and Space Administration, Science Mission Directorate. (2010). X-Rays. Retrieved [insert date - e.g. August 10, 2016], from NASA Science website: http://science.nasa.gov/ems/11_xrays
MLA
Science Mission Directorate. "X-Rays" NASA Science. 2010. National Aeronautics and Space Administration. [insert date - e.g. 10 Aug. 2016] http://science.nasa.gov/ems/11_xrays


