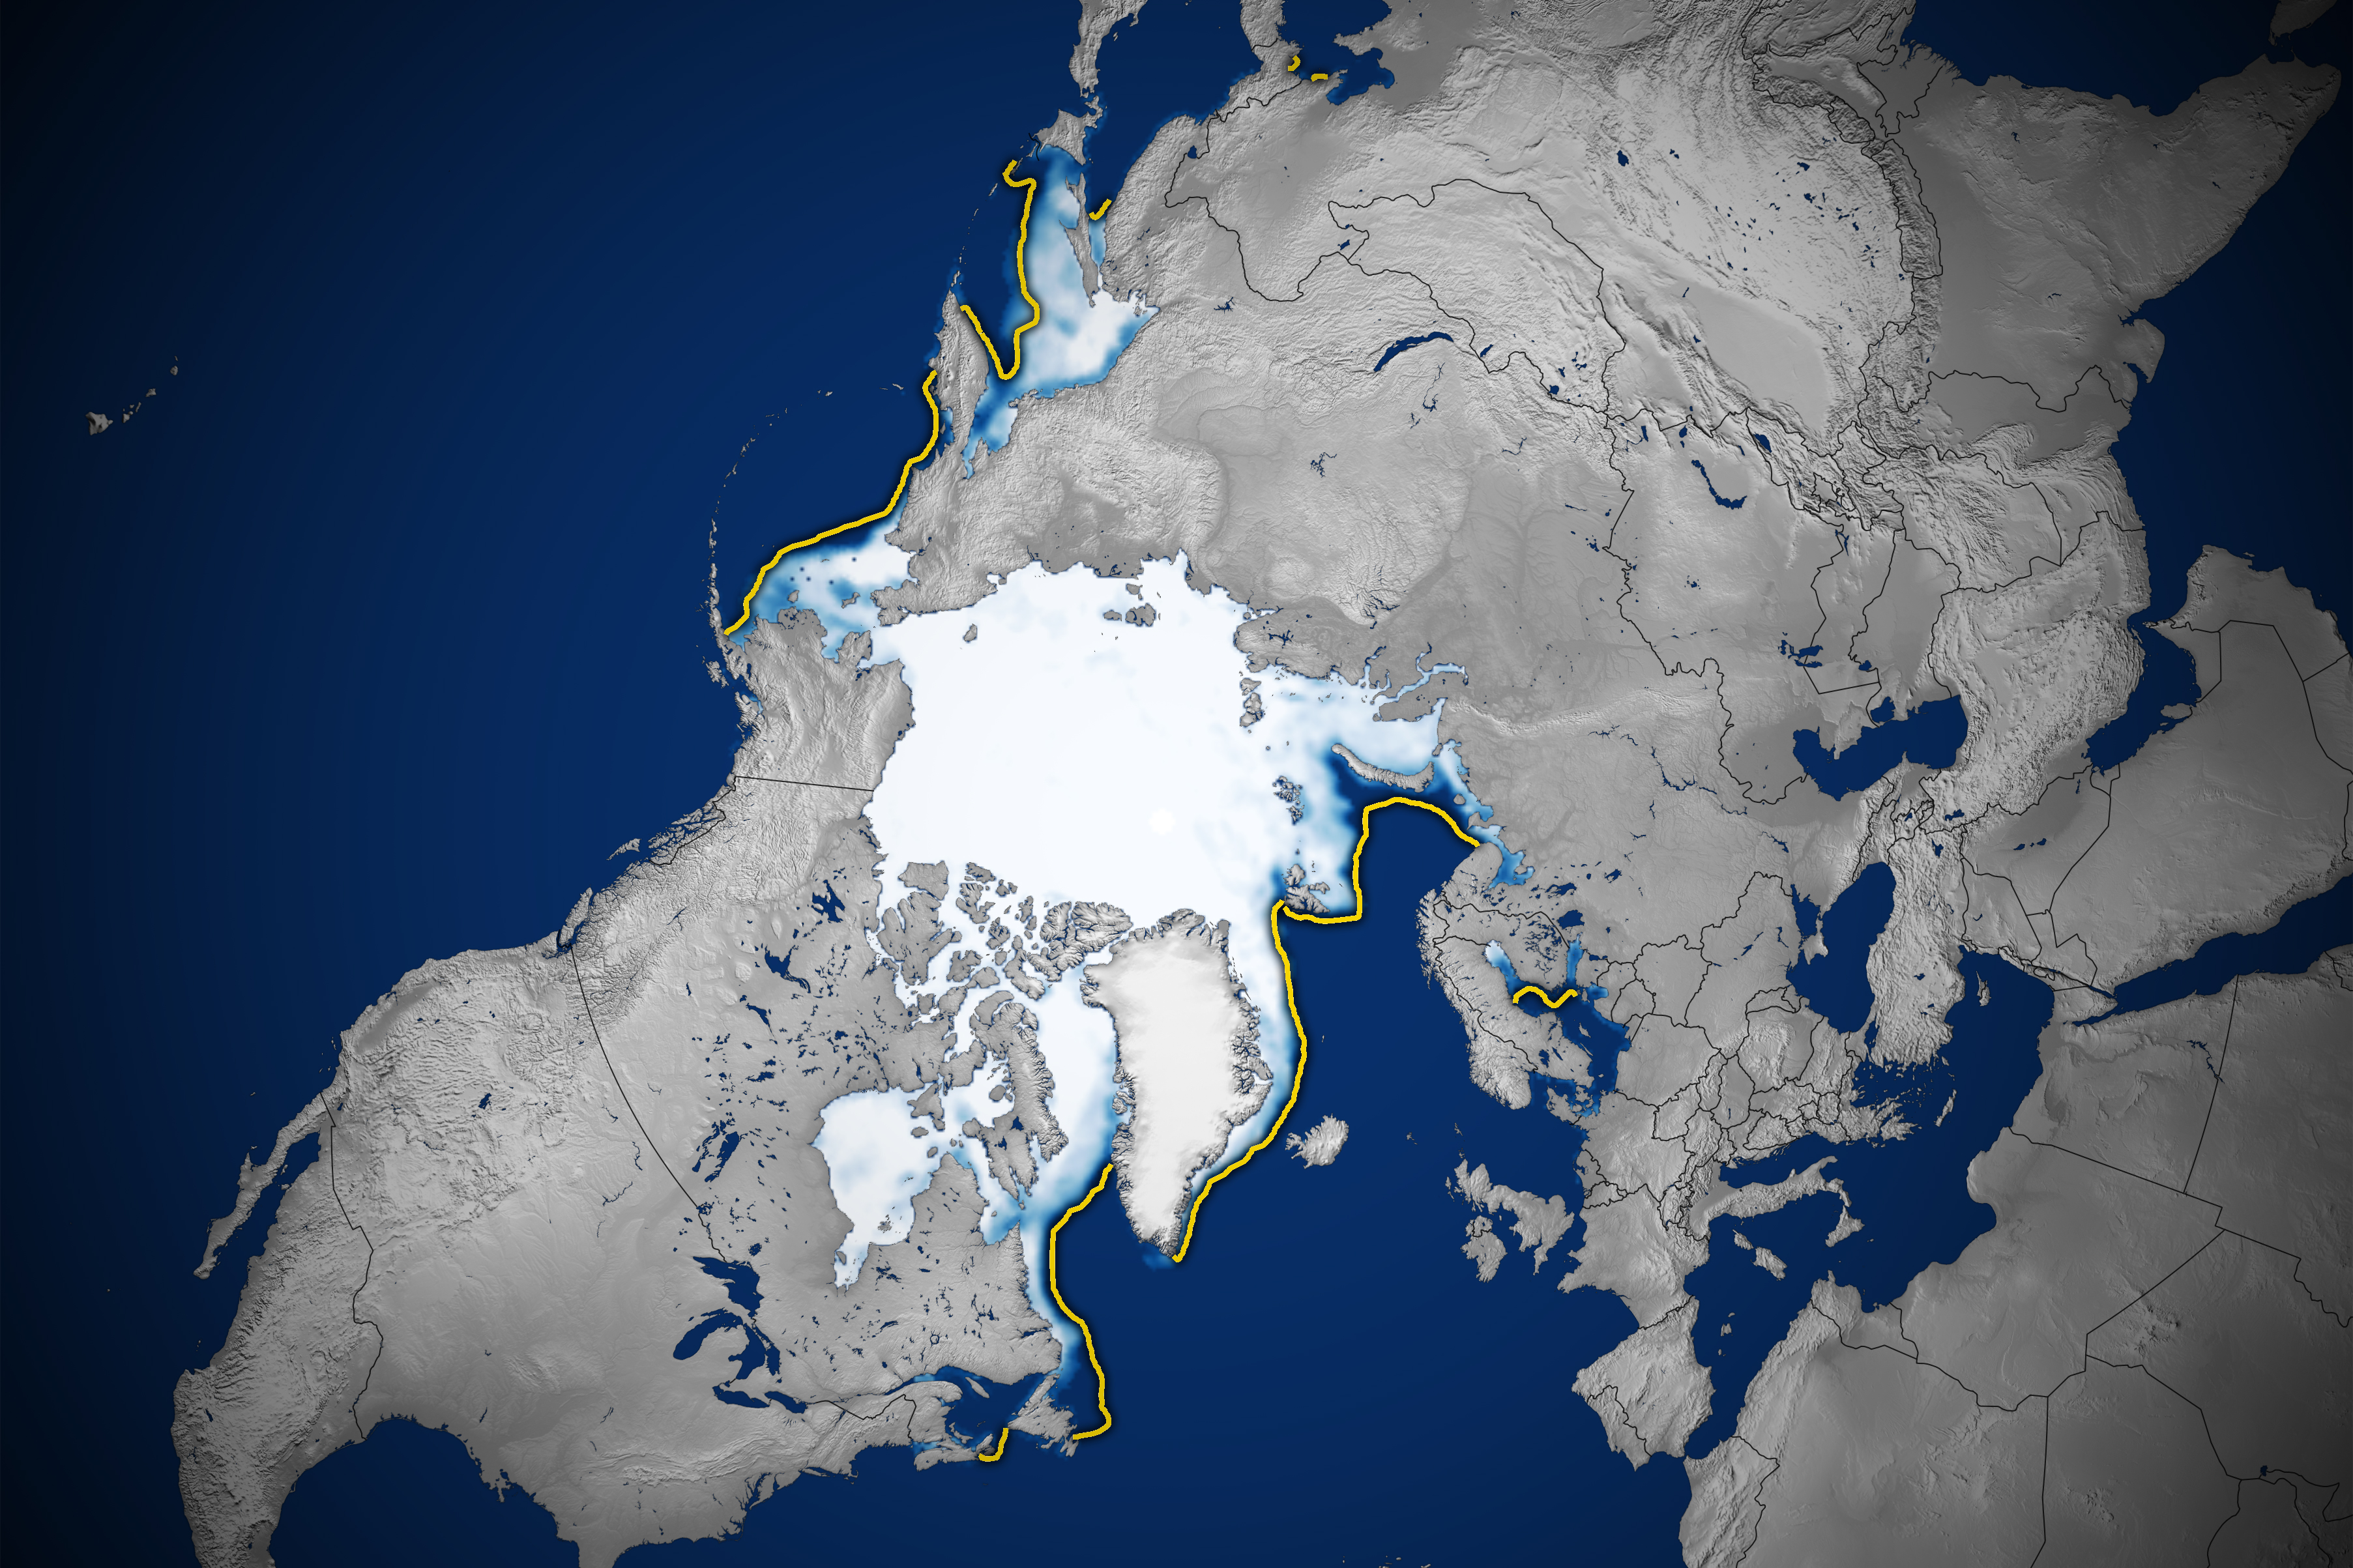
The map above shows the ice extent on March 14, the day of the annual maximum. To determine extent, scientists project satellite observations of sea ice onto a grid and then add up the total area of each cell that is at least 15 percent ice-covered. The yellow outline shows the median sea ice extent for February from 1981 to 2010. A median is the middle value; that is, half of the extents were larger than the yellow line and half were smaller.

Arctic Sea Ice Continues to Decline

Sea ice at the top of the planet continued to shrink and thin in 2024, consistent with an ongoing 46-year downward trend. View the full story

Credits: NASA Earth Observatory / Lauren Dauphin