Due to the lapse in federal government funding, NASA is not updating this website.

Suggested Searches

A satellite image showing the receding waters of a desert river basin.
Read article header
Earth article header

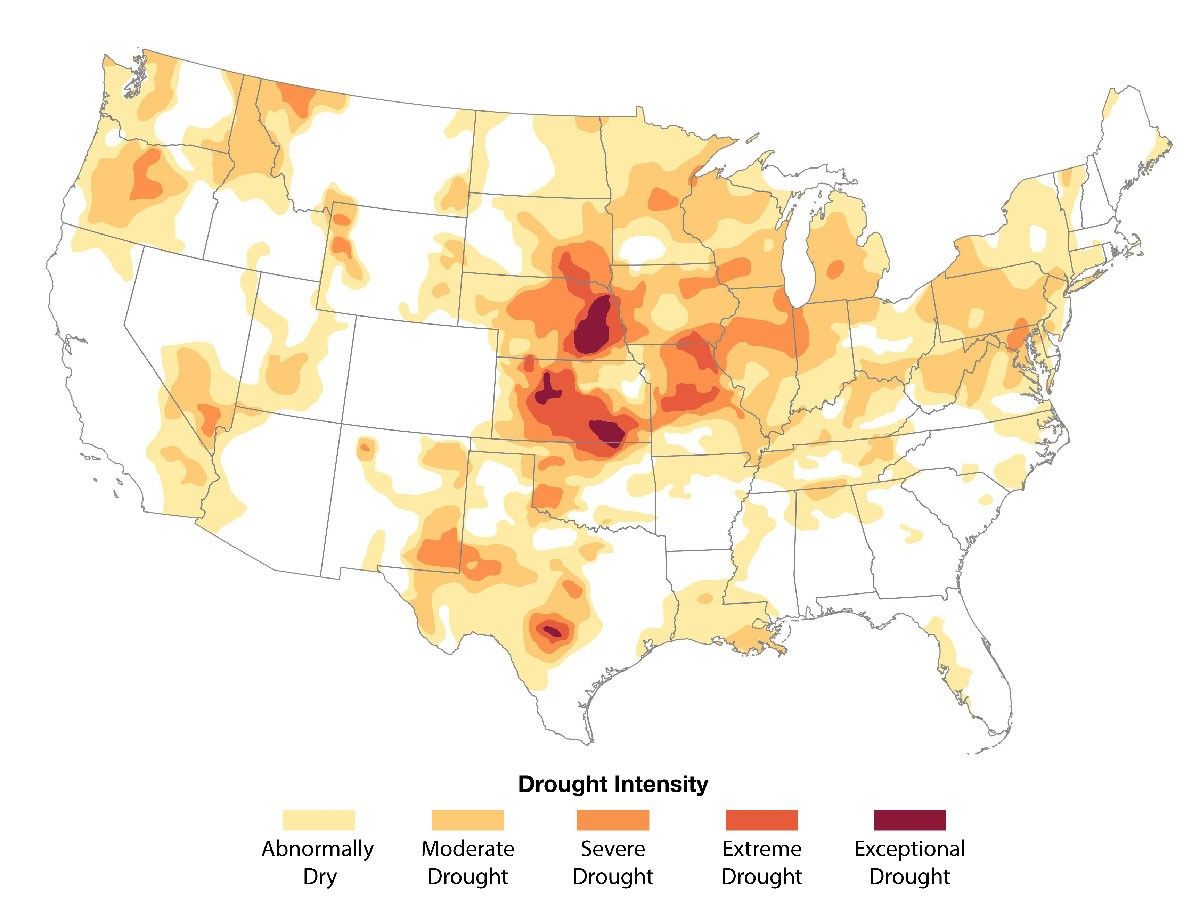
How Do We Know if We’re in a Drought?

Measuring how much water is in the soil can help us know when droughts are happening. A drought is when there is a long time (months, years, or decades) without much rain in an area. This matters because people need water to drink and farmers need it to grow the crops that feed us.

Rain, Rain, Come Back!

A tan-colored ground that is covered in cracks of different sizes and going in different directions. The cracks are black in color.
During a drought, dry, cracked mud formed around Lake Mead. As mud dries, it takes up less space than when it was wet. This creates cracks in the dried mud as certain parts clump together, as seen above.
NPS/Andrew Cattoir

Rainy days can be a bit of a bummer. For many of us, a rainy day means being pent up inside and missing out on all kinds of fun outdoor activities. Canceled baseball games. No swinging at the playground. Who needs that?

Well, we all do, actually. Plants and animals, including humans, all need water to survive. Across Earth, some places are naturally wetter, like rainforests, and others are naturally drier, like deserts. Even though desert plants and animals are used to living off very little water, they still need some. But what happens when there is less and less water in any of these places?

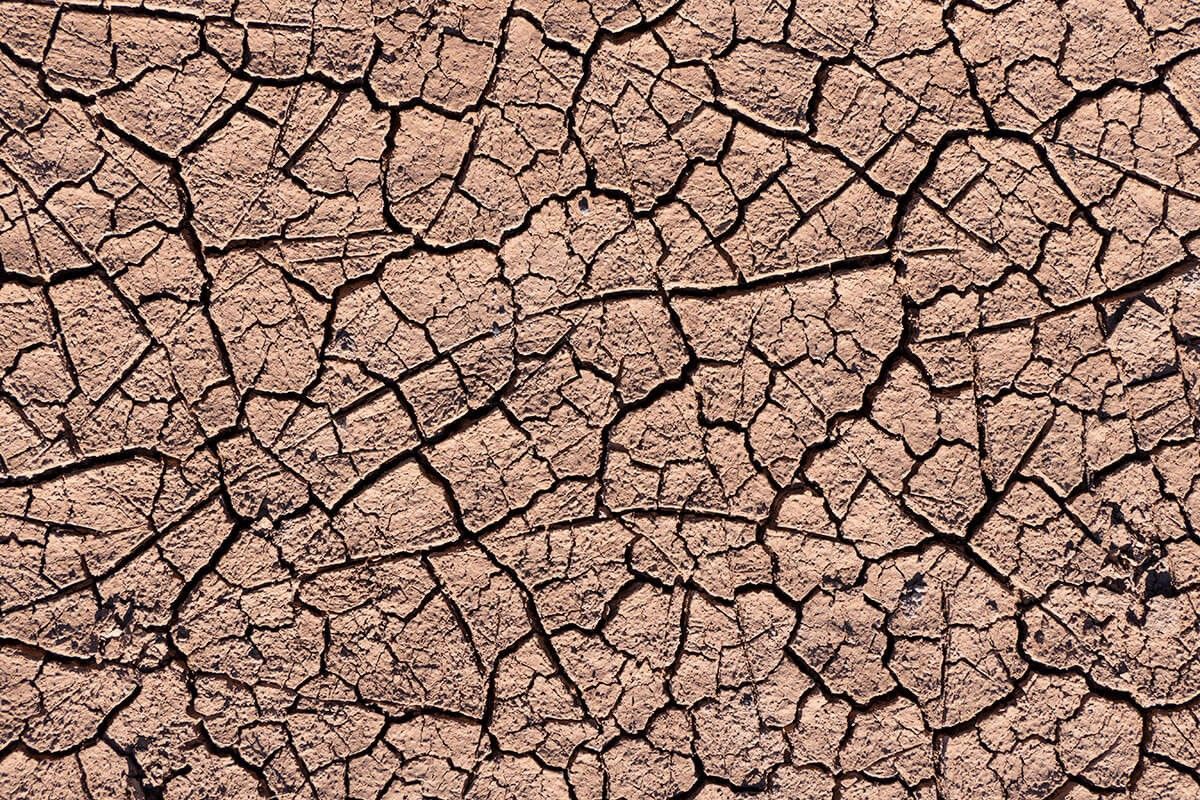
This is known as a drought. Droughts happen when there is a long time -- think months, years, or even decades -- without much rain in an area. The lack of rain makes everything drier, including dirt and soil.

A map of the U.S., minus Hawaii and Alaska, in white. The state borders are outlined in gray. The map has some spots that are white and others that are yellow, orange, red, or dark red. There are blobs of dark red, red, and orange in the middle of the U.S. including Nebraska, Kansas, Iowa, and Missouri. There are also red and orange blobs in Texas and some other parts of the country. There is a legend on the bottom labeled 'Drought Intensity' and has a colored square next to words yellow is 'Abnormally Dry,' light orange is 'Moderate Drought,' orange is 'Severe Drought,' red is 'Extreme Drought,' and dark red is 'Exceptional Drought.'
This is an example of a drought warning map from June 20, 2023 made with data from the National Drought Mitigation Center. The map shows what an ongoing drought in the middle of the U.S. might look like. The colors note the drought warning level, including moderate, severe, extreme, and exceptional. Exceptional drought means that there is a very bad drought in that area and it is getting much less water than usual. If you want to see live drought conditions, check here.
NASA/JPL-Caltech

Despite dampening your outdoor fun, rain is vitally important. People need water to drink and farmers need it to grow the crops that feed us. In places where a drought is happening, people are often asked to limit the amount of water they use. For farmers, they then need to figure out how to grow their crops with less water. This becomes a bigger and bigger challenge if a drought grows more severe.

Are Droughts Getting Worse?

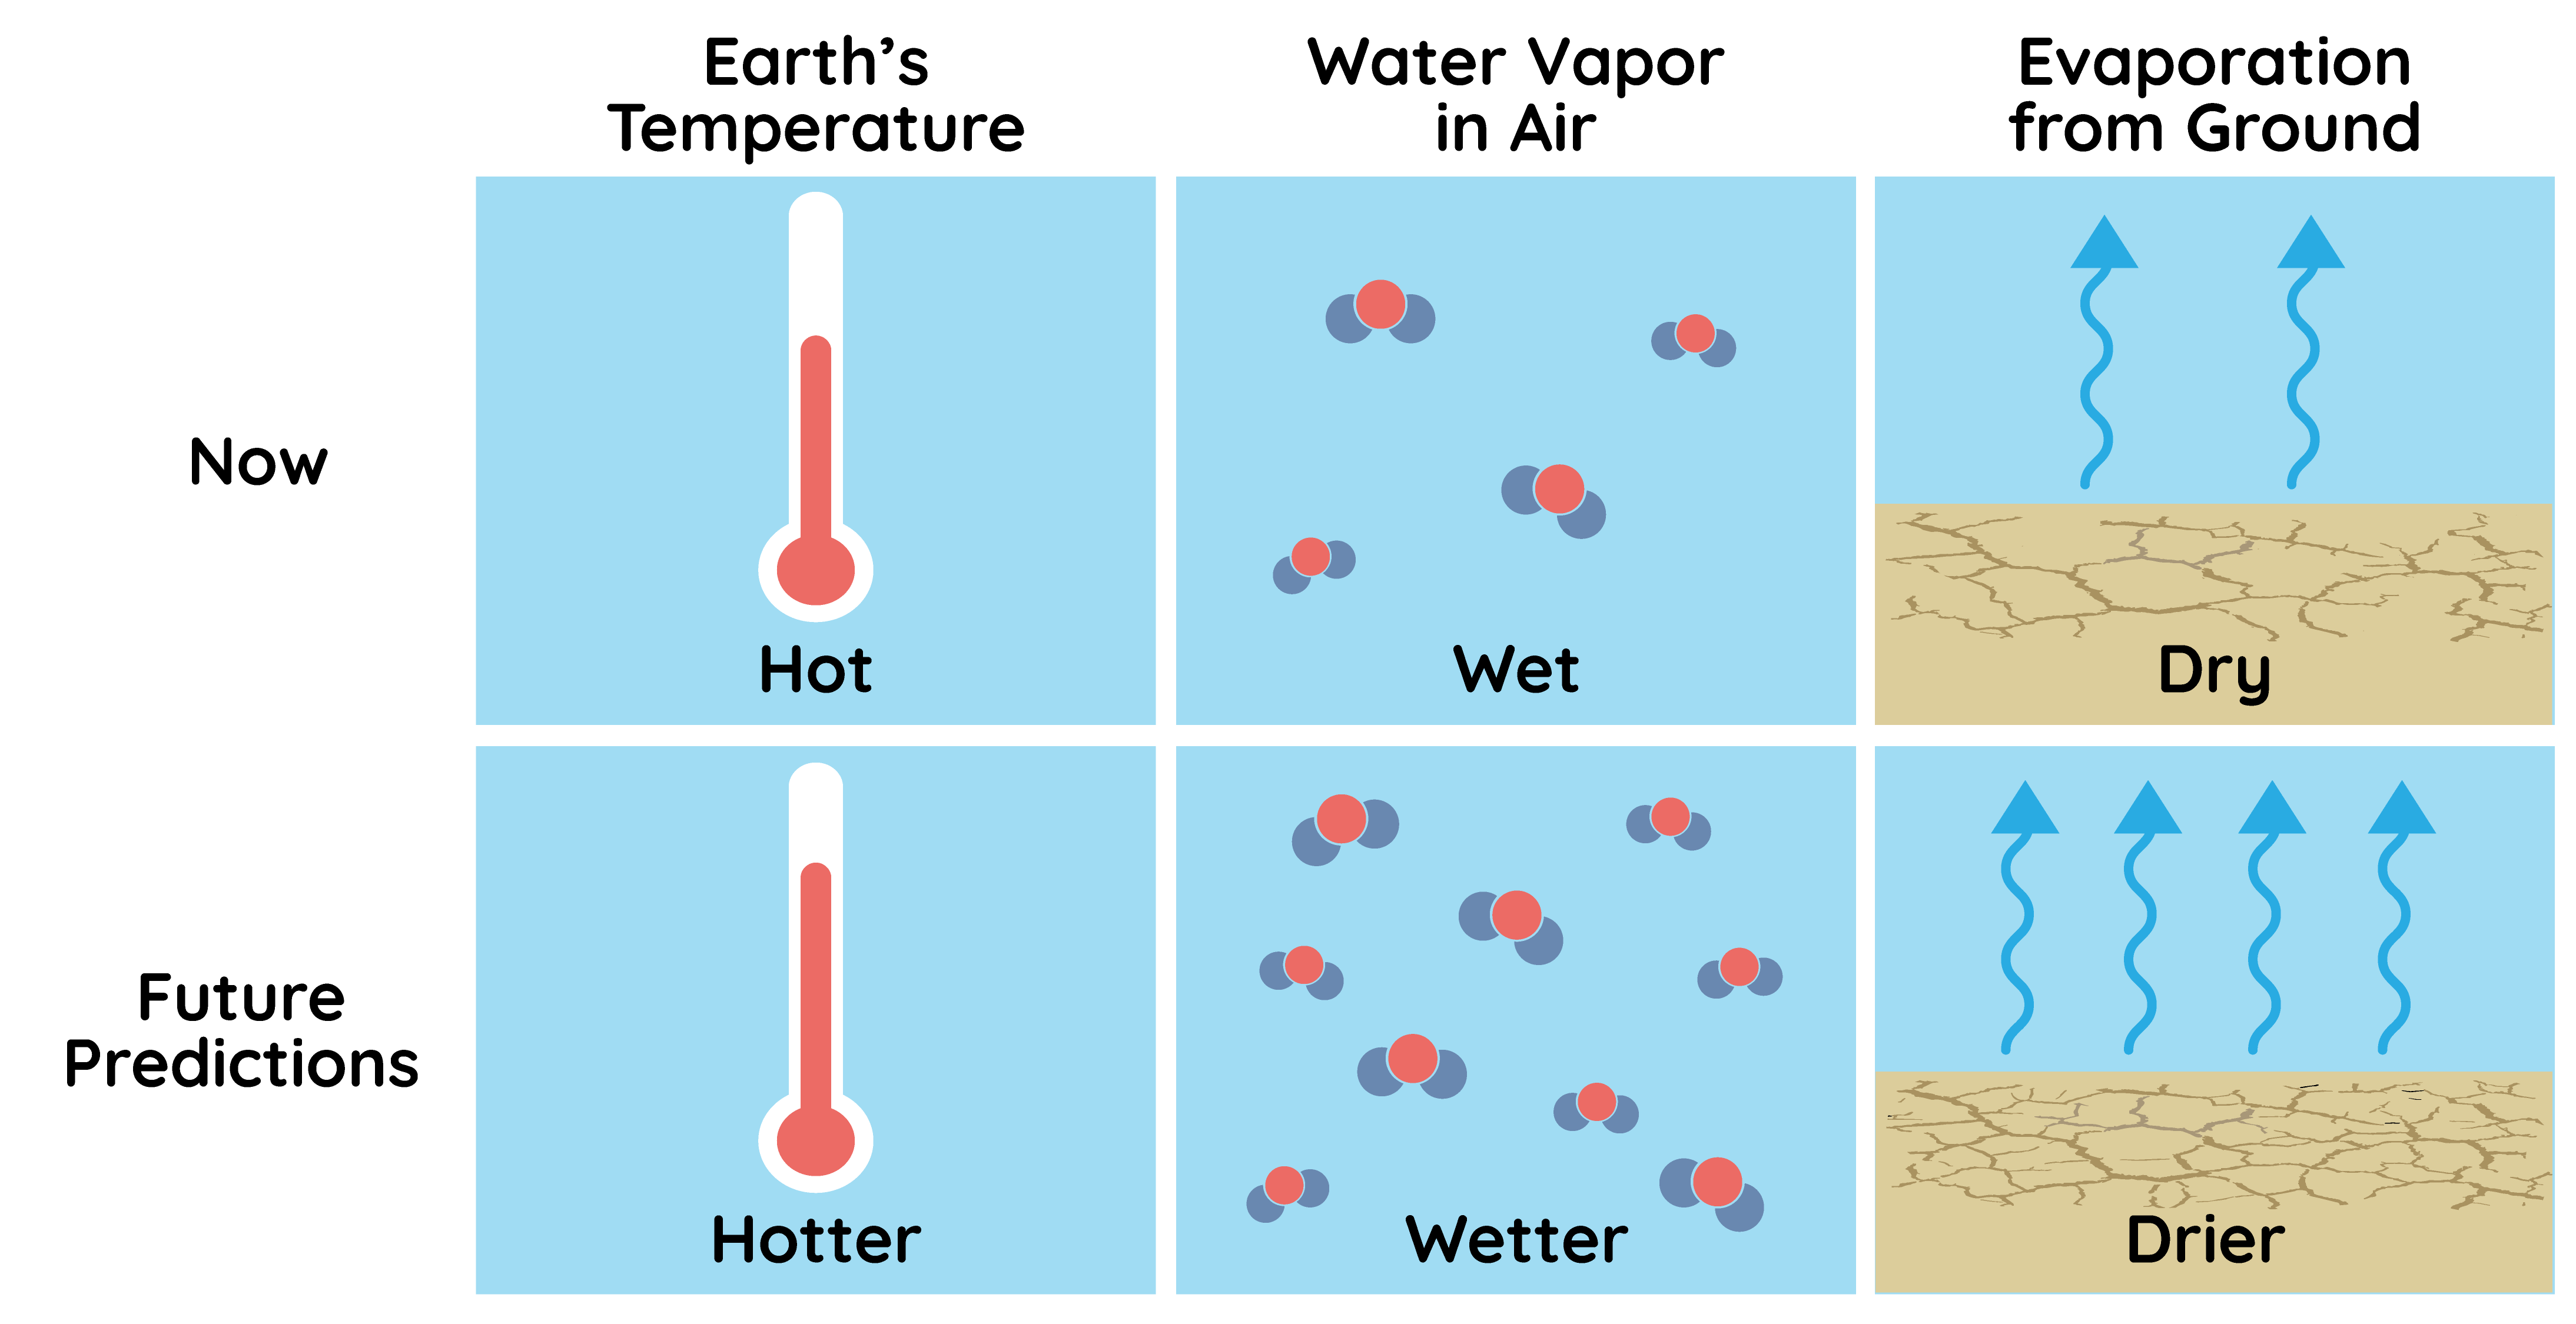
As Earth’s temperature rises, it affects the water cycle. Higher temperatures mean the air can hold more moisture. It also means more evaporation happens. Evaporation is when a liquid changes to a gas. In this case, that means water from the ground changes into water vapor, or moisture in the air.

Sometimes these changes can lead to heavier rainfall in a region. But other times the air can hold on to the extra moisture it gets from the ground and then carry it somewhere else. That can mean less moisture is left in the soil. If this keeps happening, it can lead to a drought.

A grid of six boxes is shown with illustrations in each box. On the left, the two rows are labeled 'Now' and 'Future Predictions.' On the top, the columns are labeled 'Earth’s Temperature,' 'Water Vapor in Air,' and 'Evaporation from Ground.' The top left box shows a white thermometer that is filled to about halfway with red surrounded by a blue background. It is labeled 'Hot.' Below that is a box with the same illustration except the red color fills up more of the white thermometer and it is labeled 'Hotter.' The top middle box shows four water molecules that have a red circle with two smaller blue circles next to them and is labeled 'Wet.' The box below it is similar but with nine water molecules and is labeled 'Wetter.' The right top box shows a tan ground with some cracks in it with two light blue wavy arrows rising up from it and is labeled 'Dry.' The bottom right illustration is similar but the ground has more cracks in it and there are now four wavy arrows, and it is labeled 'Drier.'
As Earth’s temperature rises, water vapor in the air and evaporation from the ground will change. It is predicted that hot temperatures will get hotter, some wet areas will get wetter, and some dry areas will get drier. This is because as the temperature rises, the air can hold more water vapor (or moisture). Heat also causes more evaporation — the changing of a liquid to a gas — from the ground.
NASA/JPL-Caltech

During droughts, many cities recommend people conserve water where they can. Farmers also make changes. They can change the time of day when they water crops, or time of year when they plant them. In extreme cases, they can even switch over to other crops that grow better with less water.

NASA is Here to Help

One of the most important things to know for managing droughts is the amount of moisture in the soil. Lucky for us, NASA is on the job!

An artist’s illustration of the SMAP satellite is shown above green land, blue water, and white clouds. The satellite has an olive green  circle at the top with small triangular fencing around it. There are two white lines going down to the land from the circle. The circle of the lines gets smaller as it reaches the land. There is another cone of white lines that goes from the top circle to the gold satellite instrument. The top circle is attached to the gold instrument with a gray pole. The gold instrument is mainly rectangular in shape. On one side there are three blue panels that are connected to it. These represent solar panels, and are rectangular in shape. Above the land and water is a curved line. Above the curved line in the background is black and white dots for stars to represent space. On the bottom middle of Earth there is greens and yellows simulating what the data looks like from the satellite.
An artist’s view of what the SMAP satellite looks like above Earth. The SMAP satellite sends important data to Earth about how wet or dry the ground is, and how that changes over time.
NASA

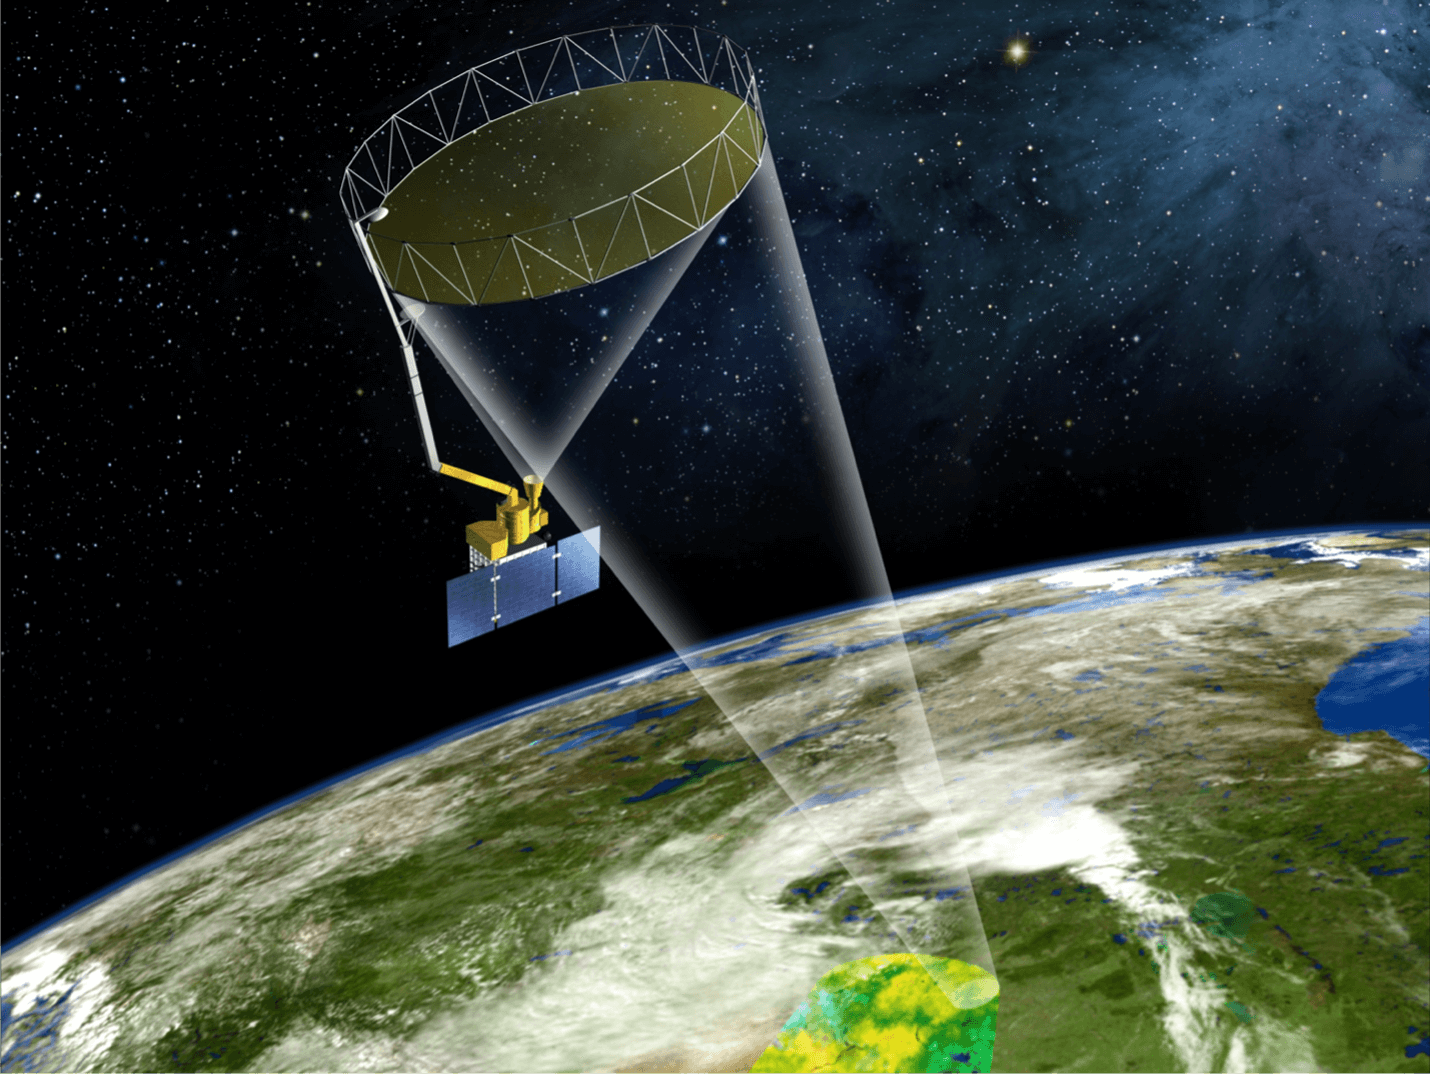
In 2015, NASA launched a satellite called Soil Moisture Active Passive (SMAP for short) into orbit. SMAP has special kinds of sensors (or instruments) that measure soil moisture across the entire globe every three days.

The satellite data has helped with monitoring droughts and floods. Plus, it has improved predictions of how well crops will grow.

In 2018, the Gravity Recovery and Climate Experiment Follow On (GRACE-FO) began measuring tiny changes in Earth’s gravity. Since 2002, scientists have used this information to find out how water on Earth is changing. This includes changes to water underground. That information helps them monitor droughts.

Droughts are challenging for everyone. But we can make changes in how we use water to help conserve it. Plus, new technologies are being developed to help us use less water whenever possible. NASA’s satellites help give us a global view of what is happening so we can make better decisions, and that’s pretty cool.

Related NASA Missions

GRACE-FO icon

GRACE-FO measures changes in Earth’s gravity at least once every 30 days.

NISAR icon

NISAR will use radar to see through the clouds to learn about the planet. It will measure all of the world’s land and ice twice every 12 days.

SMAP icon

SMAP improves our ability to predict and monitor floods and droughts. It also helps to improve regular weather forecasts. It can also help predict how much food farm crops will produce.