


My NASA Data Project Presents Tools for Studying the Urban Heat Island Effect
My NASA Data team members, Desiray Wilson and Elizabeth Joyner, presented to 25 educators on data-rich instructional tools centered on the topic of Urban Heat Islands such as interactive models, storymaps, and other resources. The webinar was hosted by GLOBE Mission Earth partner, the University of Toledo, on November 10, 2021 and was attended by educators from the United States, Qatar, Philippines, and Australia. In this session, the My NASA Data team walked educators through the various geospatial tools and learning resources available to build teachers' comfort with using the instructional resources in their lessons. The resources featured in the session include the following:
Urban Heat Island Story Map – In this 5 E StoryMap, students investigate the processes that create differences in surface temperatures, as well as how human activities have led to the creation of urban heat islands.
Mini Lesson: Surface and Air Temperatures Throughout the Day – This short lesson features a line graph showing how the surface temperature and air temperature values change over a 24 hour period.
Lesson Plan: Comparing Temperature and Solar Radiation for Common Latitudes – This lesson plan involves students in the analysis of (daytime) surface temperature and solar radiation to examine relationships of these variables using locations with similar latitudes.
Interactive Models – The following GIS interactive models are short engagements with NASA data that enable students to explore the urban heat island effect using land surface temperature and vegetation data:
Patterns in Earth's Surface Temperature Interactive Model
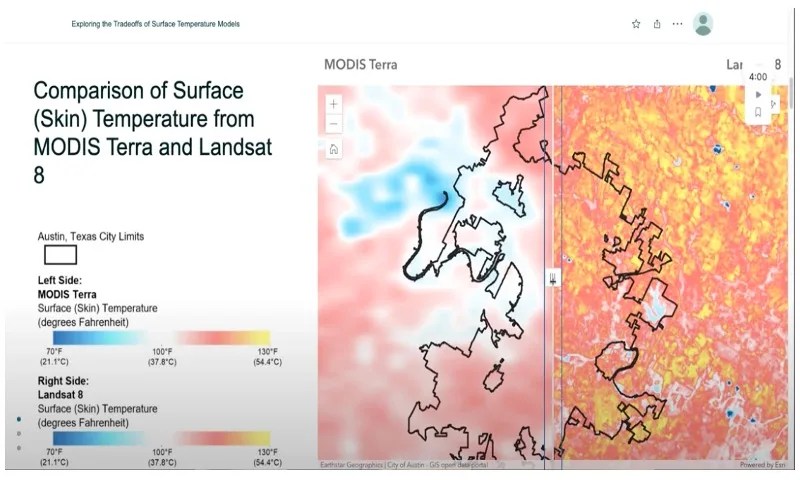
Exploring the Tradeoffs of Surface Temperature Models
Human Impact and the Creation of Urban Heat Islands Interactive Model
Earth System Data Explorer (Data Visualization Tool) – The Earth System Data Explorer, a data visualization tool, provides access to NASA data related to Urban Heat Islands around the world. Teachers and students may locate related datasets for any latitude and longitude, worldwide, and visualize these data in maps, graphs, or data tables.
Urban Heat Islands Data Sets.
Quotes from participating educators during the webinar included:
"Excited to see how extensive this story(map) is for teachers!"
"Sounds perfect for my class."
"Use the cubes (with) data, graphs, etc. Great practice for students."
(Award No. NNX16AC54A)
https://mynasadata.larc.nasa.gov/phenomenon/creation-of-urban-heat-islands