


History of the A-Train in Graphics
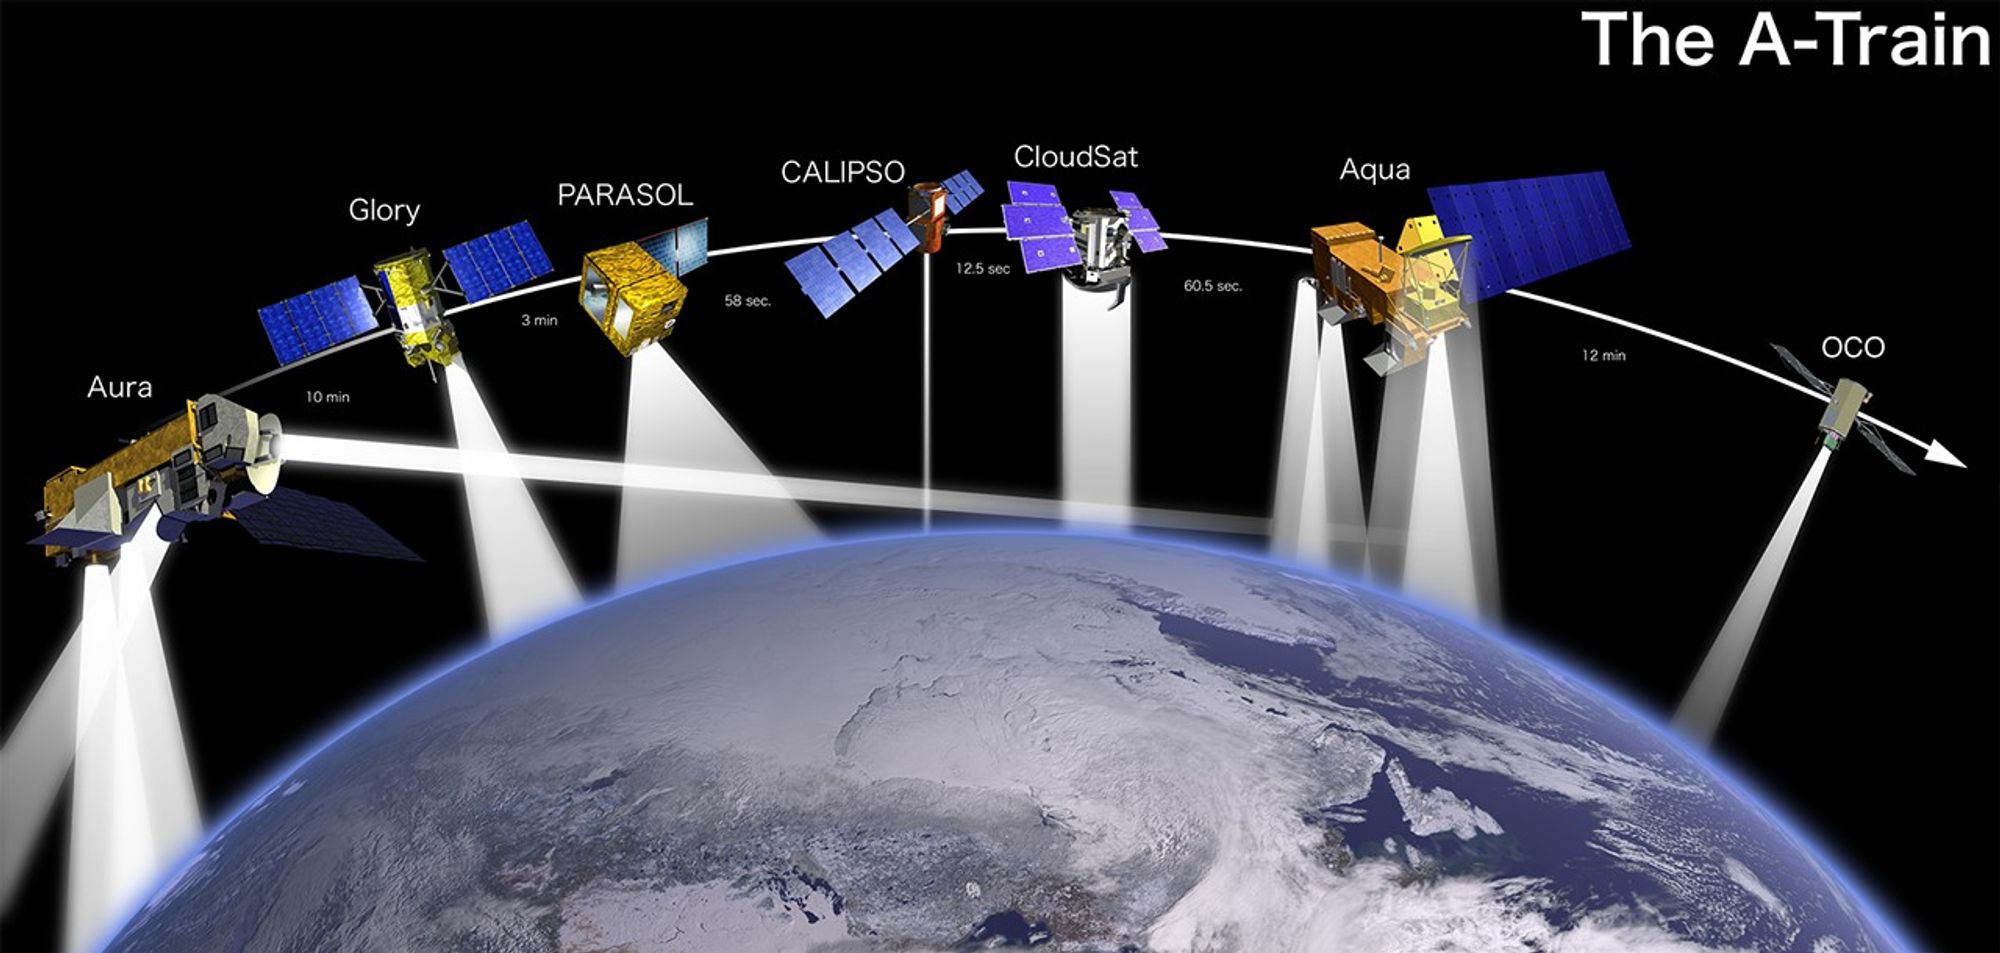
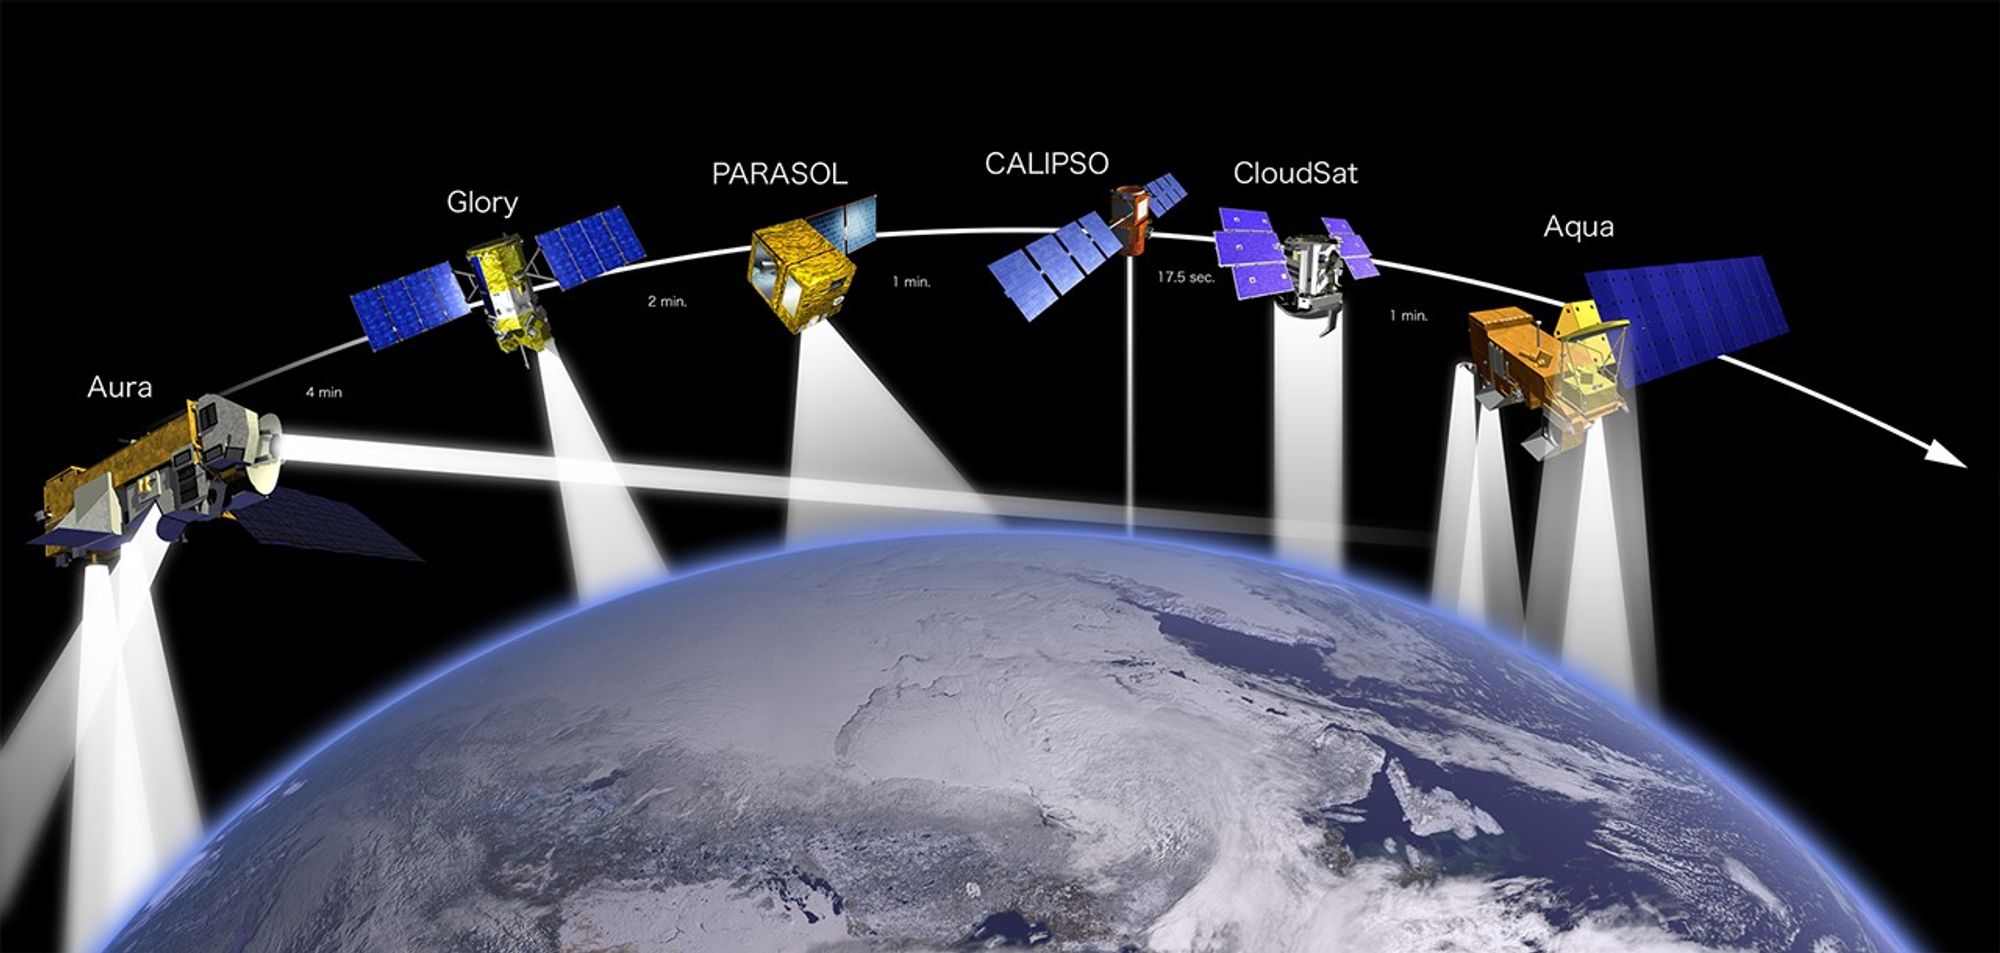
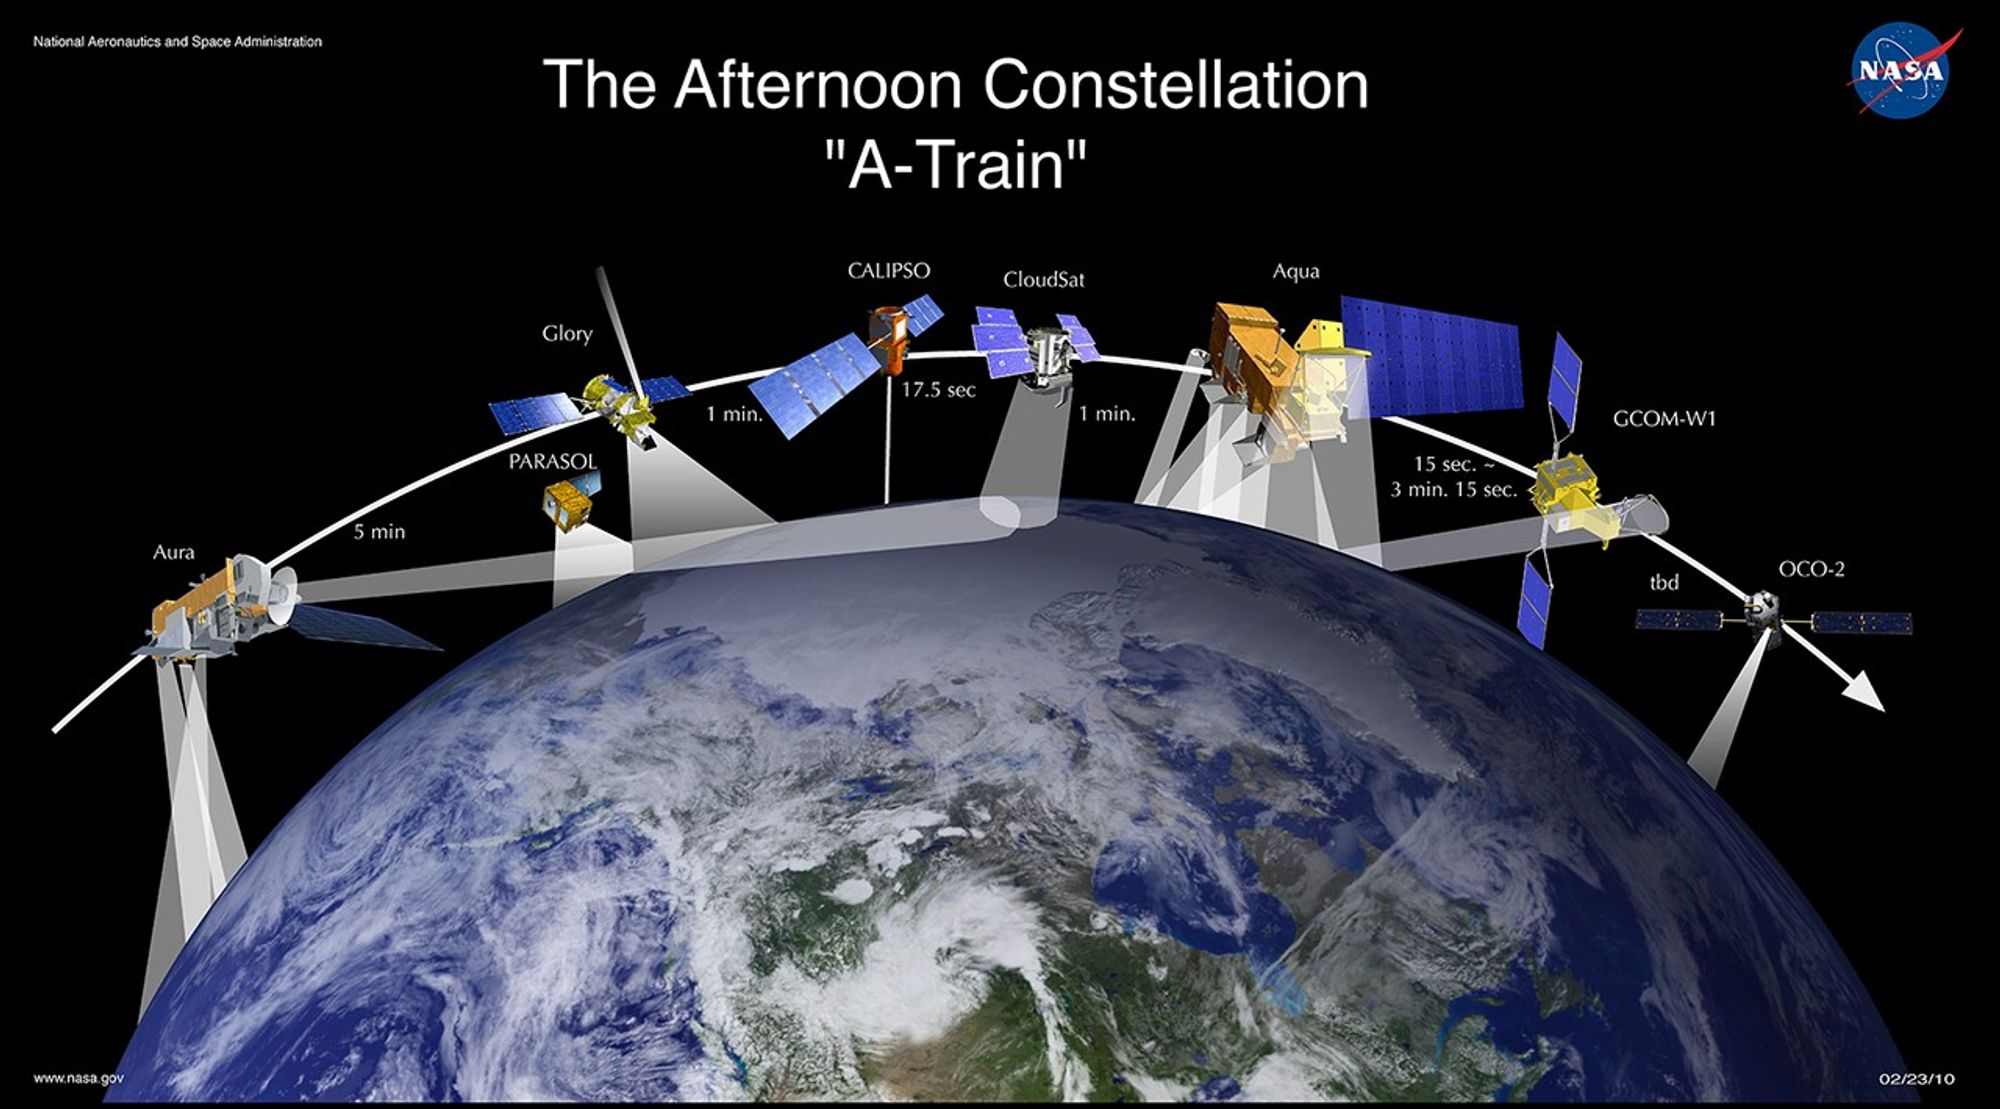
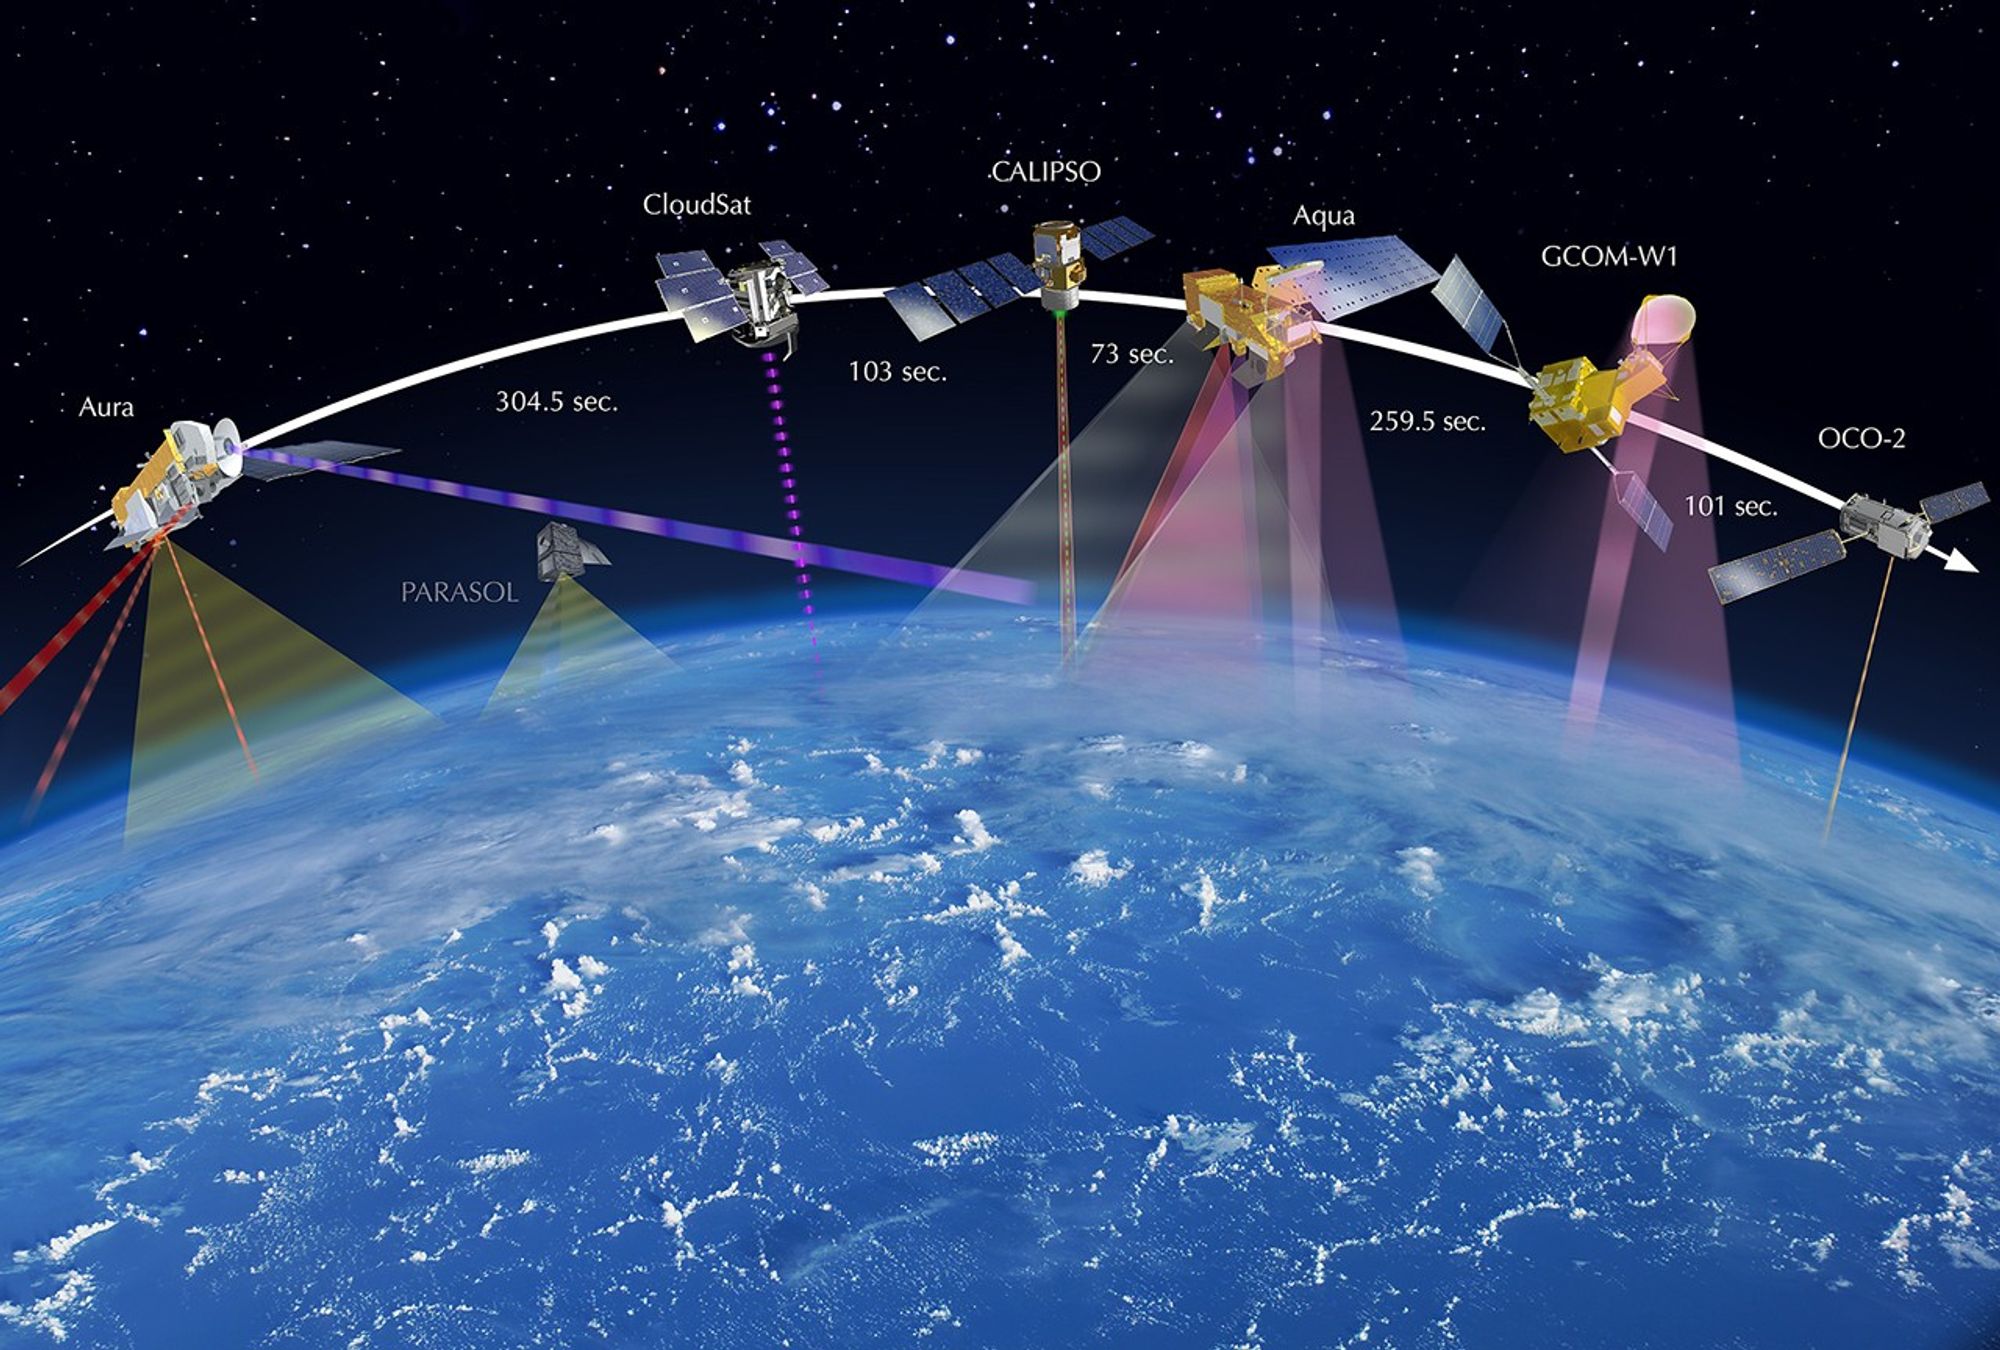
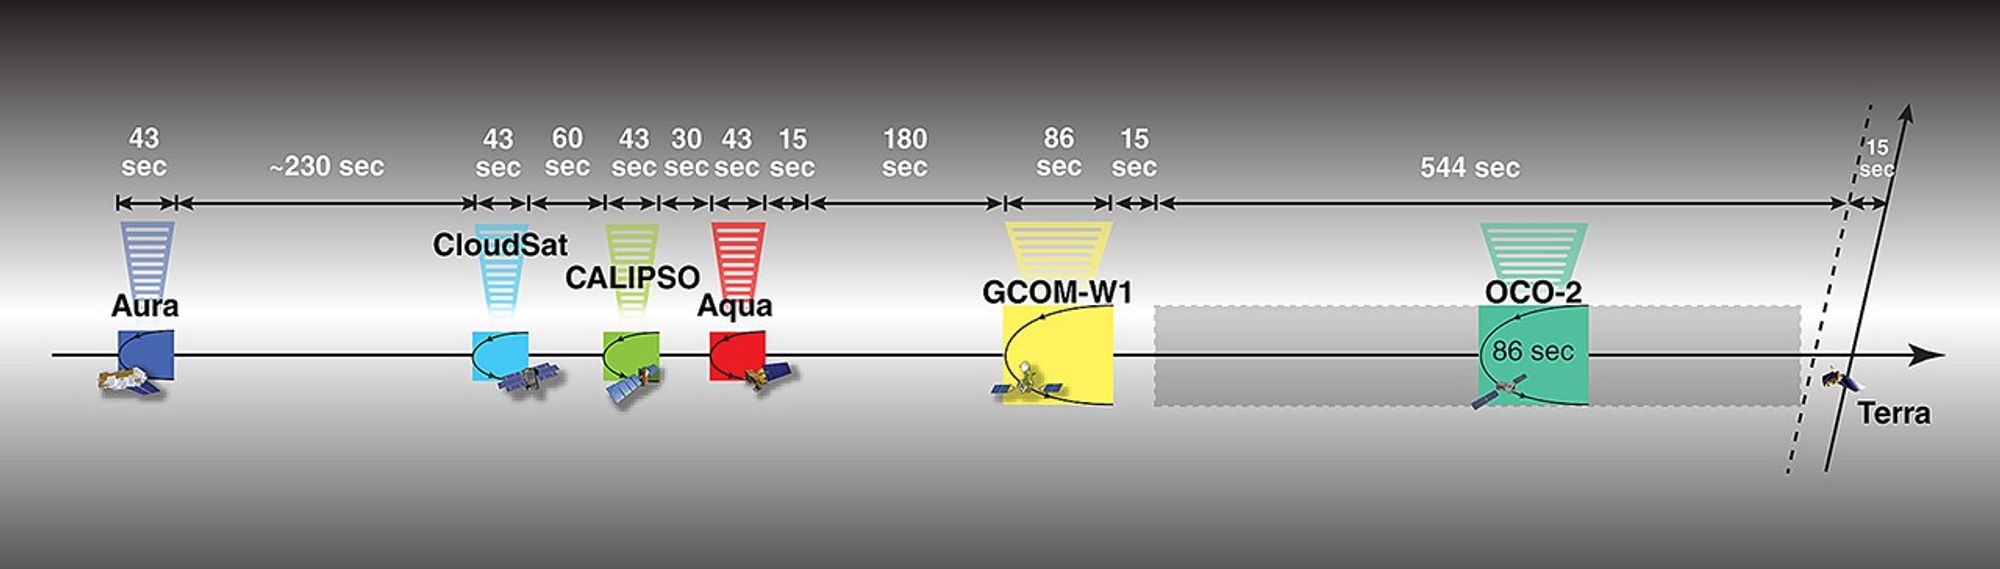
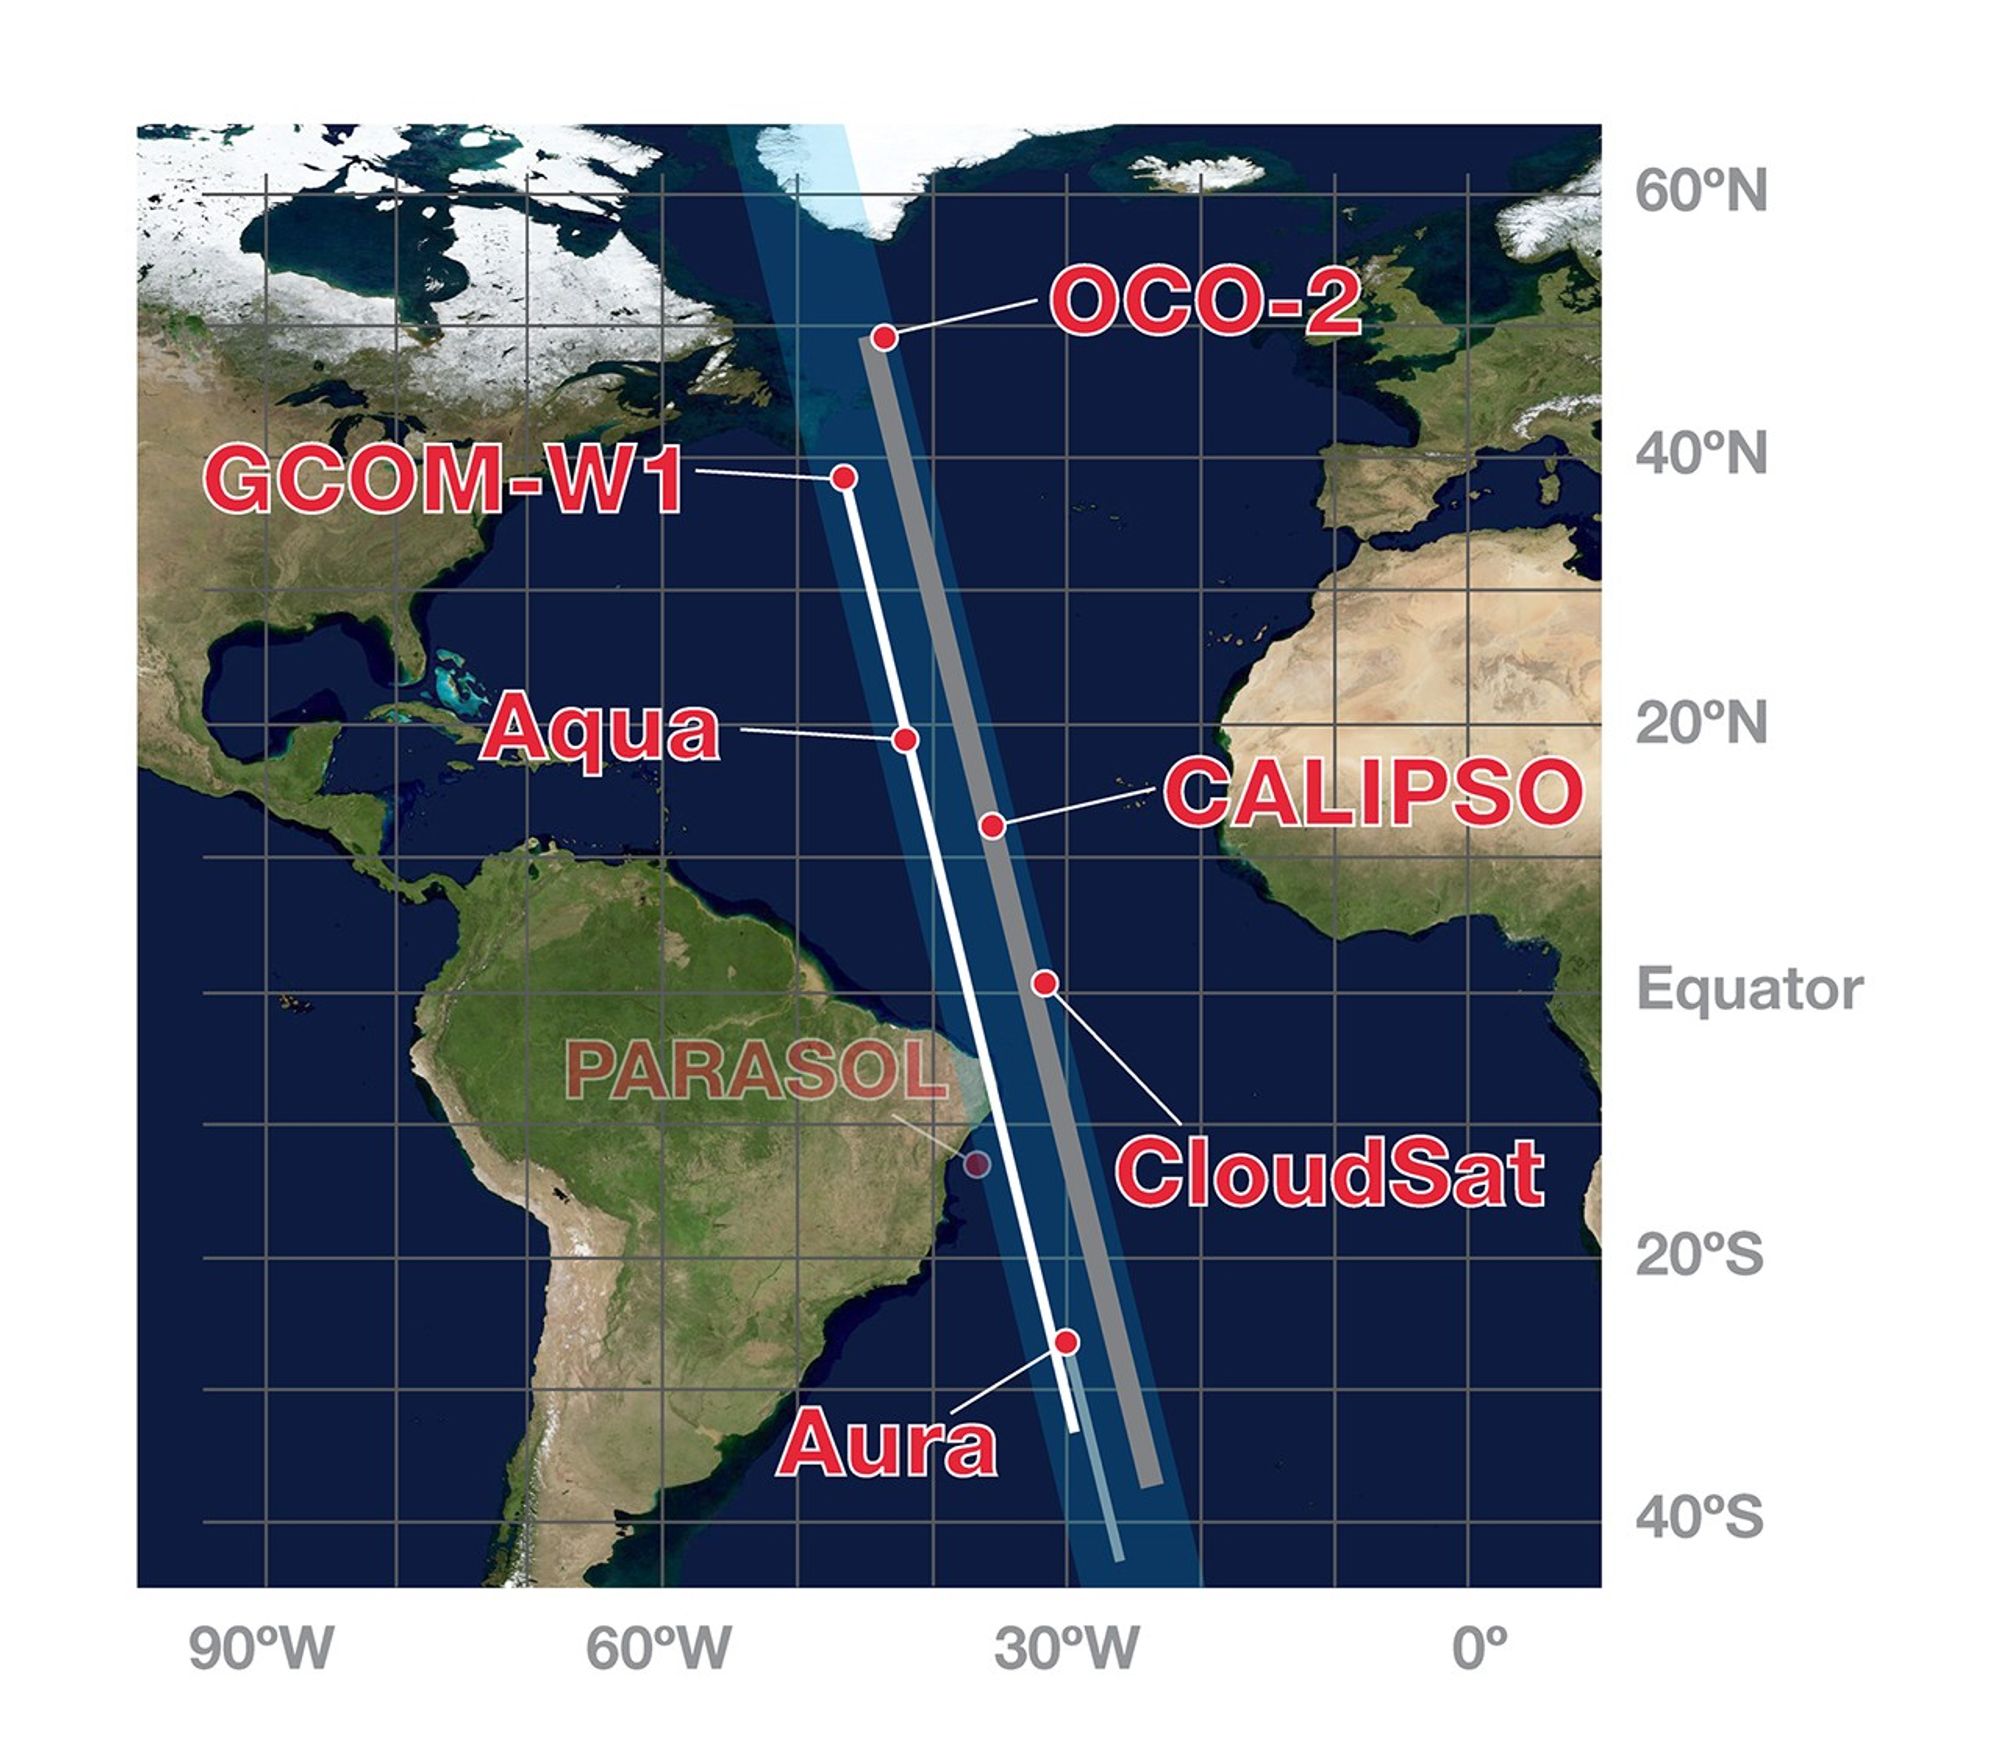
These three images show how the A-Train configuration changed from 2008-2010. Between March 2008 and March 2009, Aura moved closer to the rest of the A-Train (as indicated by the seconds in between). By February 2010, PARASOL had lowered from A-Train orbit. GCOM-W1 (launched in May 2012) and OCO-2 (scheduled for launch in 2014) were also added to the graphic.
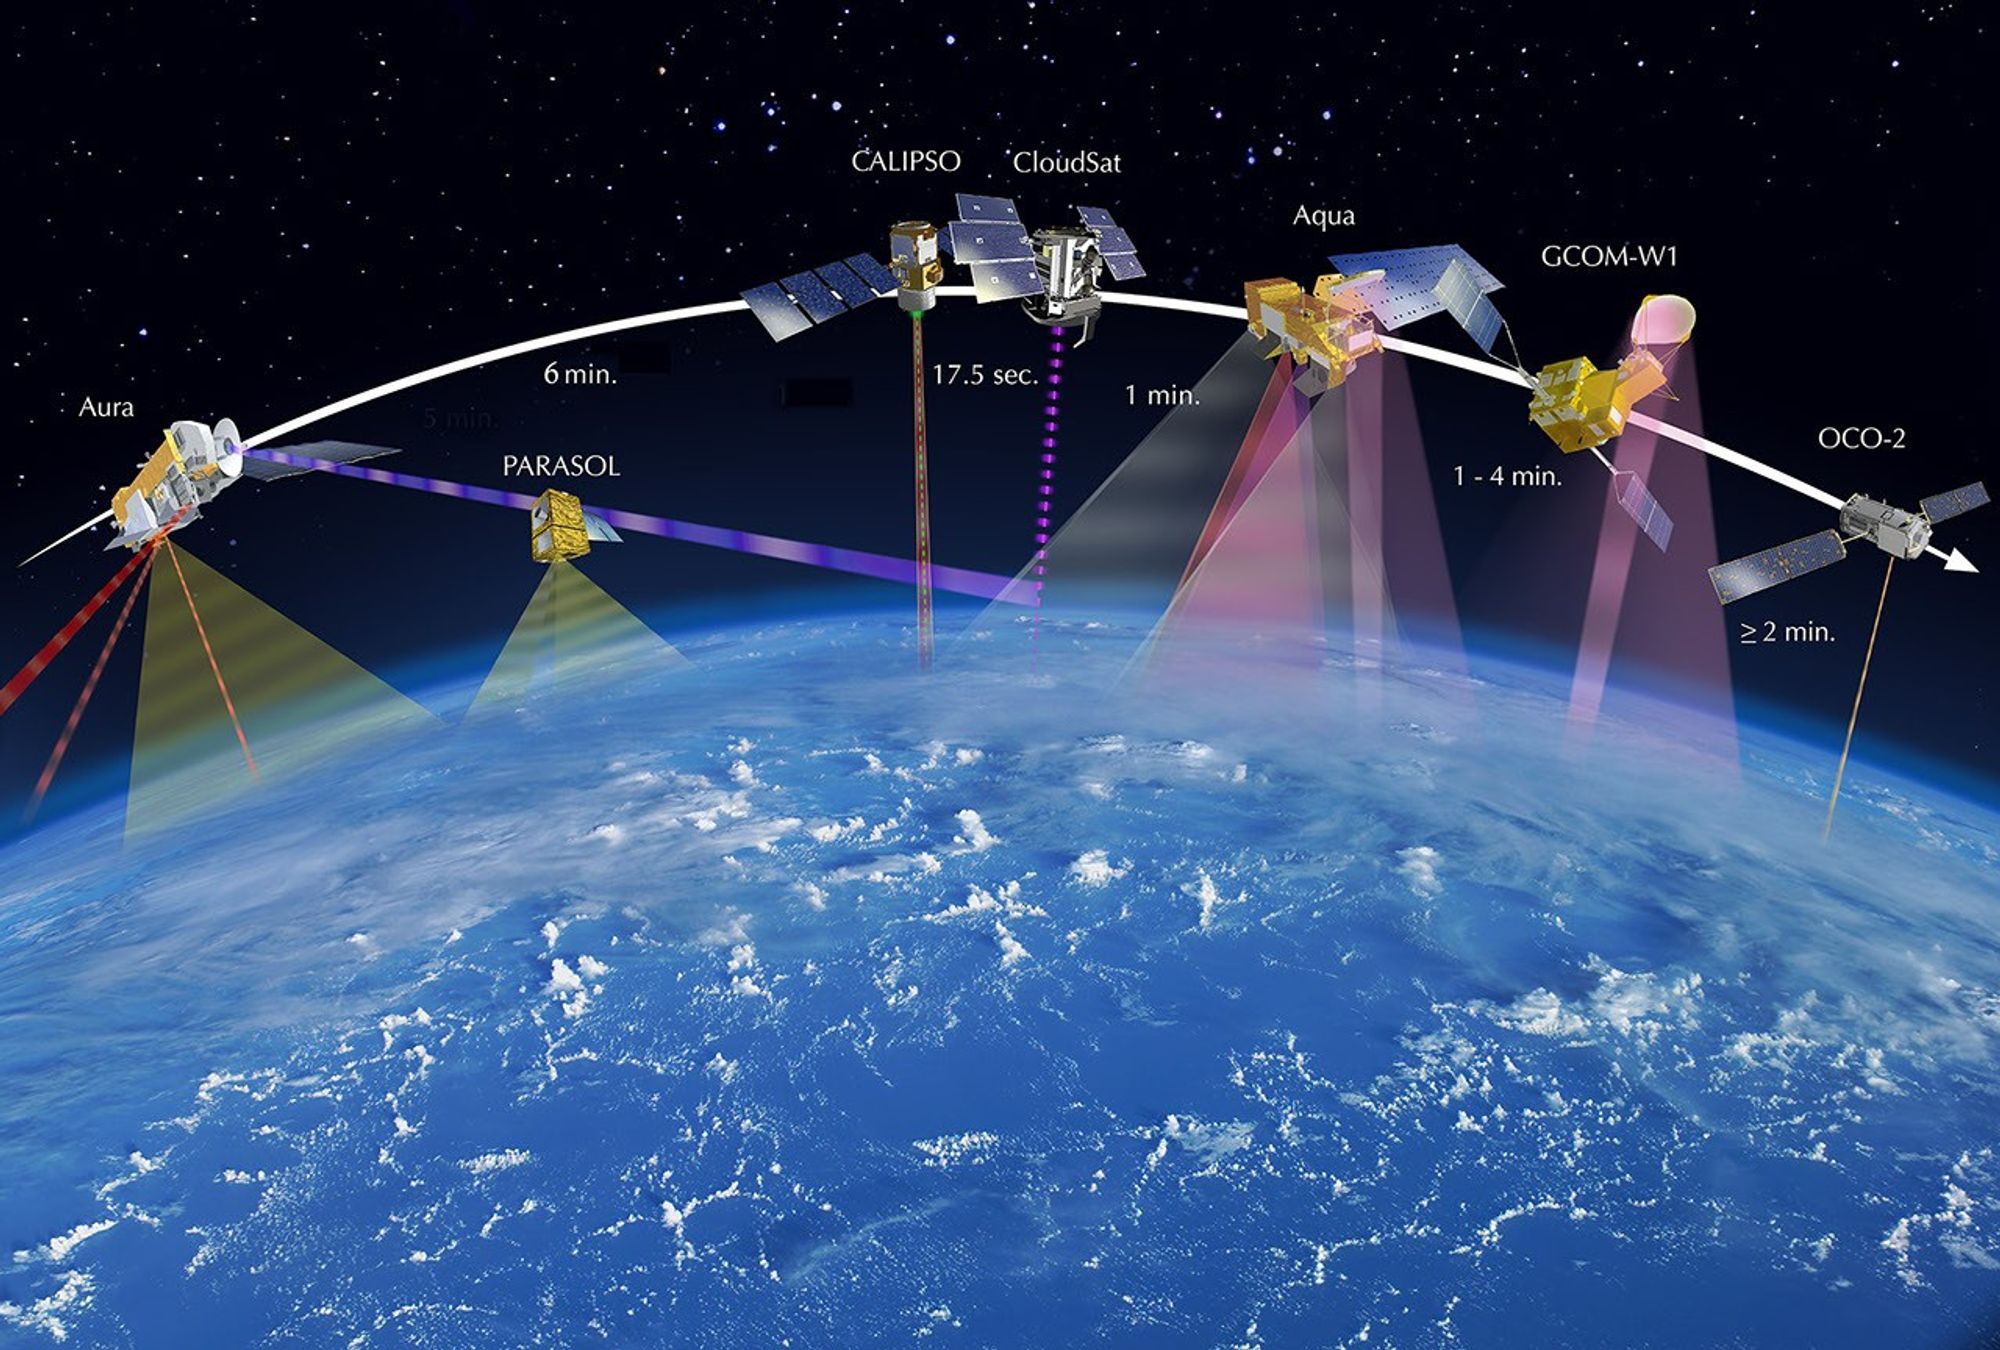
In the June 2011 graphic, the Glory spacecraft is shaded gray to indicate its launch failure on March 4, 2011. After June 2011, the Glory spacecraft was removed from the graphic completely.
CloudSat developed battery issues in September 2011 and temporarily left the A-Train. In mid-July 2012, CloudSat re-enters the A-Train, but is repositioned 108 seconds behind CALIPSO.

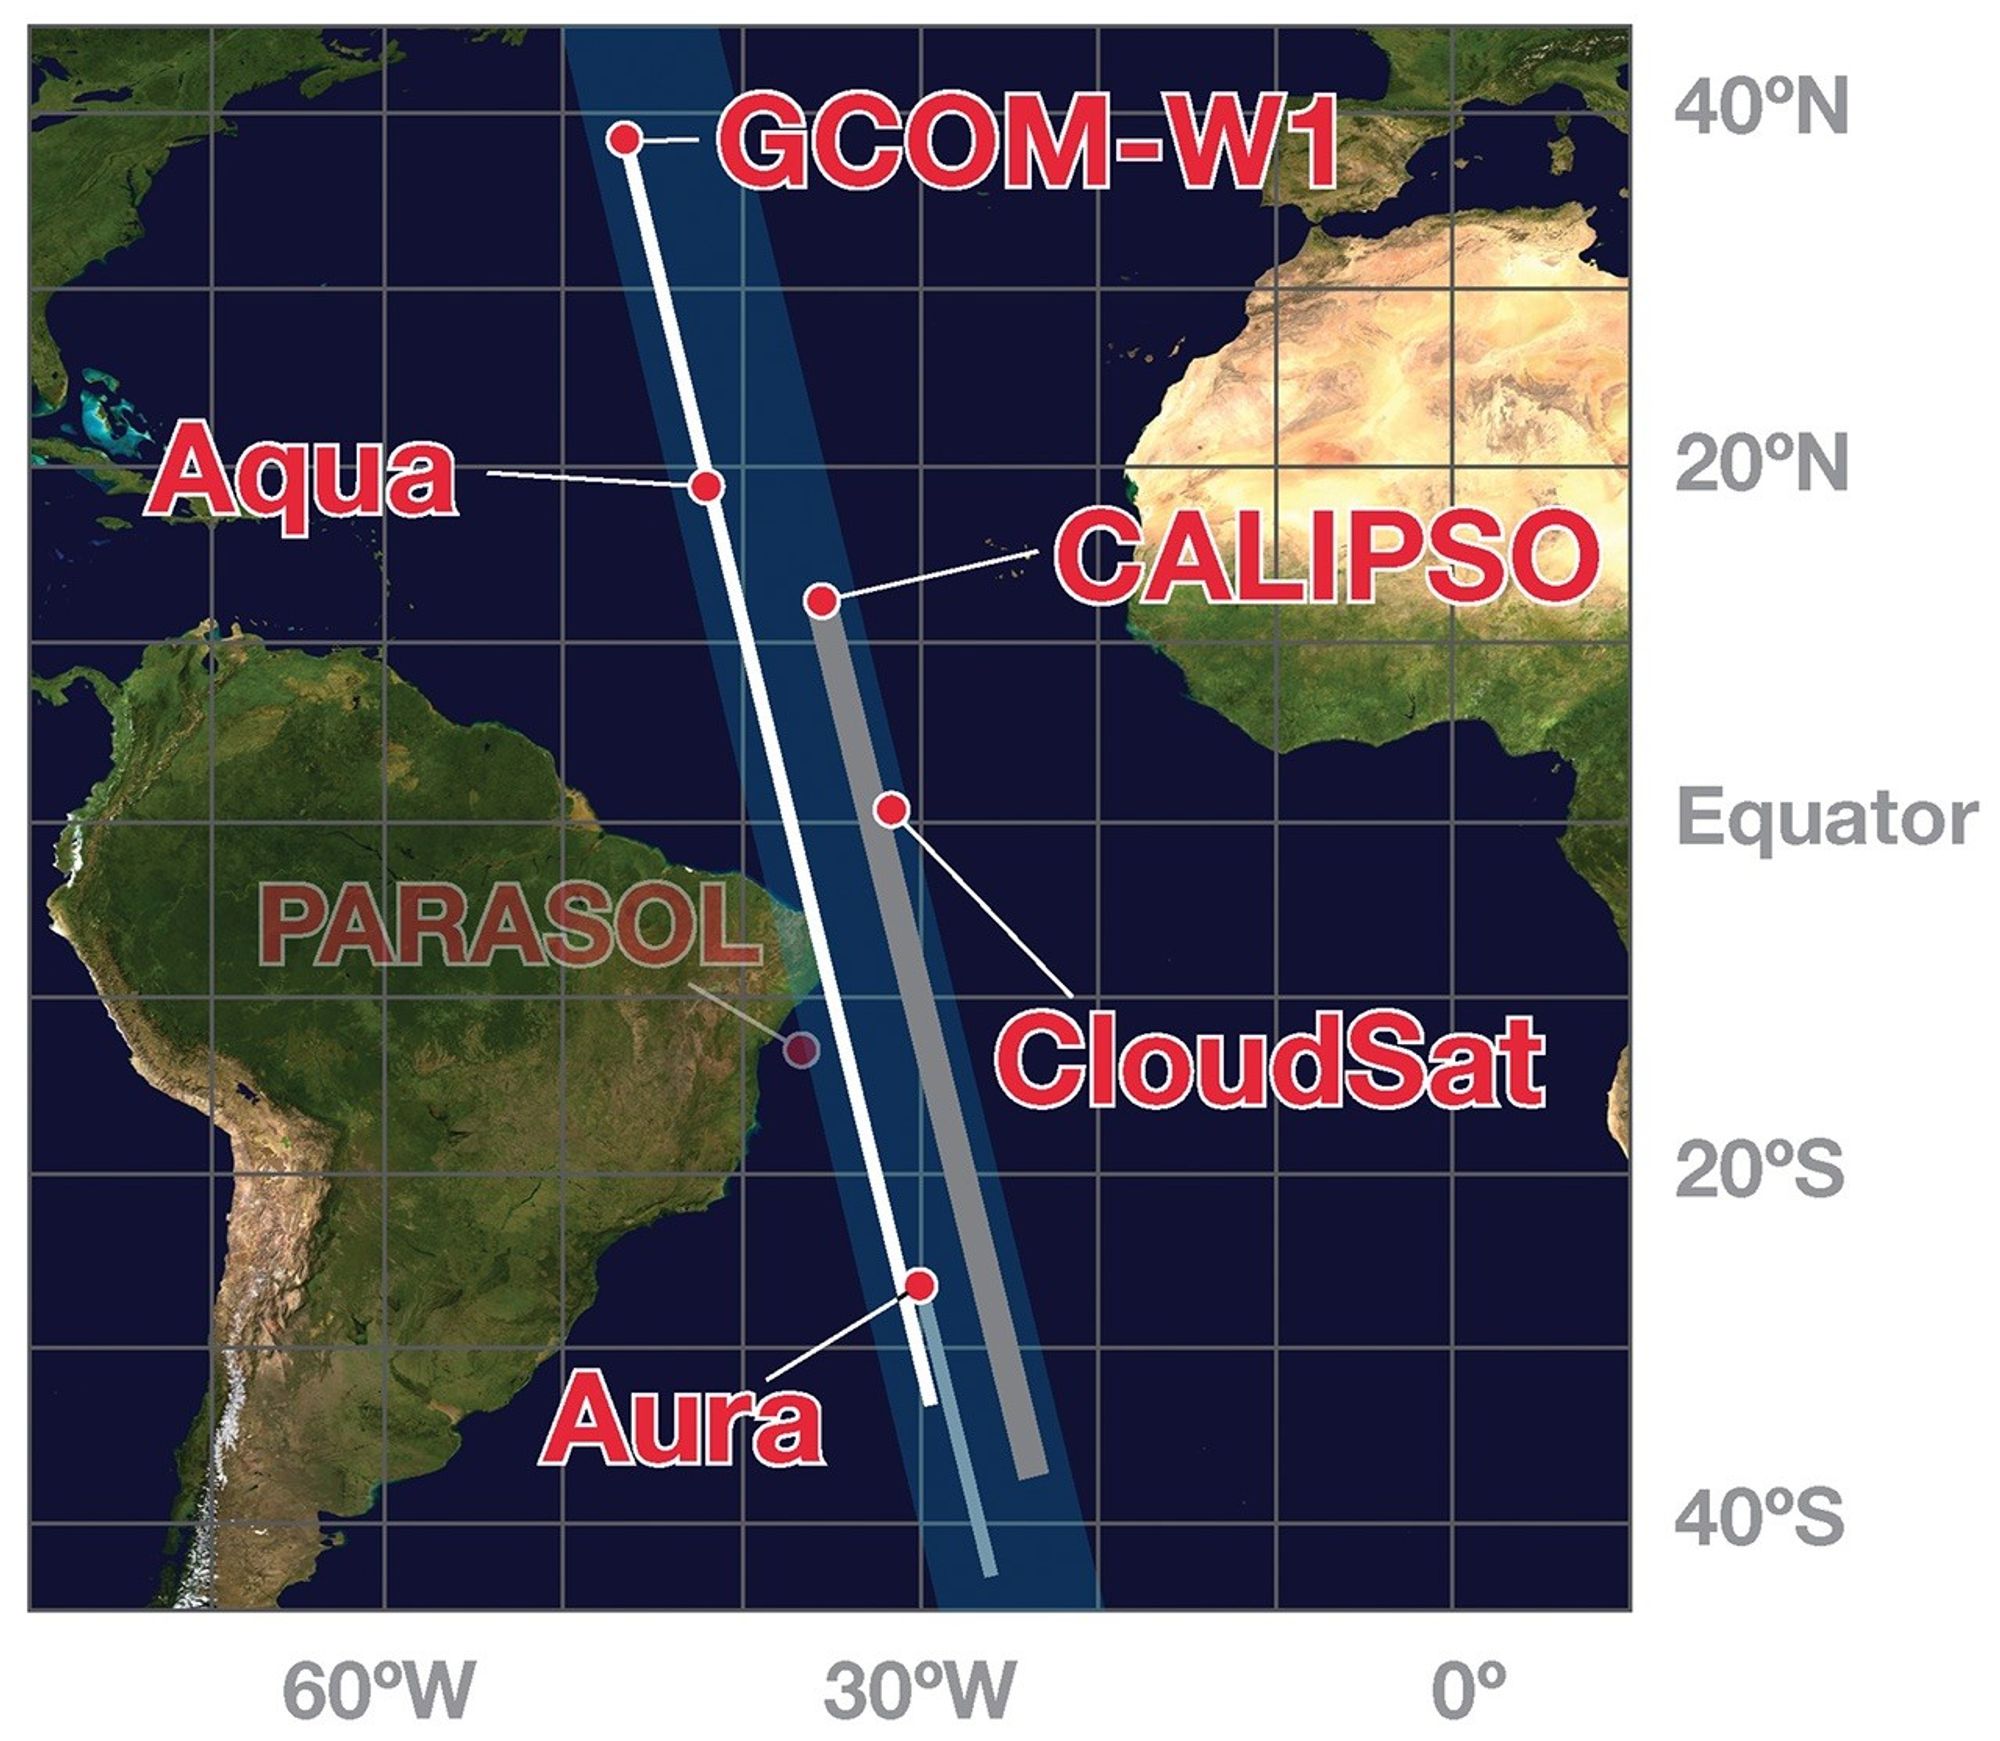
On December 18, 2013, PARASOL ceases operation and fully exits the A-Train.

Note time separation adjustment between Aura and CloudSat.
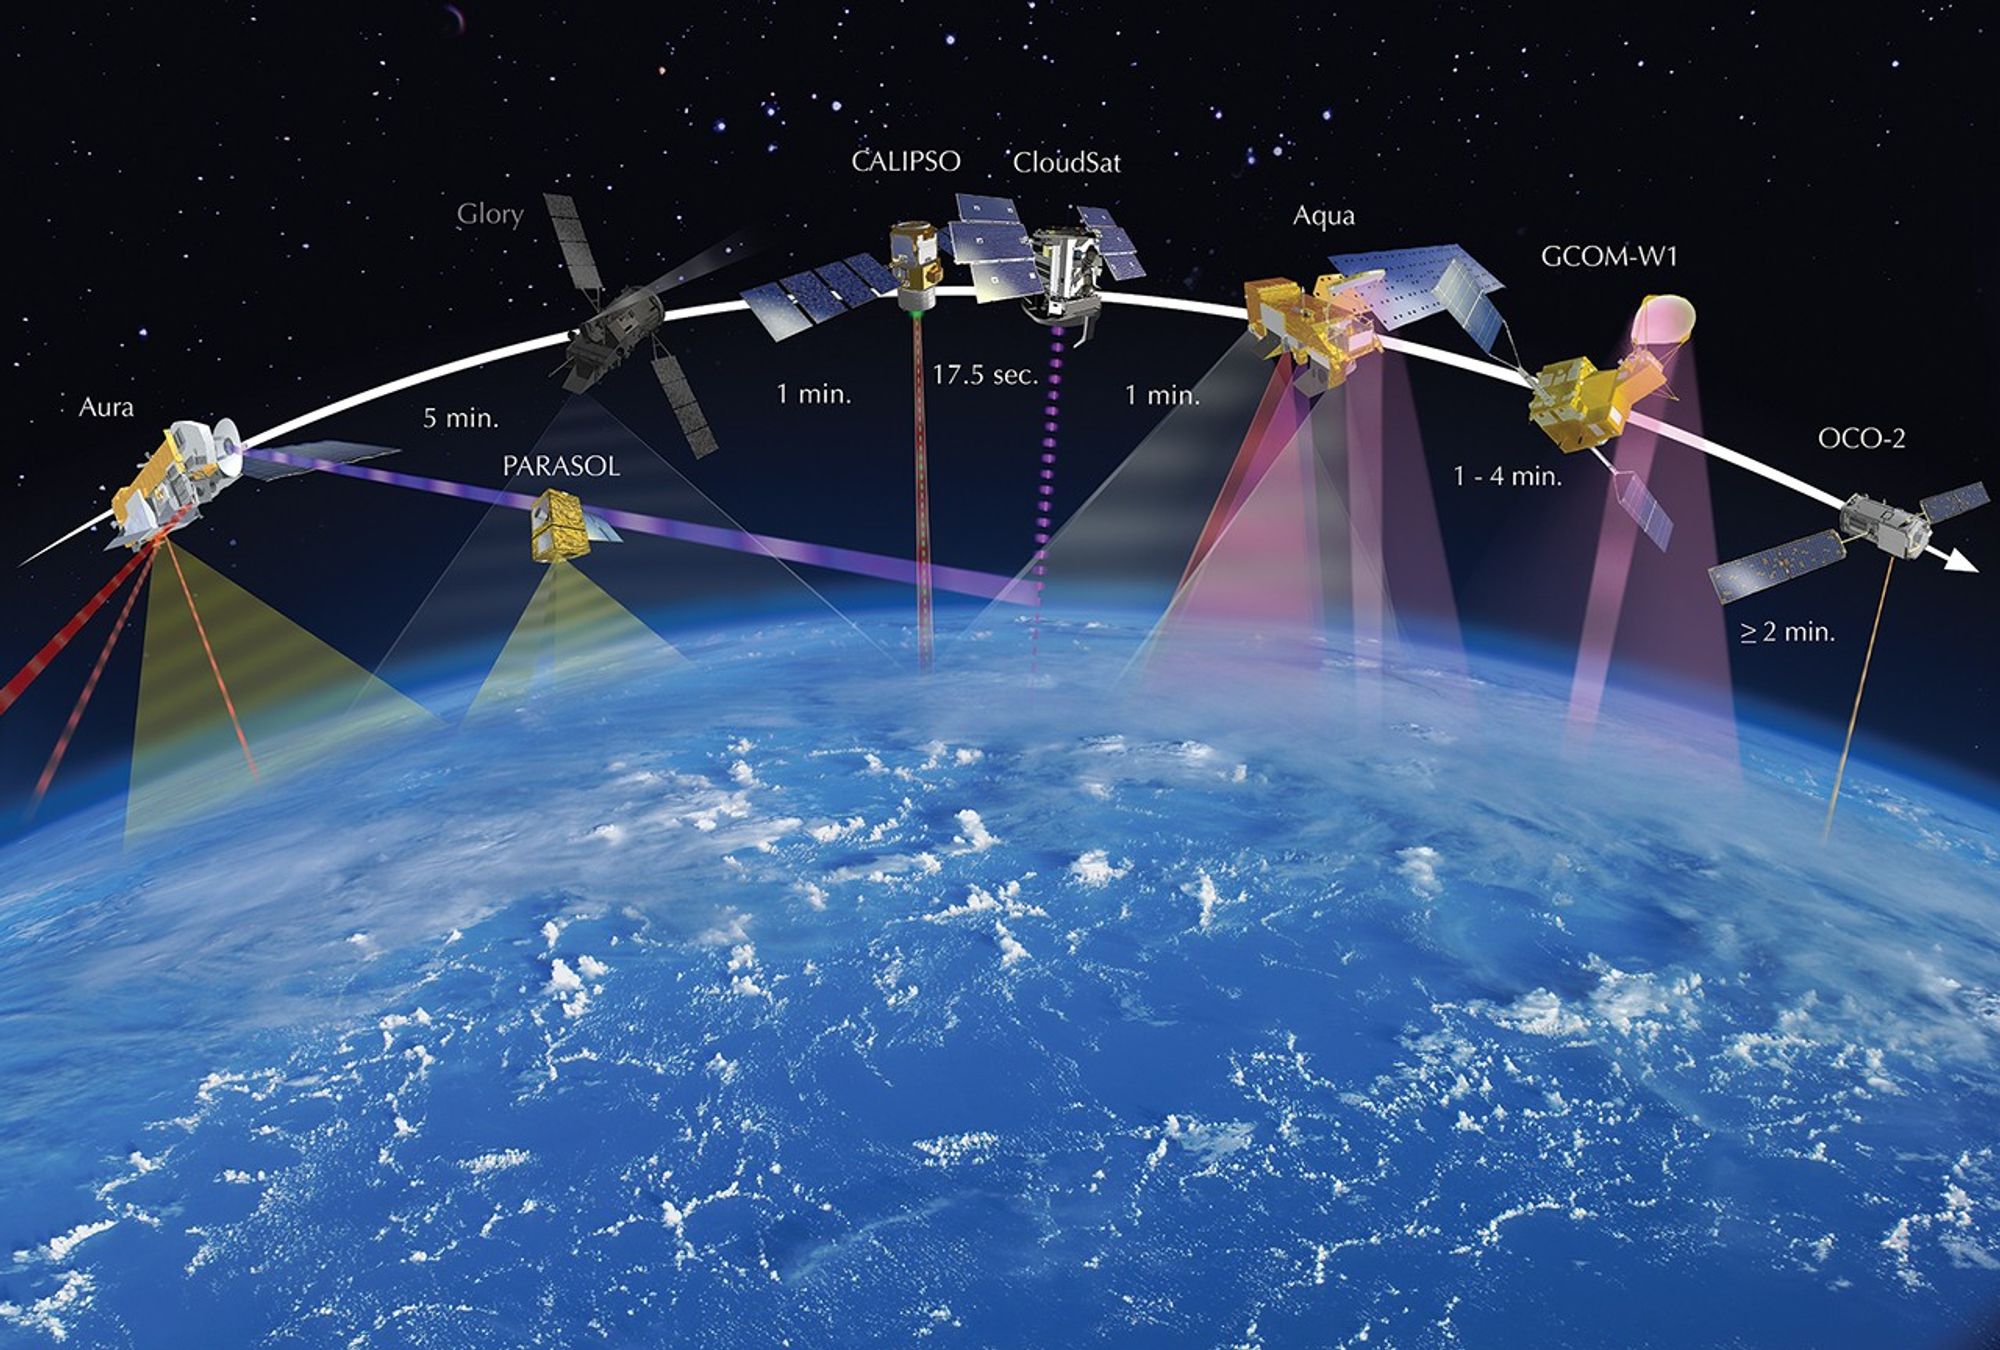
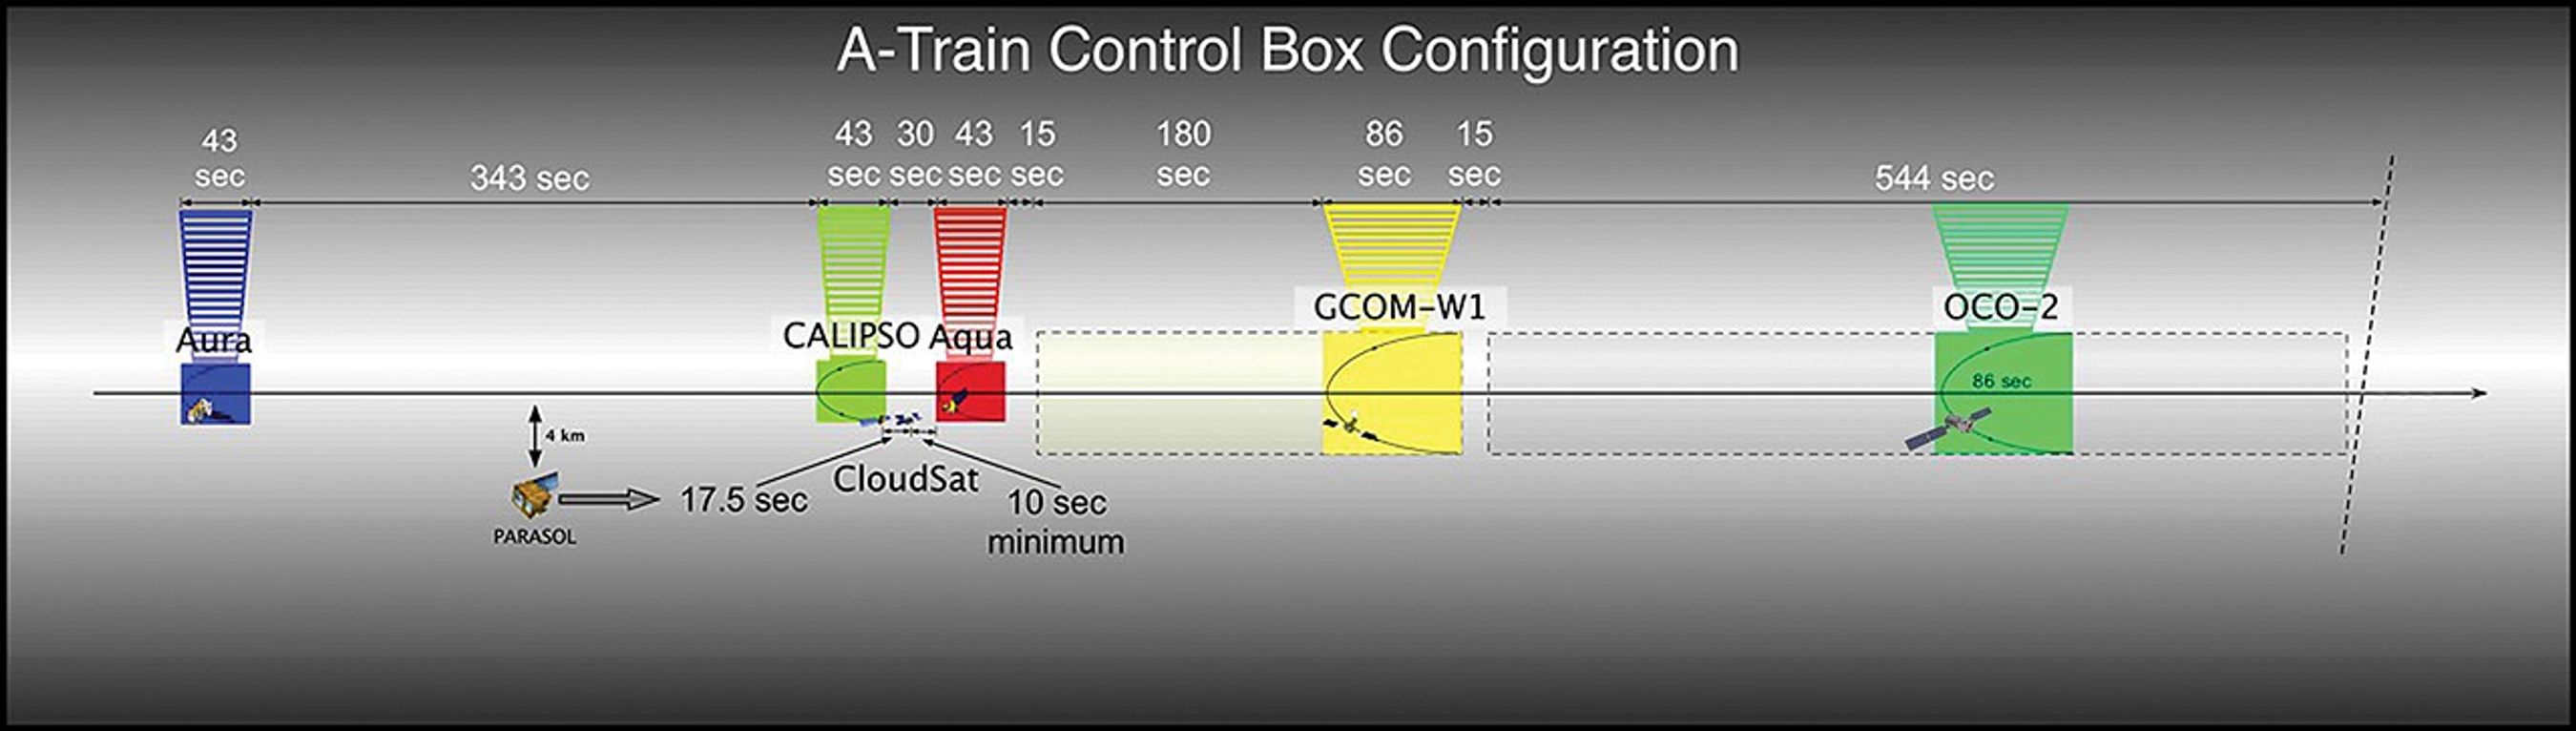
Prior to November 16, 2011, PARASOL flew 15 seconds behind CALIPSO‘s control box, as depicted in the graphic from 2010. On that date, PARASOL was lowered a second time to 9.5 km below A-Train orbit, hence PARASOL‘s placement in the graphic from 2011. OCO-2 was also added to the 2011 graphic. The first lowering of PARASOL occurred in December 2009.
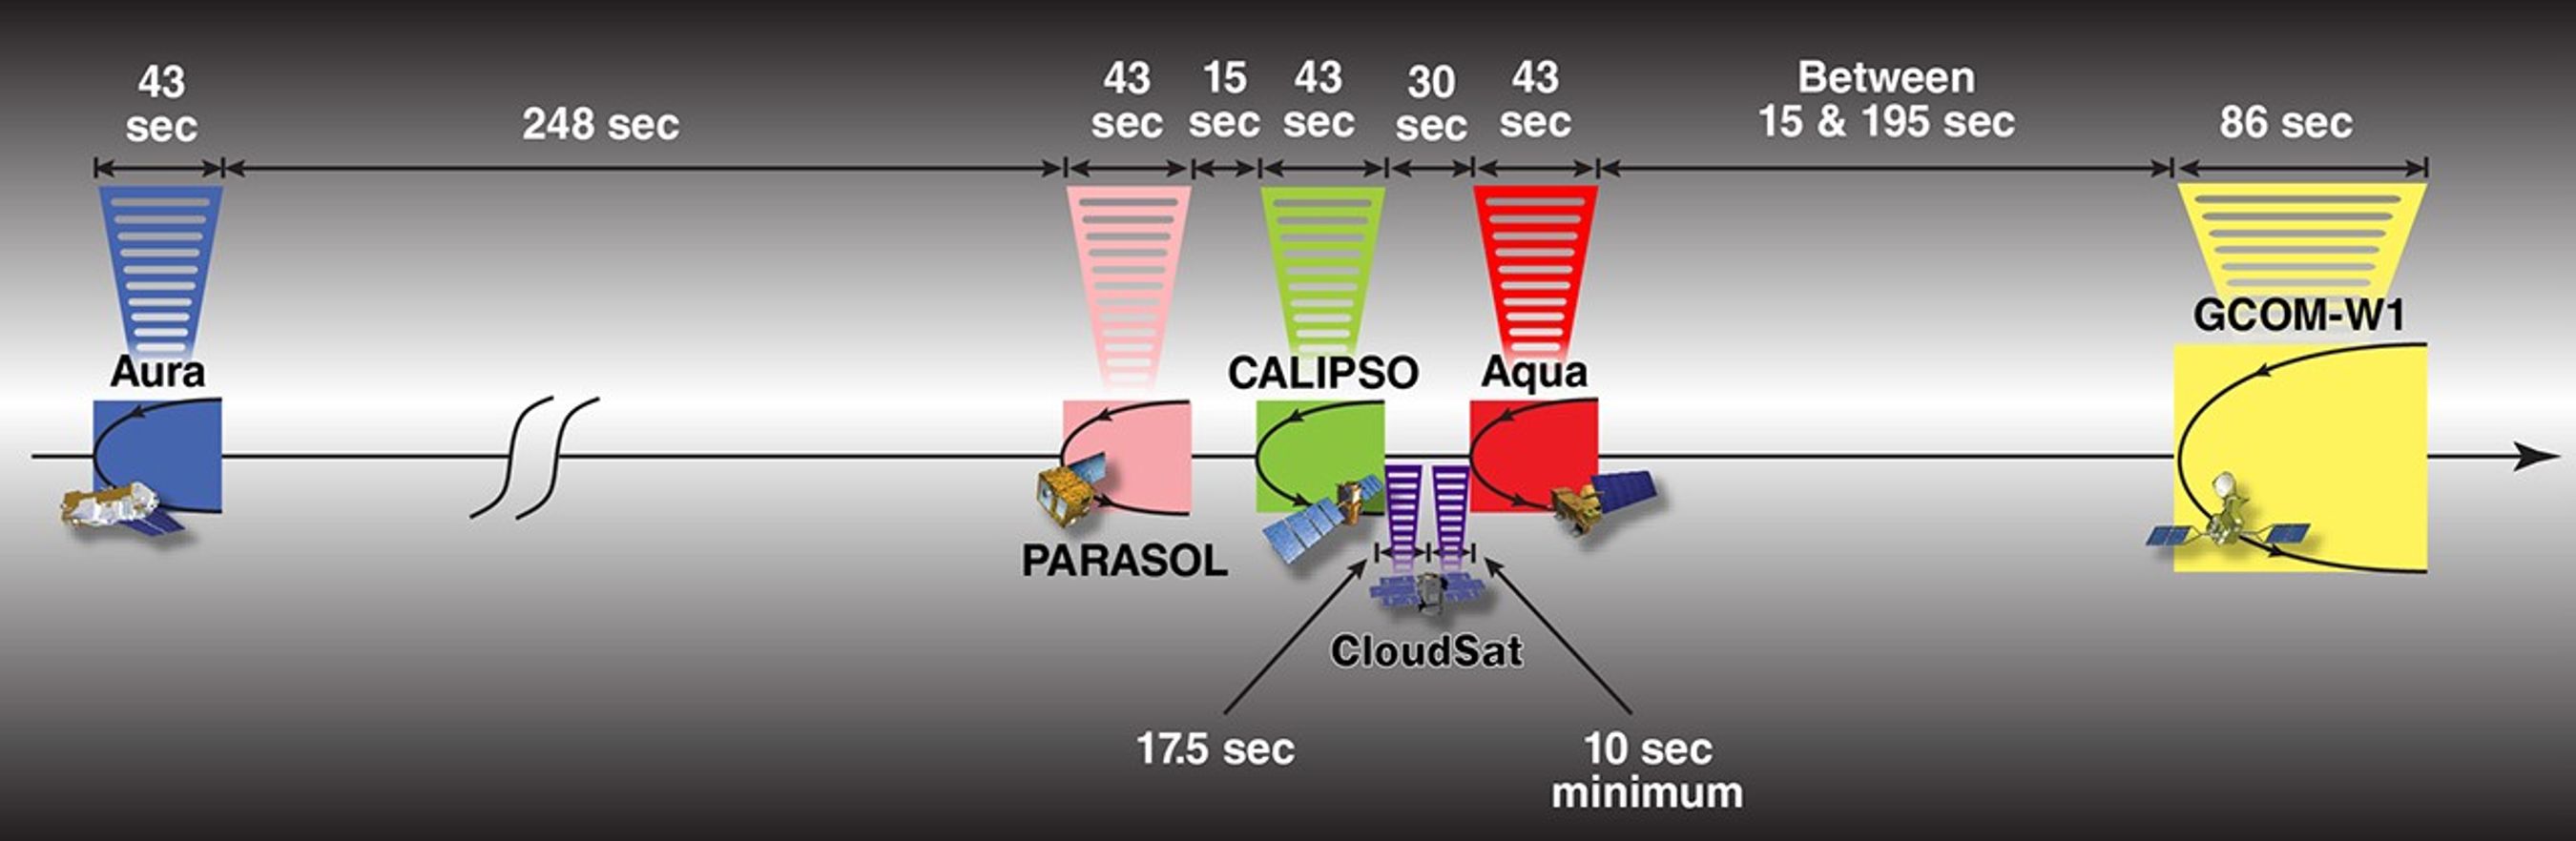

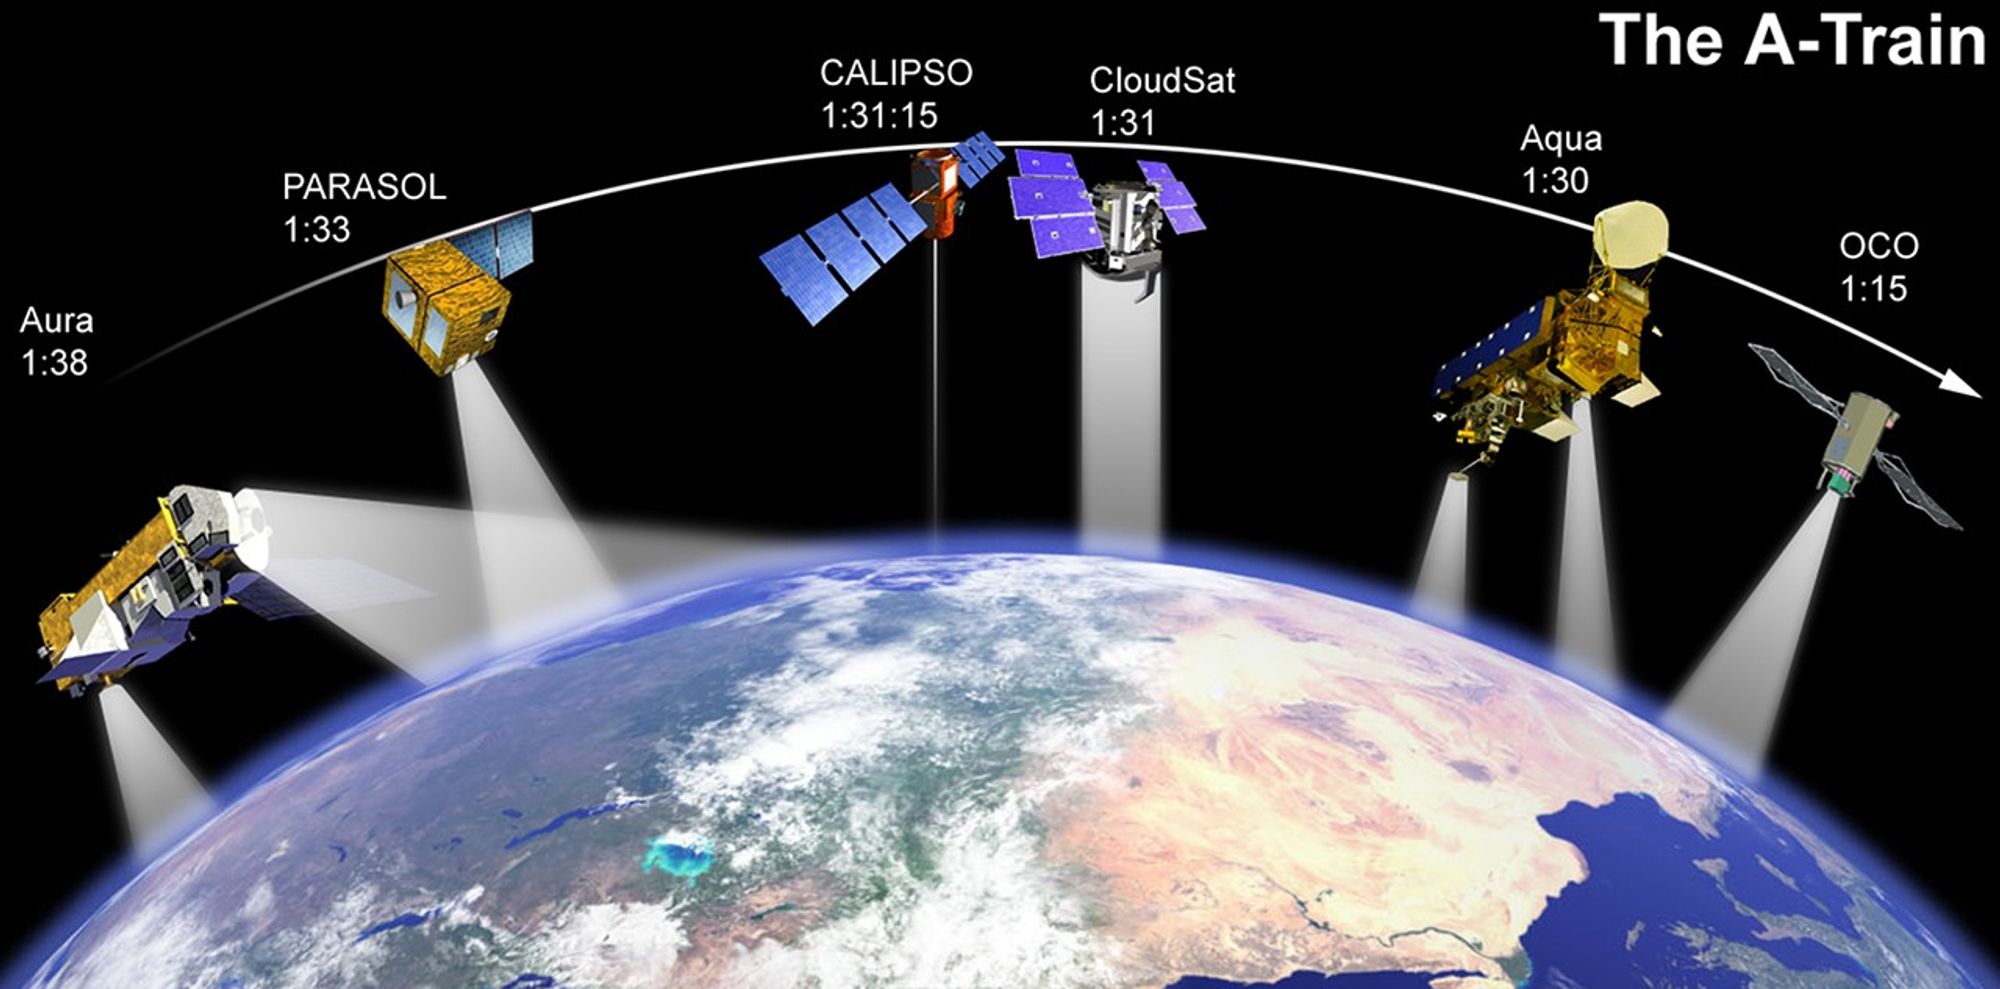
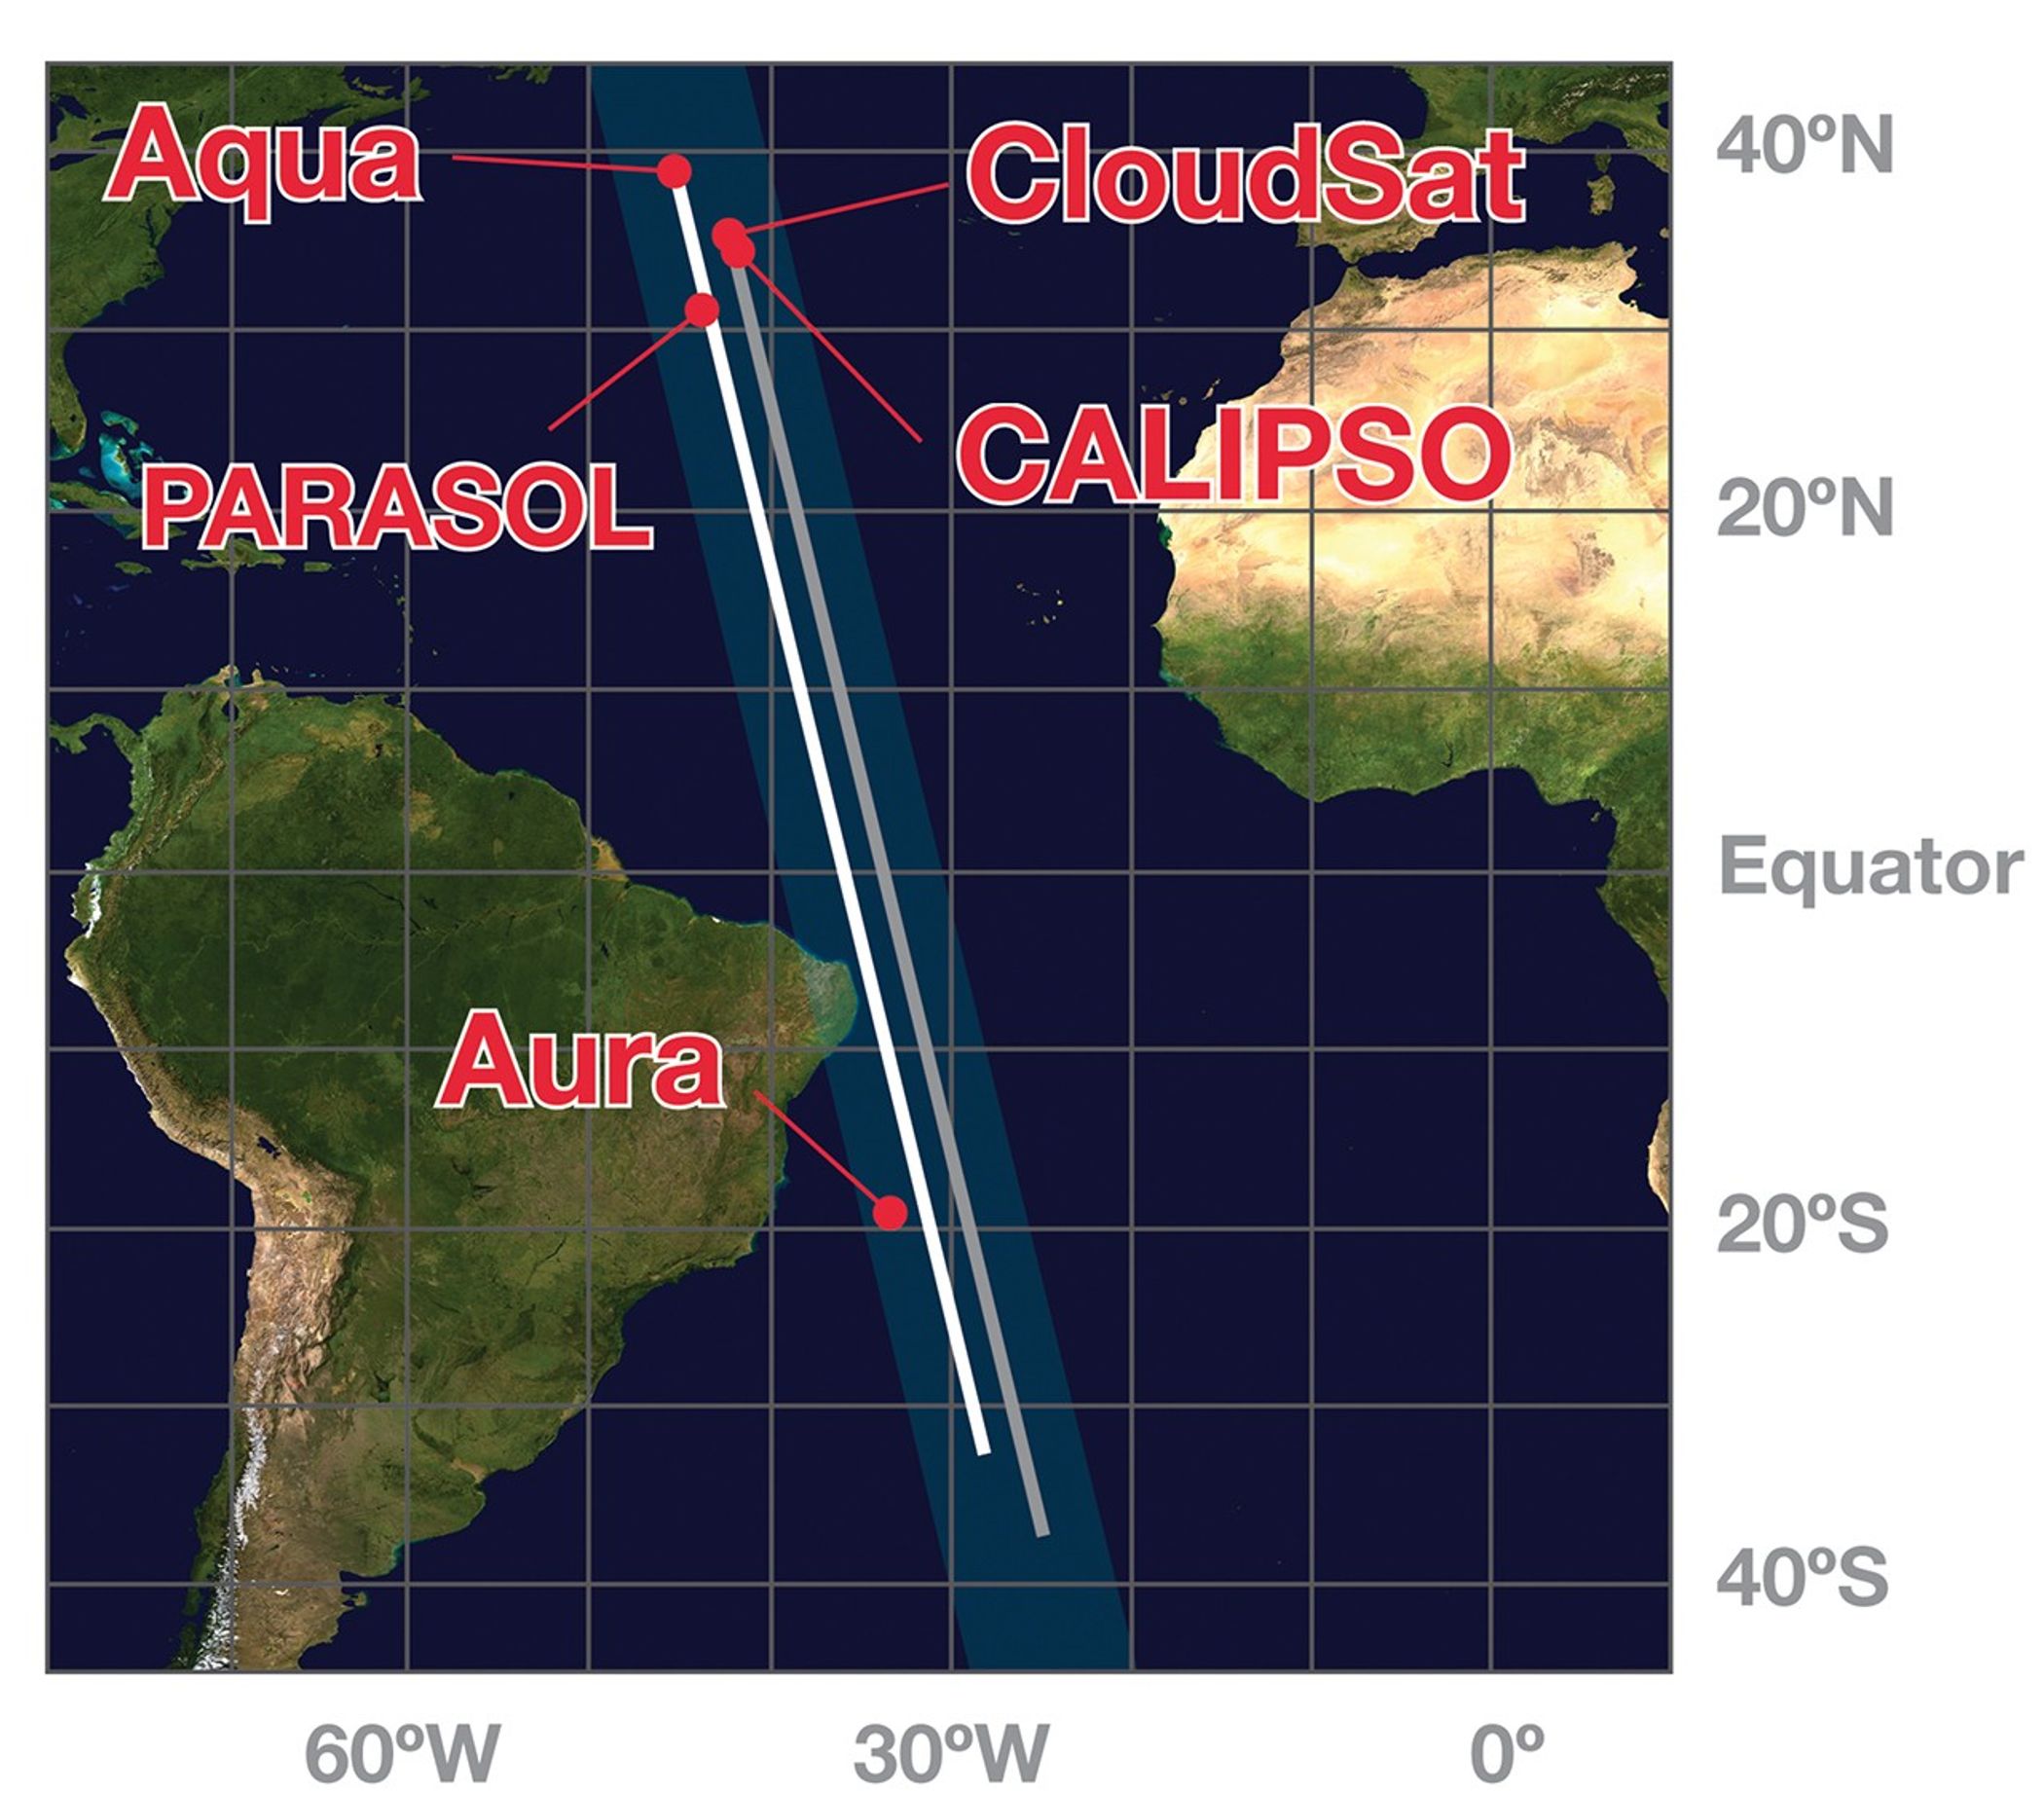
This image shows the order and relative distance between the satellites that made up the A-Train in 2010. Note that GCOM-W1 and OCO-2 are not depicted. Also note that prior to maneuvers that followed an April 2011 battery anomaly, CloudSat flew ahead of CALIPSO.
In mid-November 2011, PARASOL is lowered to 9.5 km below the A-Train and continues operations. GCOM-W1 joins the A-Train on June 29, 2012. In mid-July 2012, CloudSat is repositioned 108 seconds behind CALIPSO.
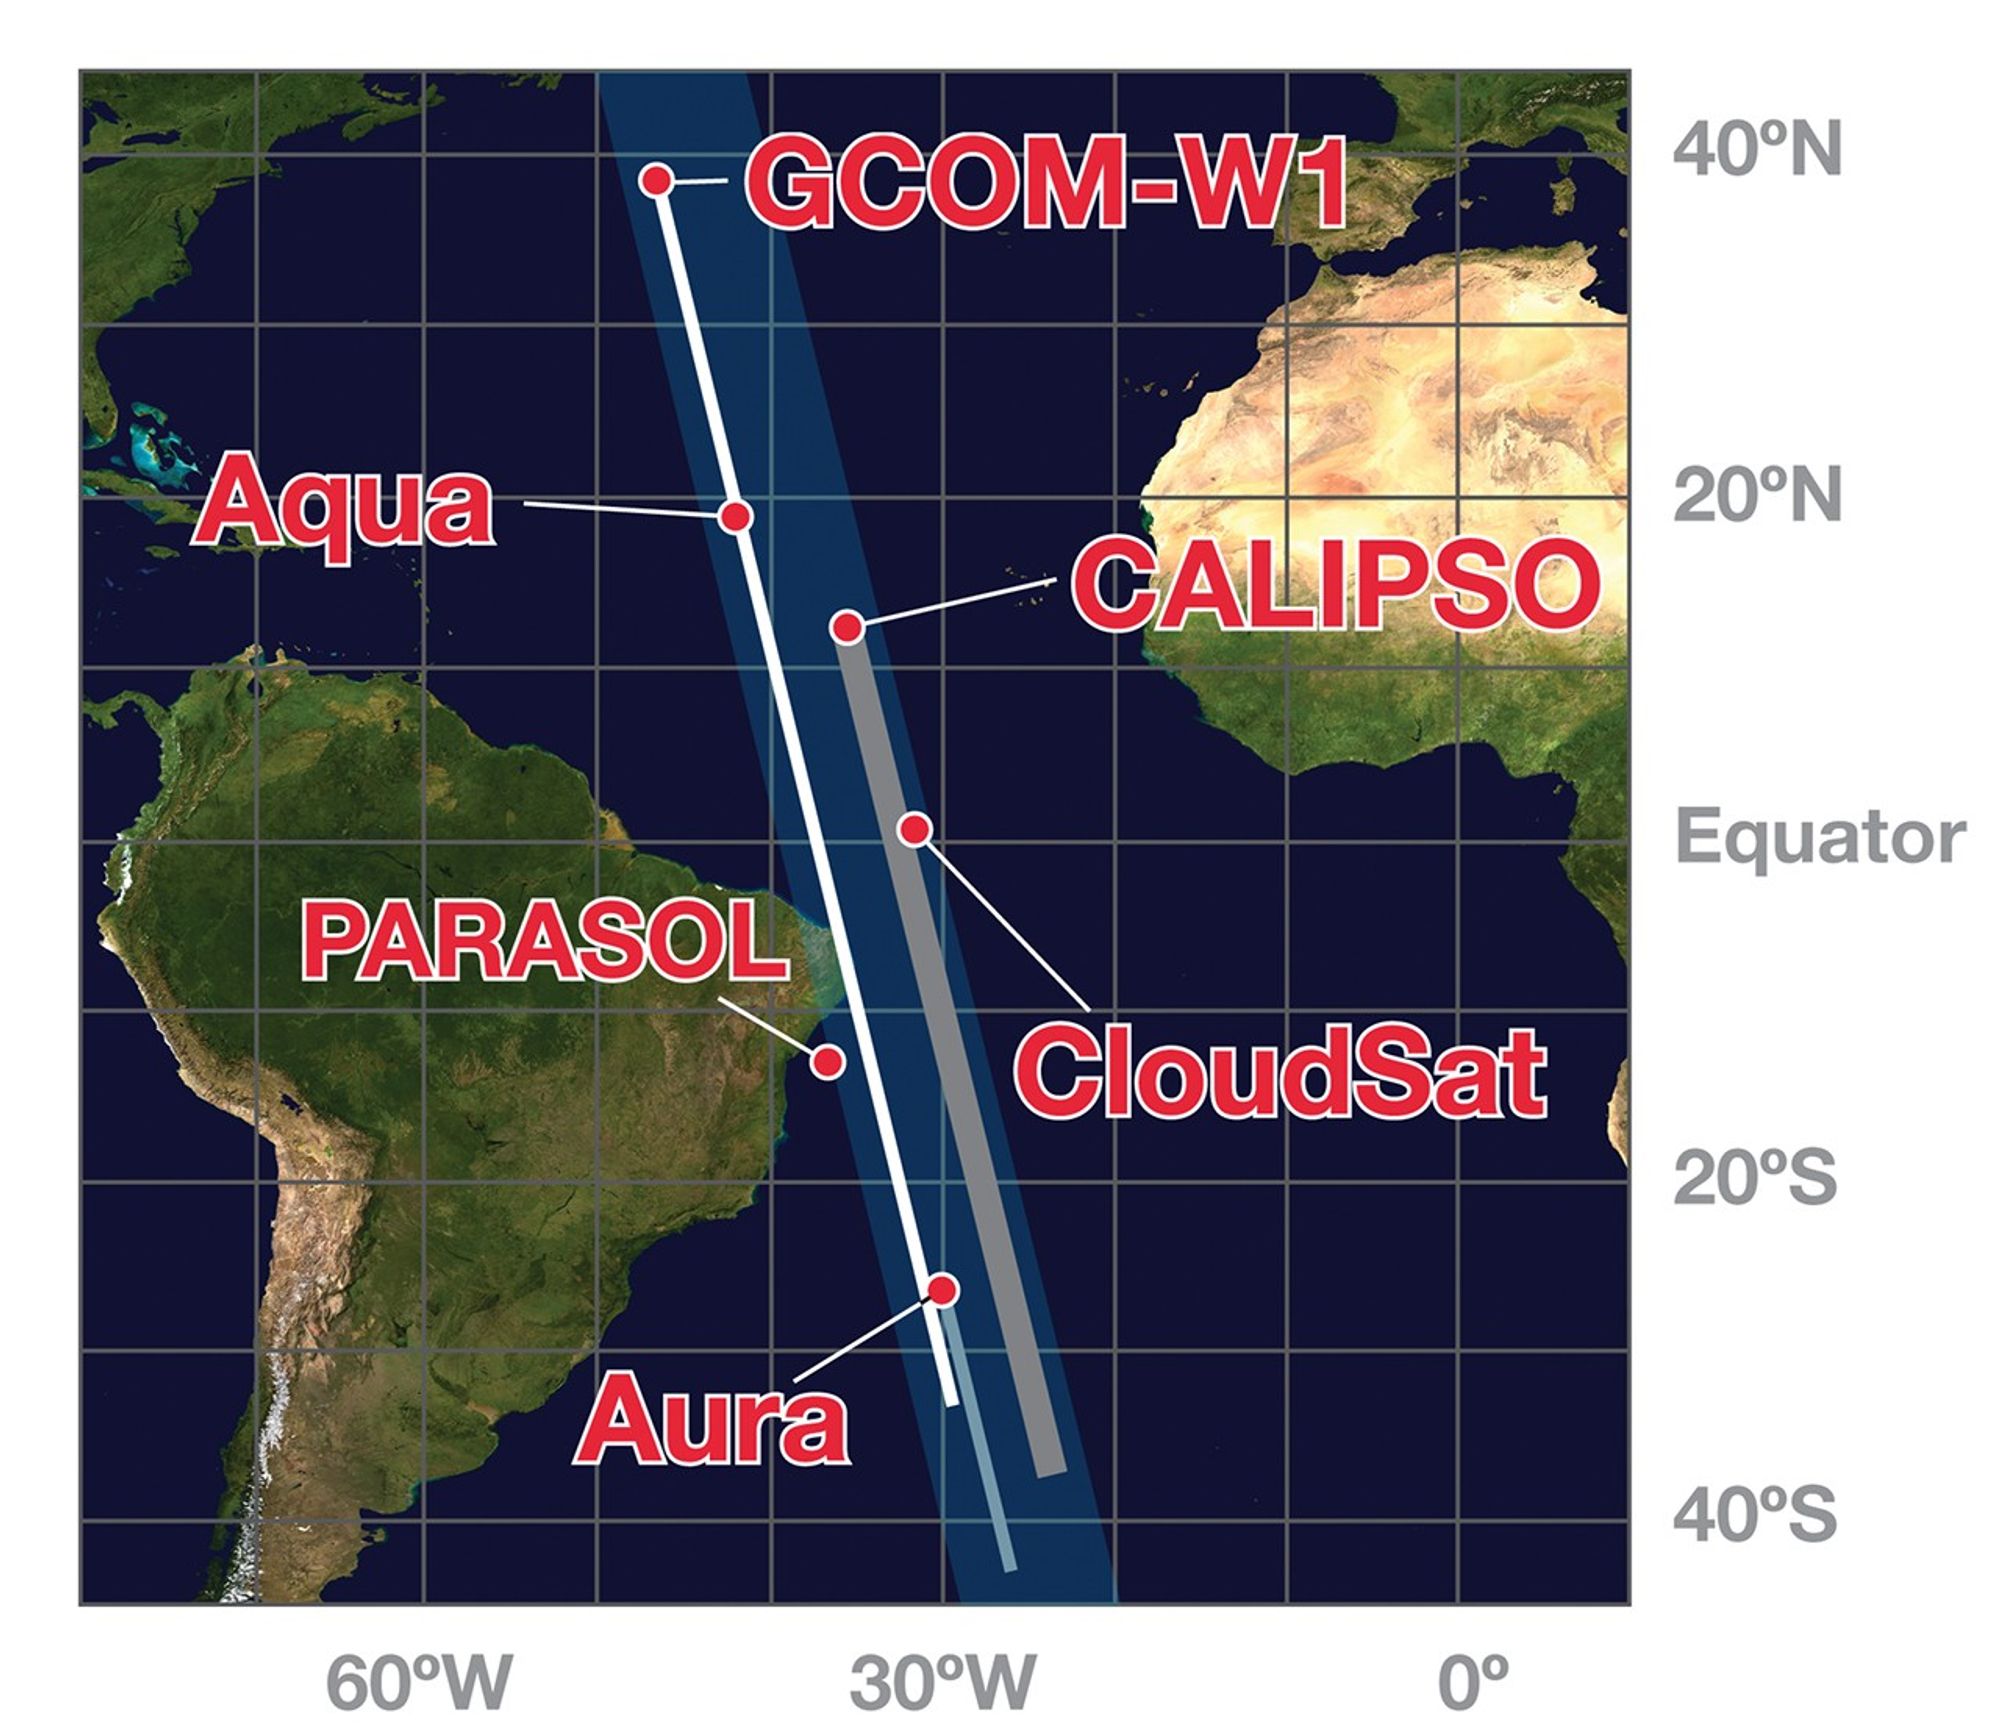
PARASOL leaves the A-Train and is decommissioned on December 18, 2013.
OCO-2 joins the A-Train in July 2014.
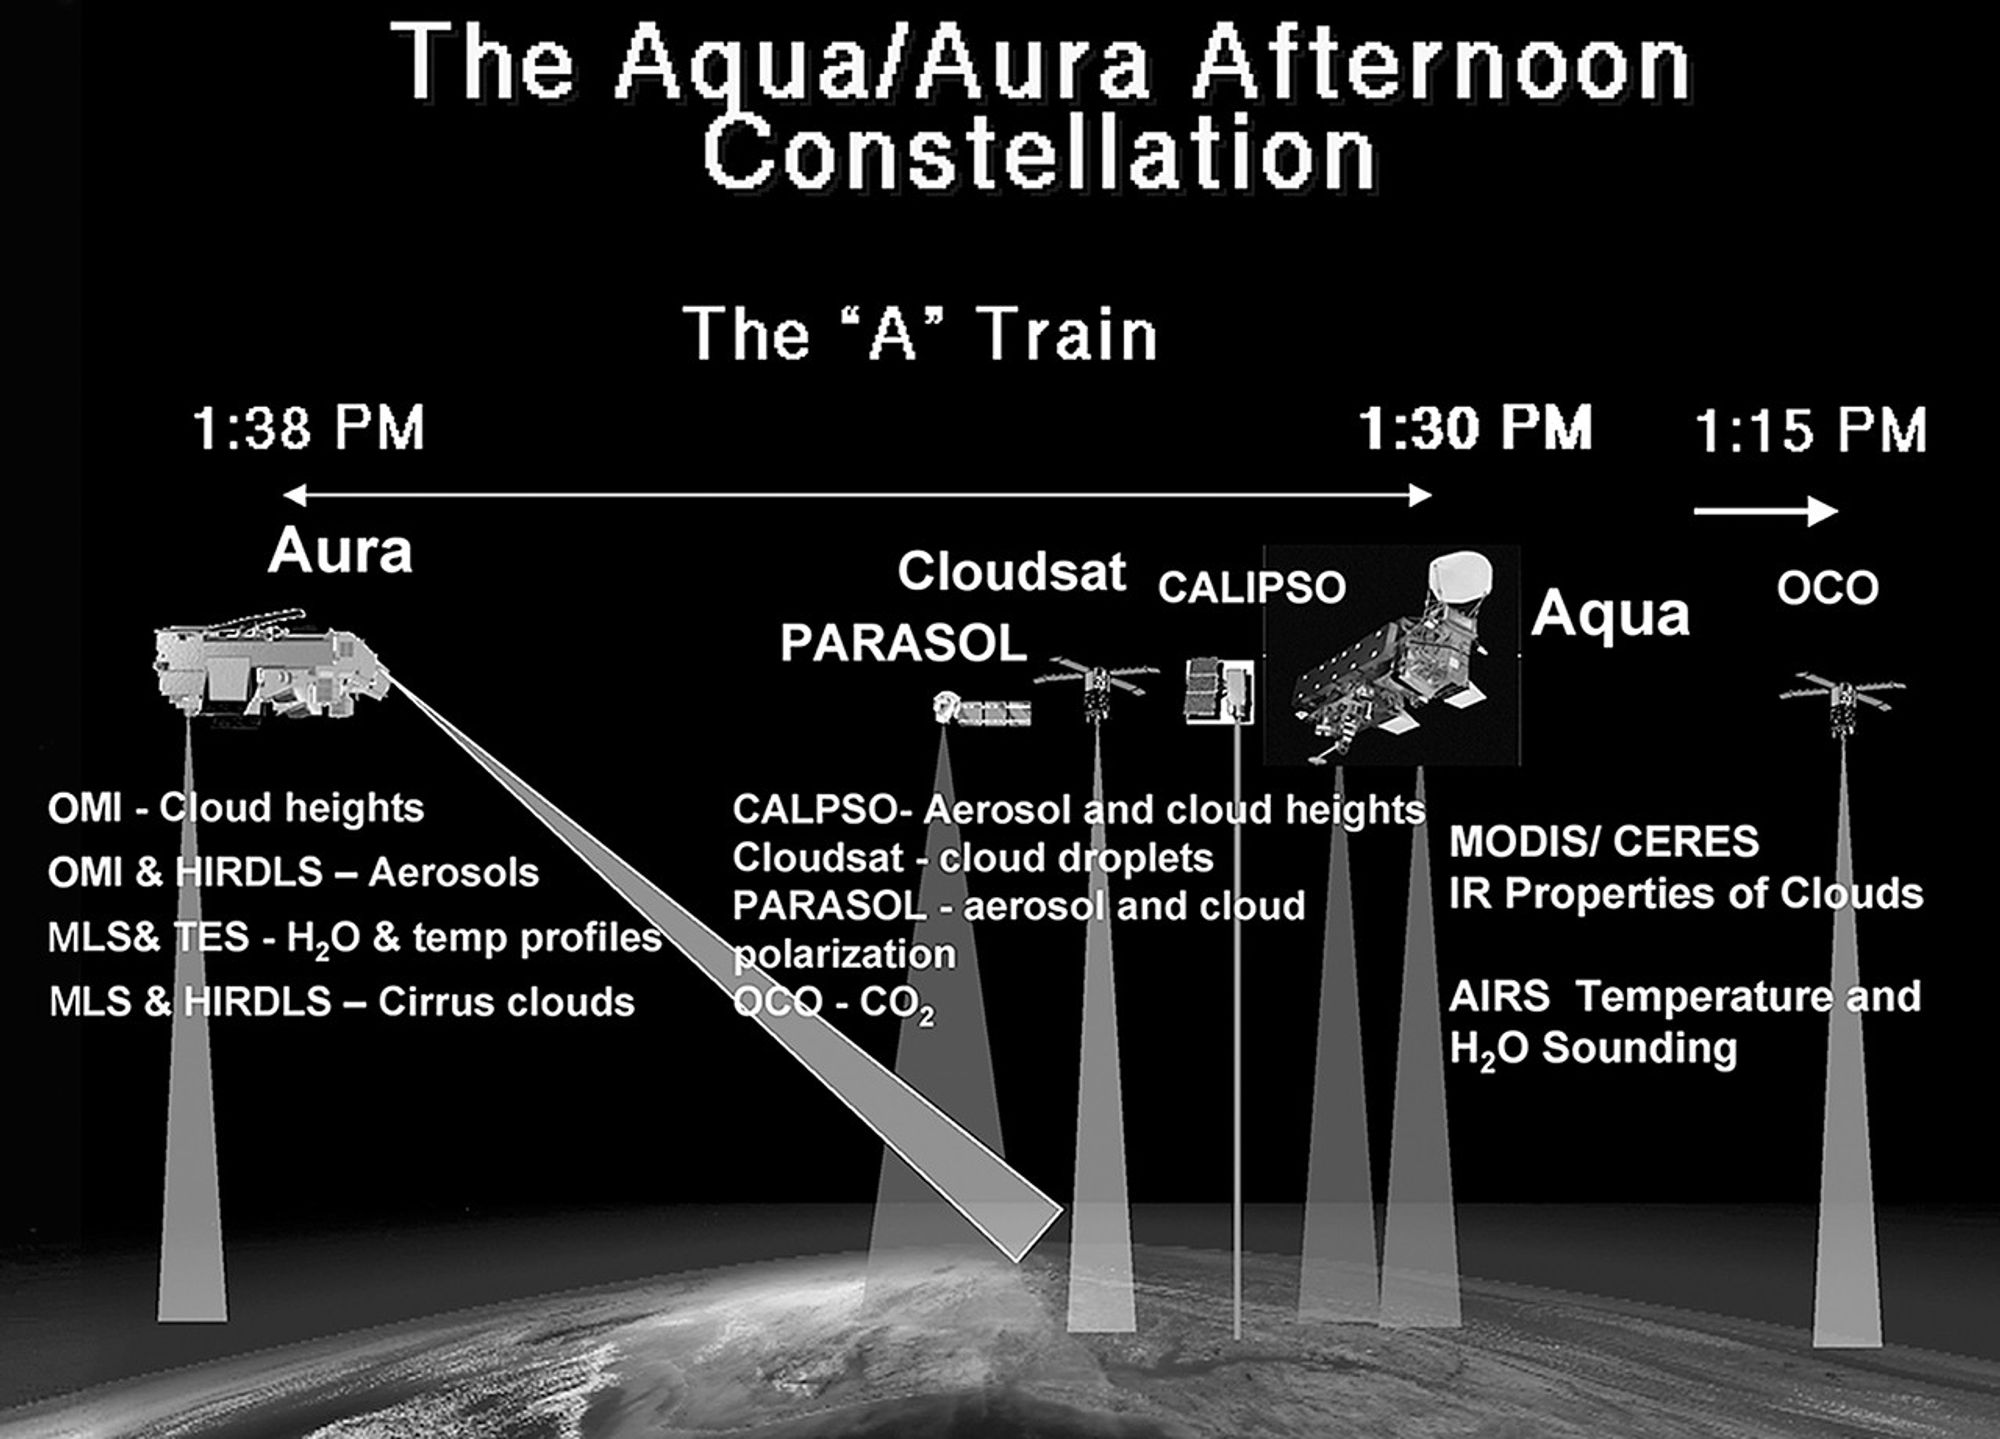
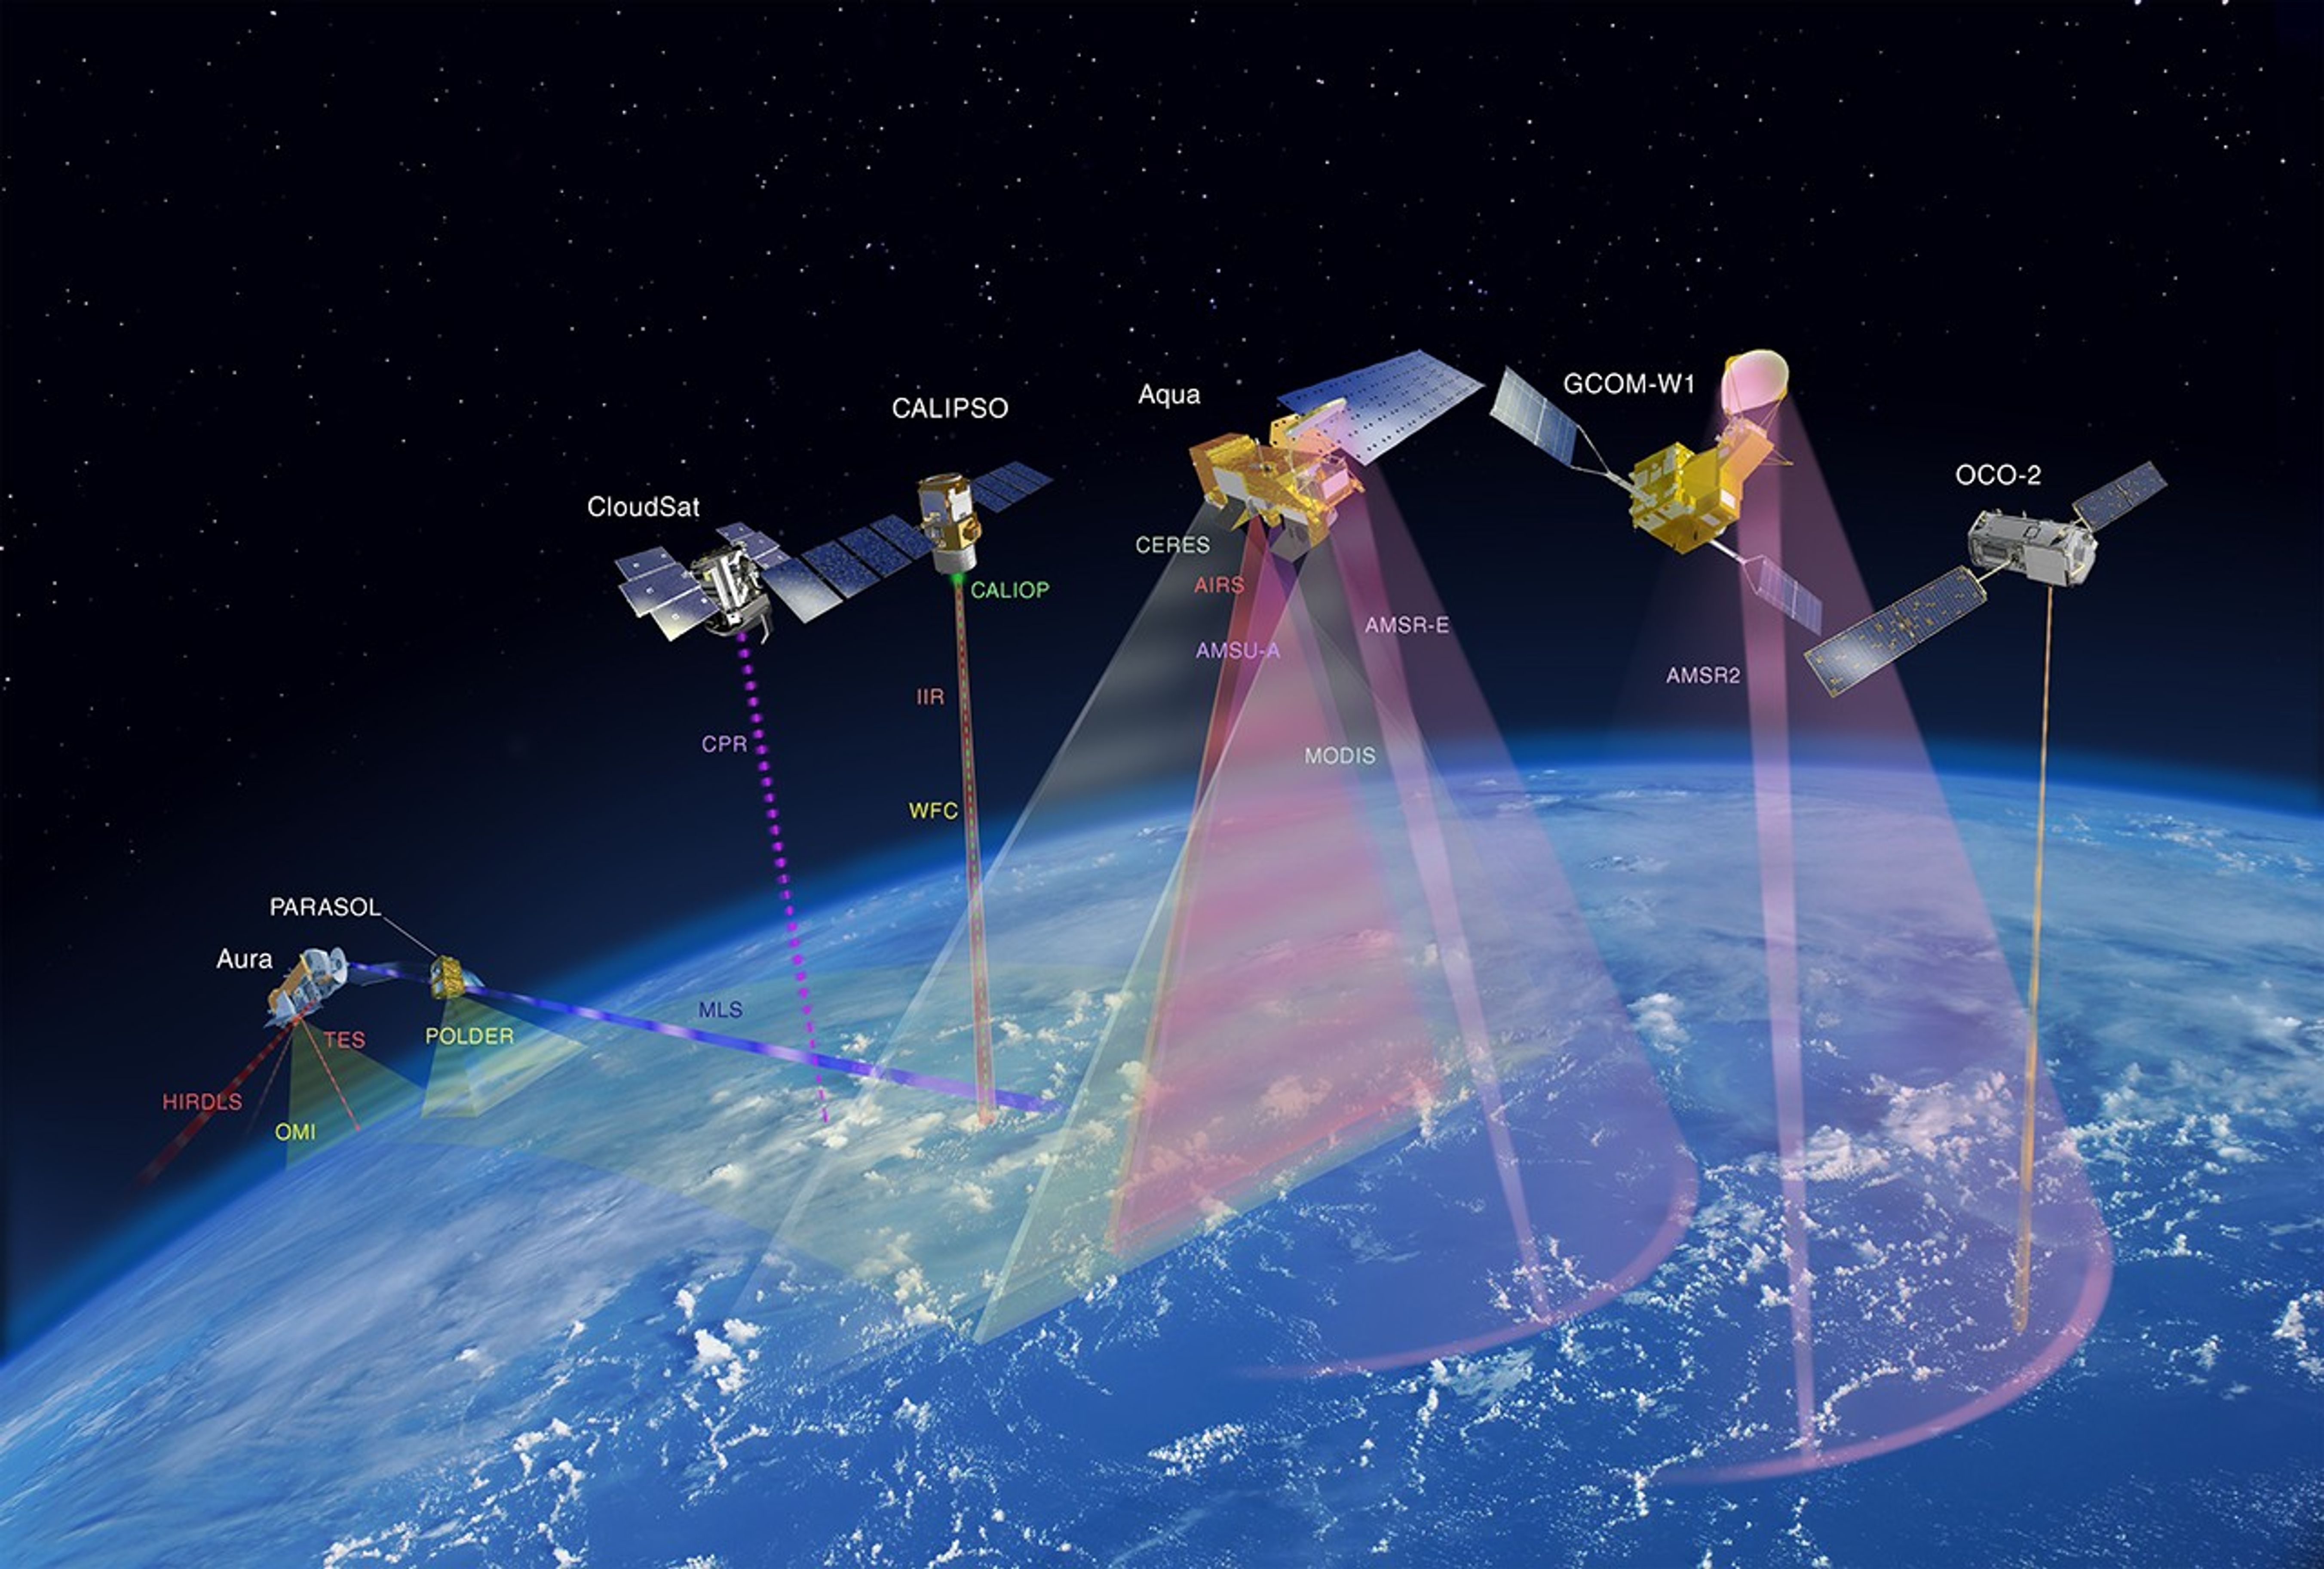
These images show the A-Train satellites as if looking down on the entire constellation from orbit. The satellites travel from south to north (bottom to top in this image). The colorful bars across each satellite illustrate the scanning swath of several instruments.
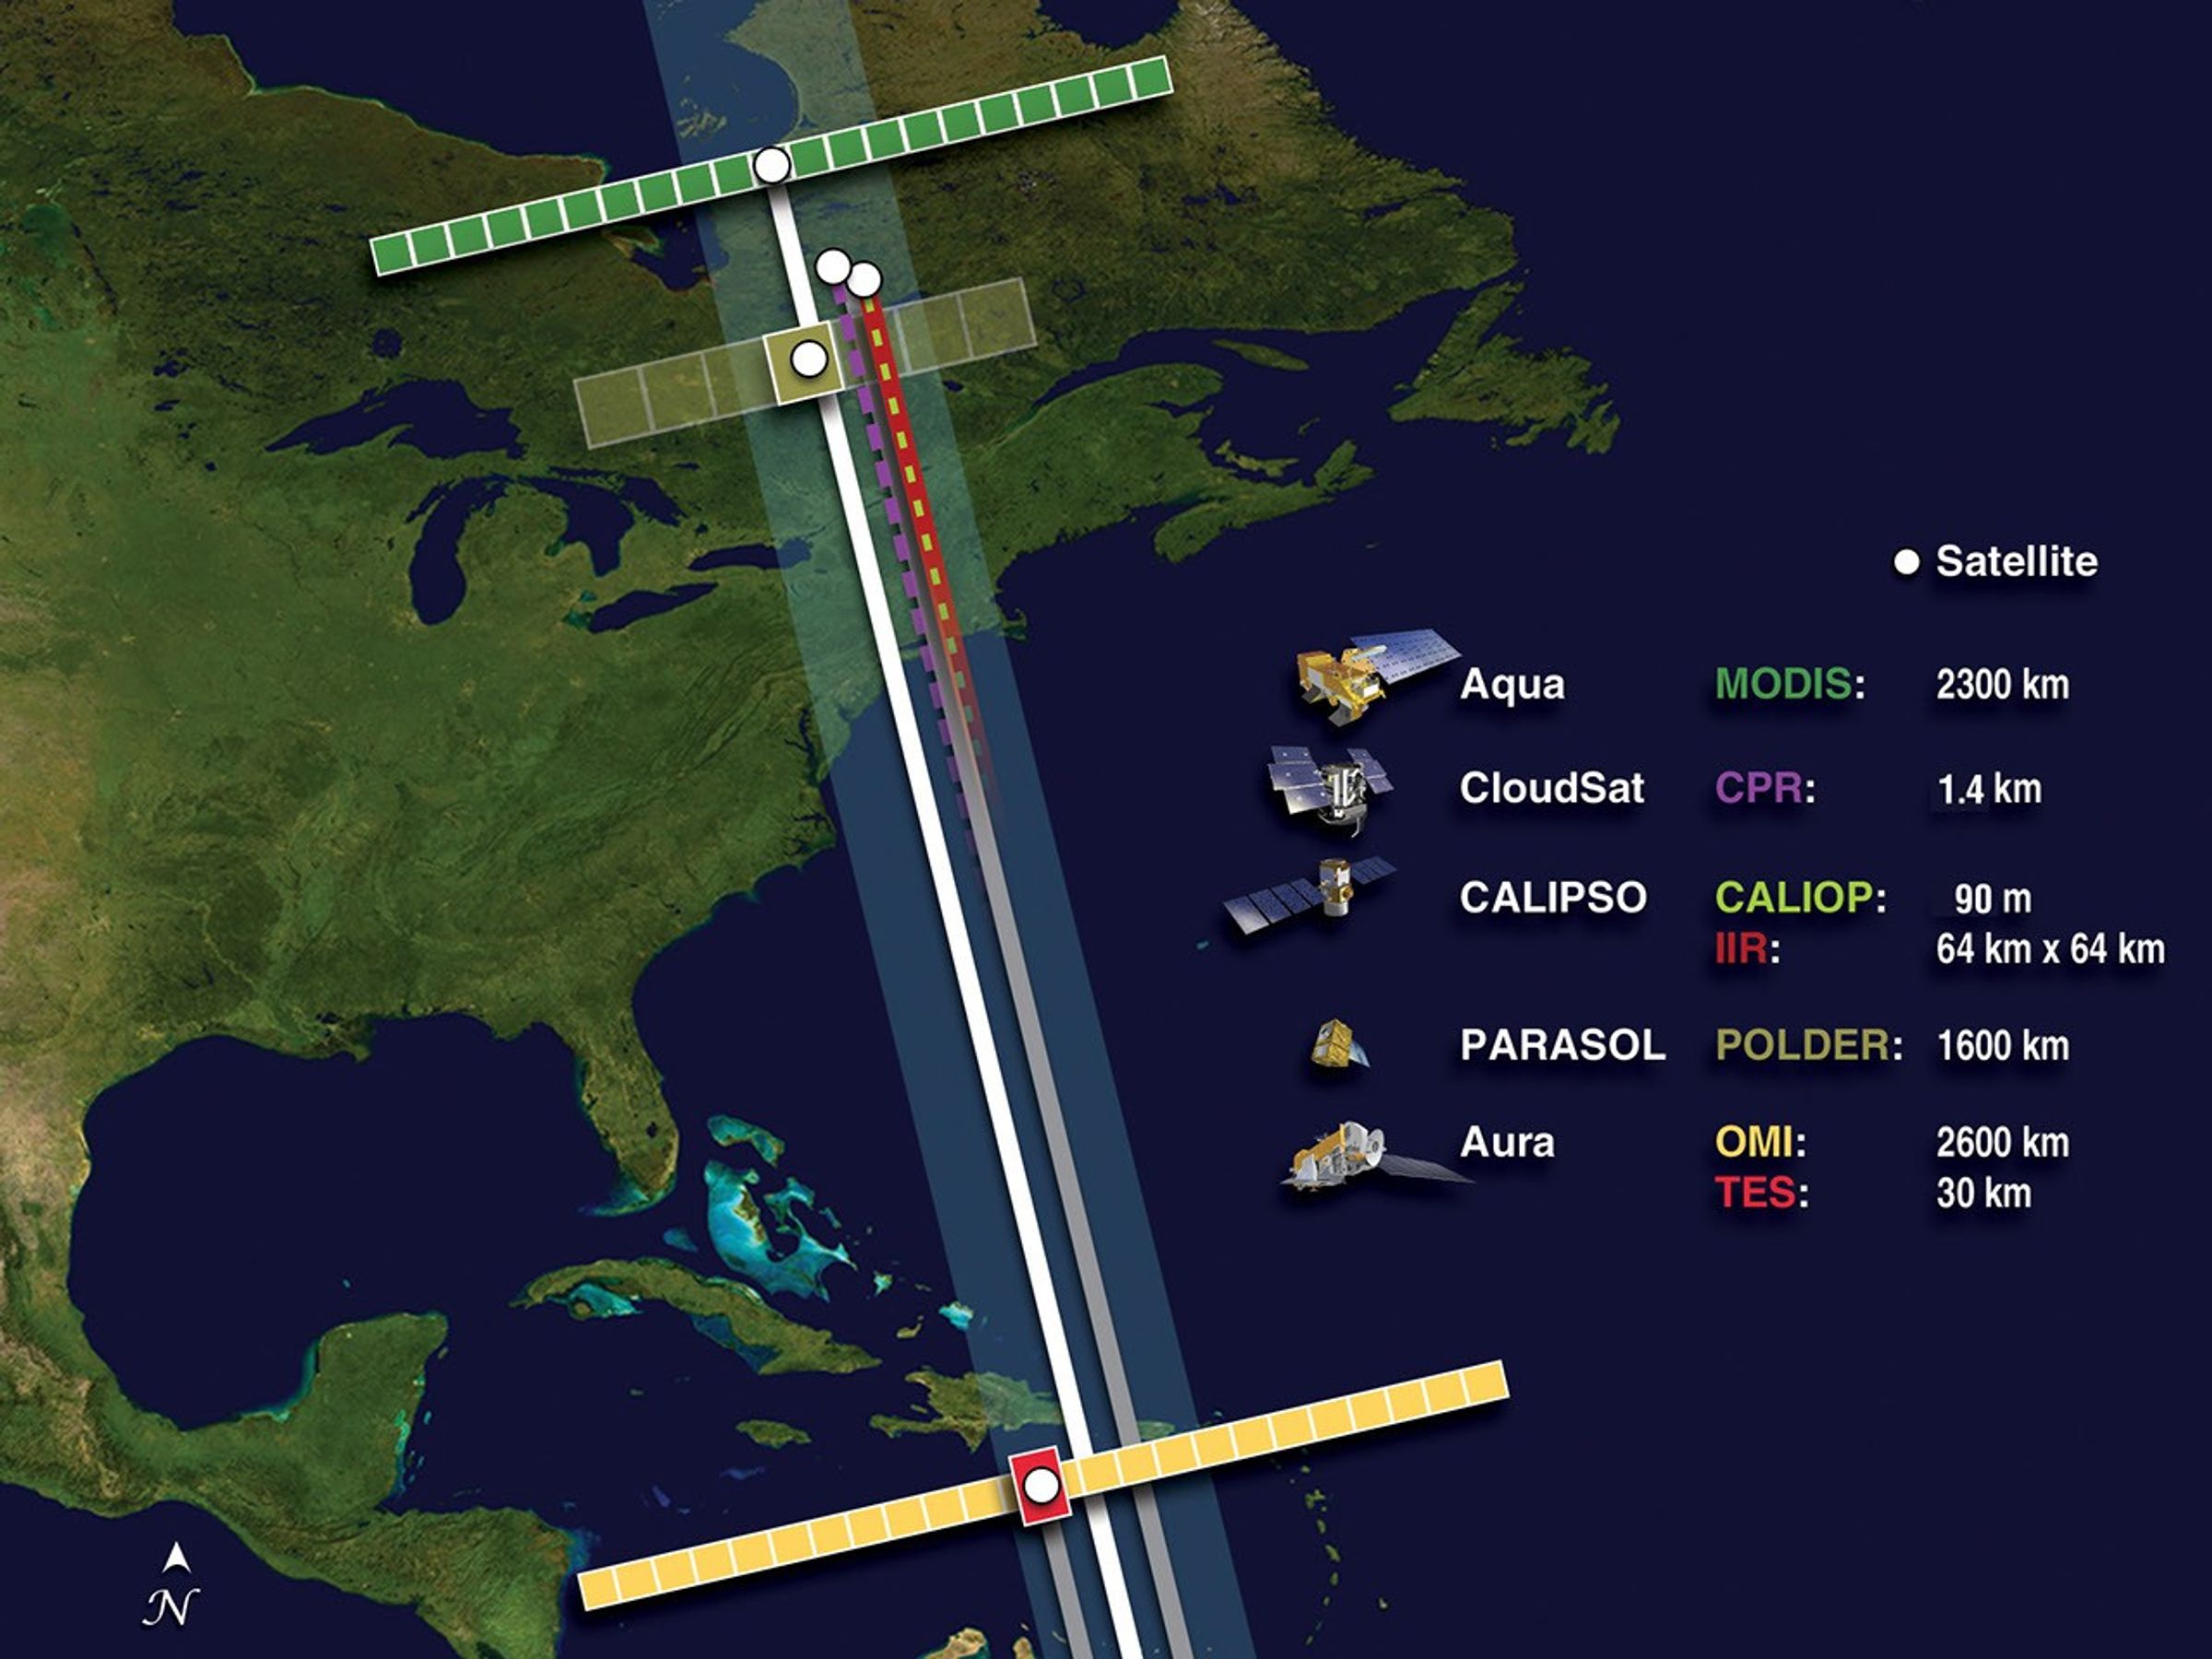
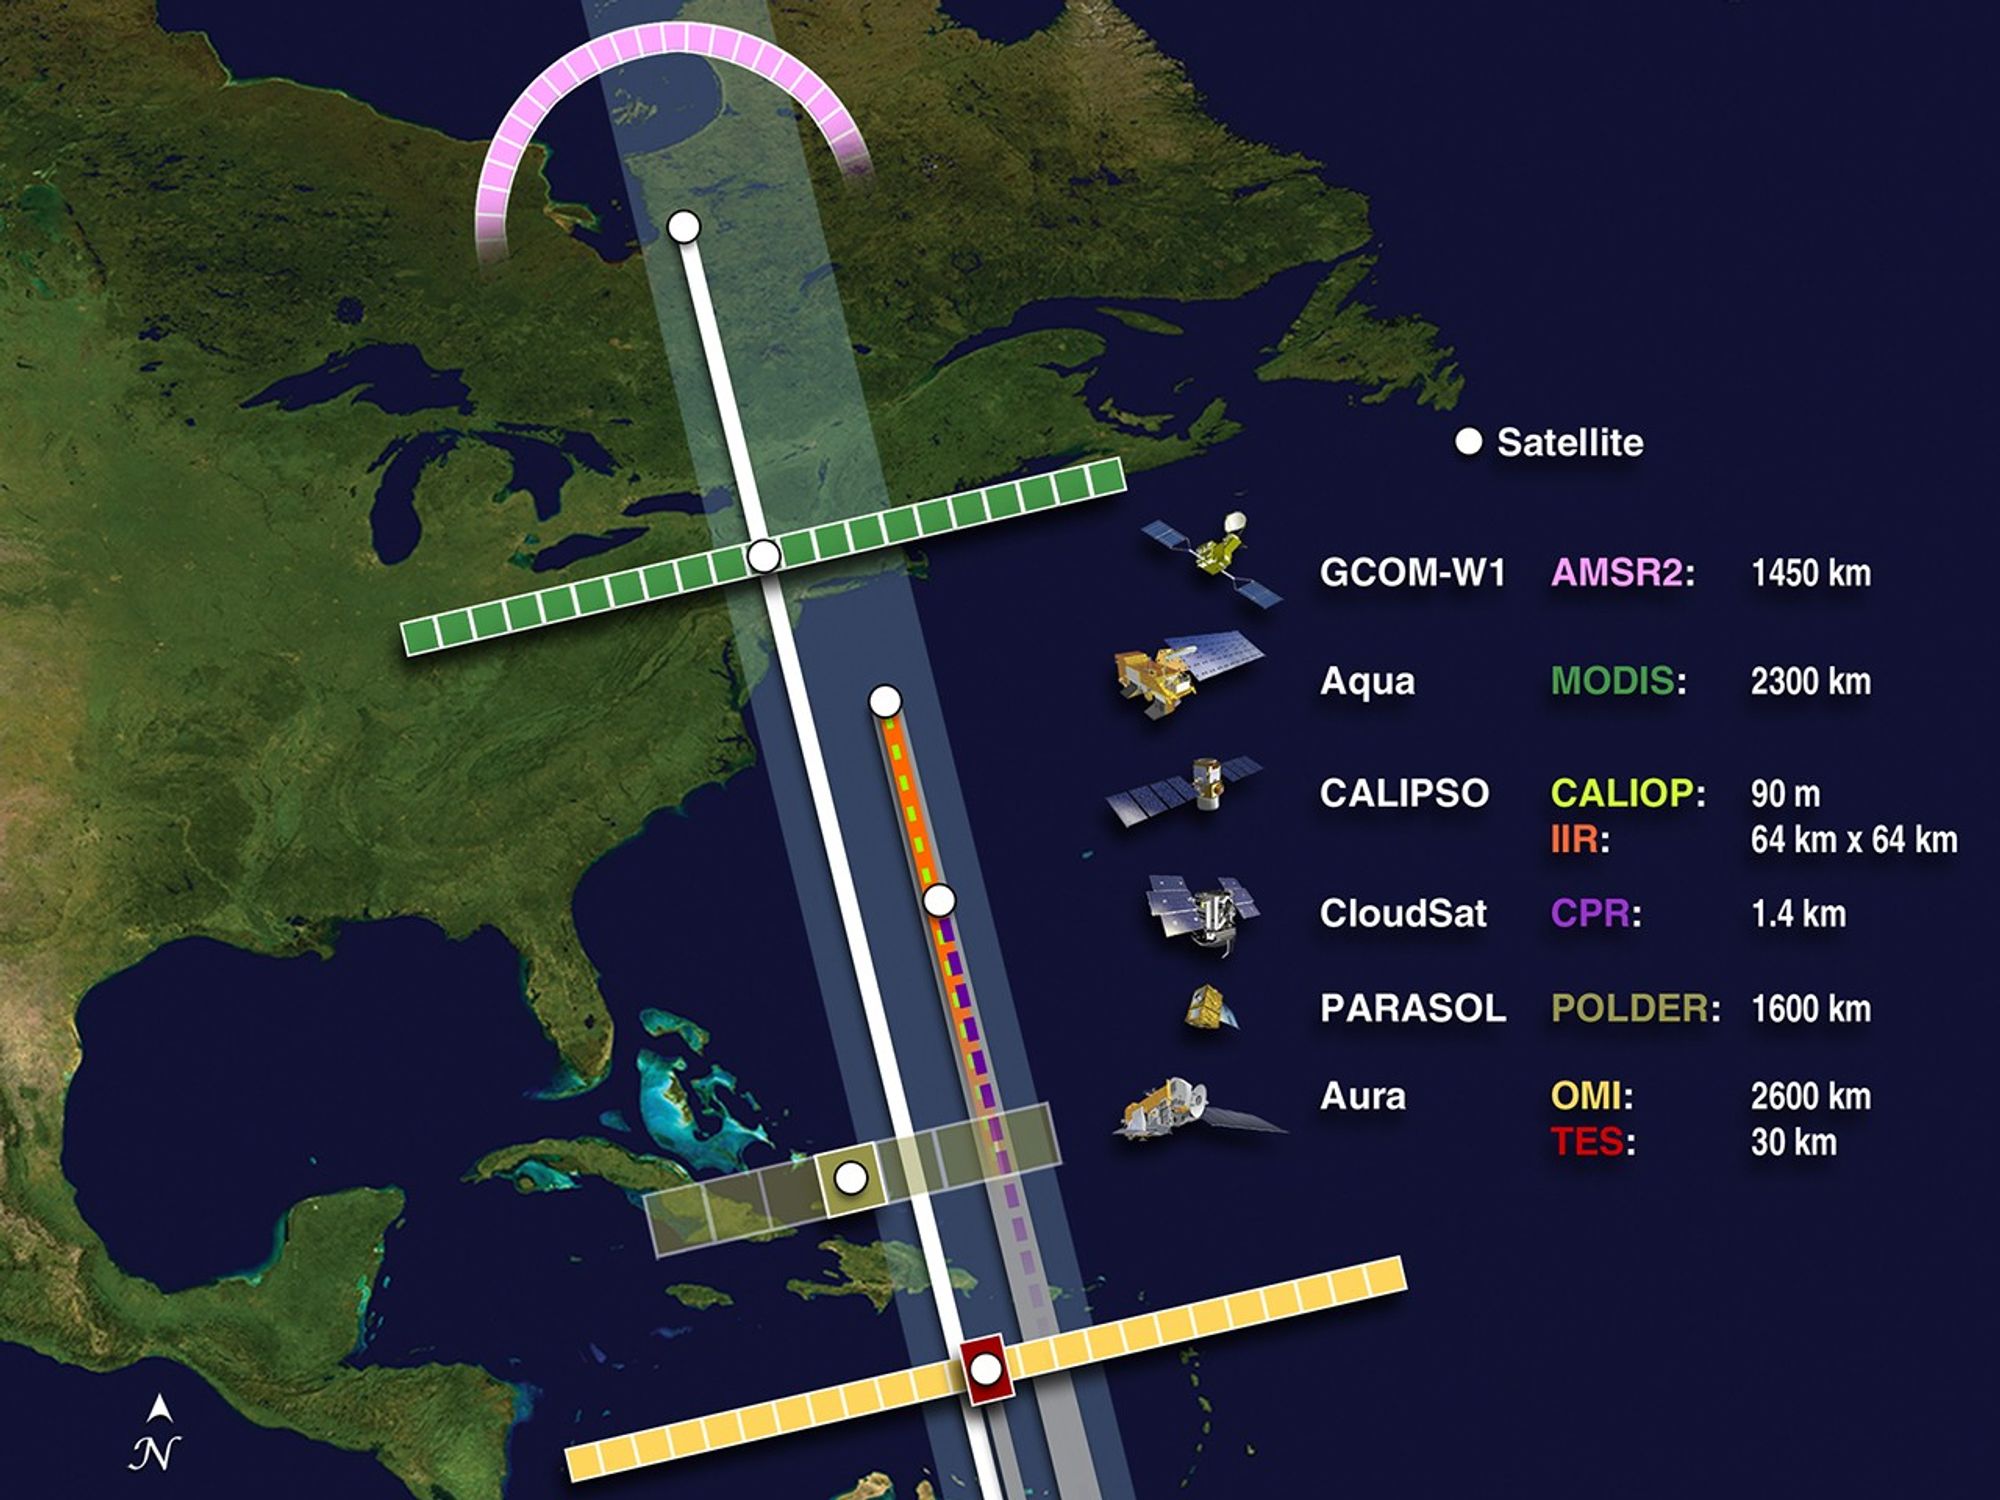
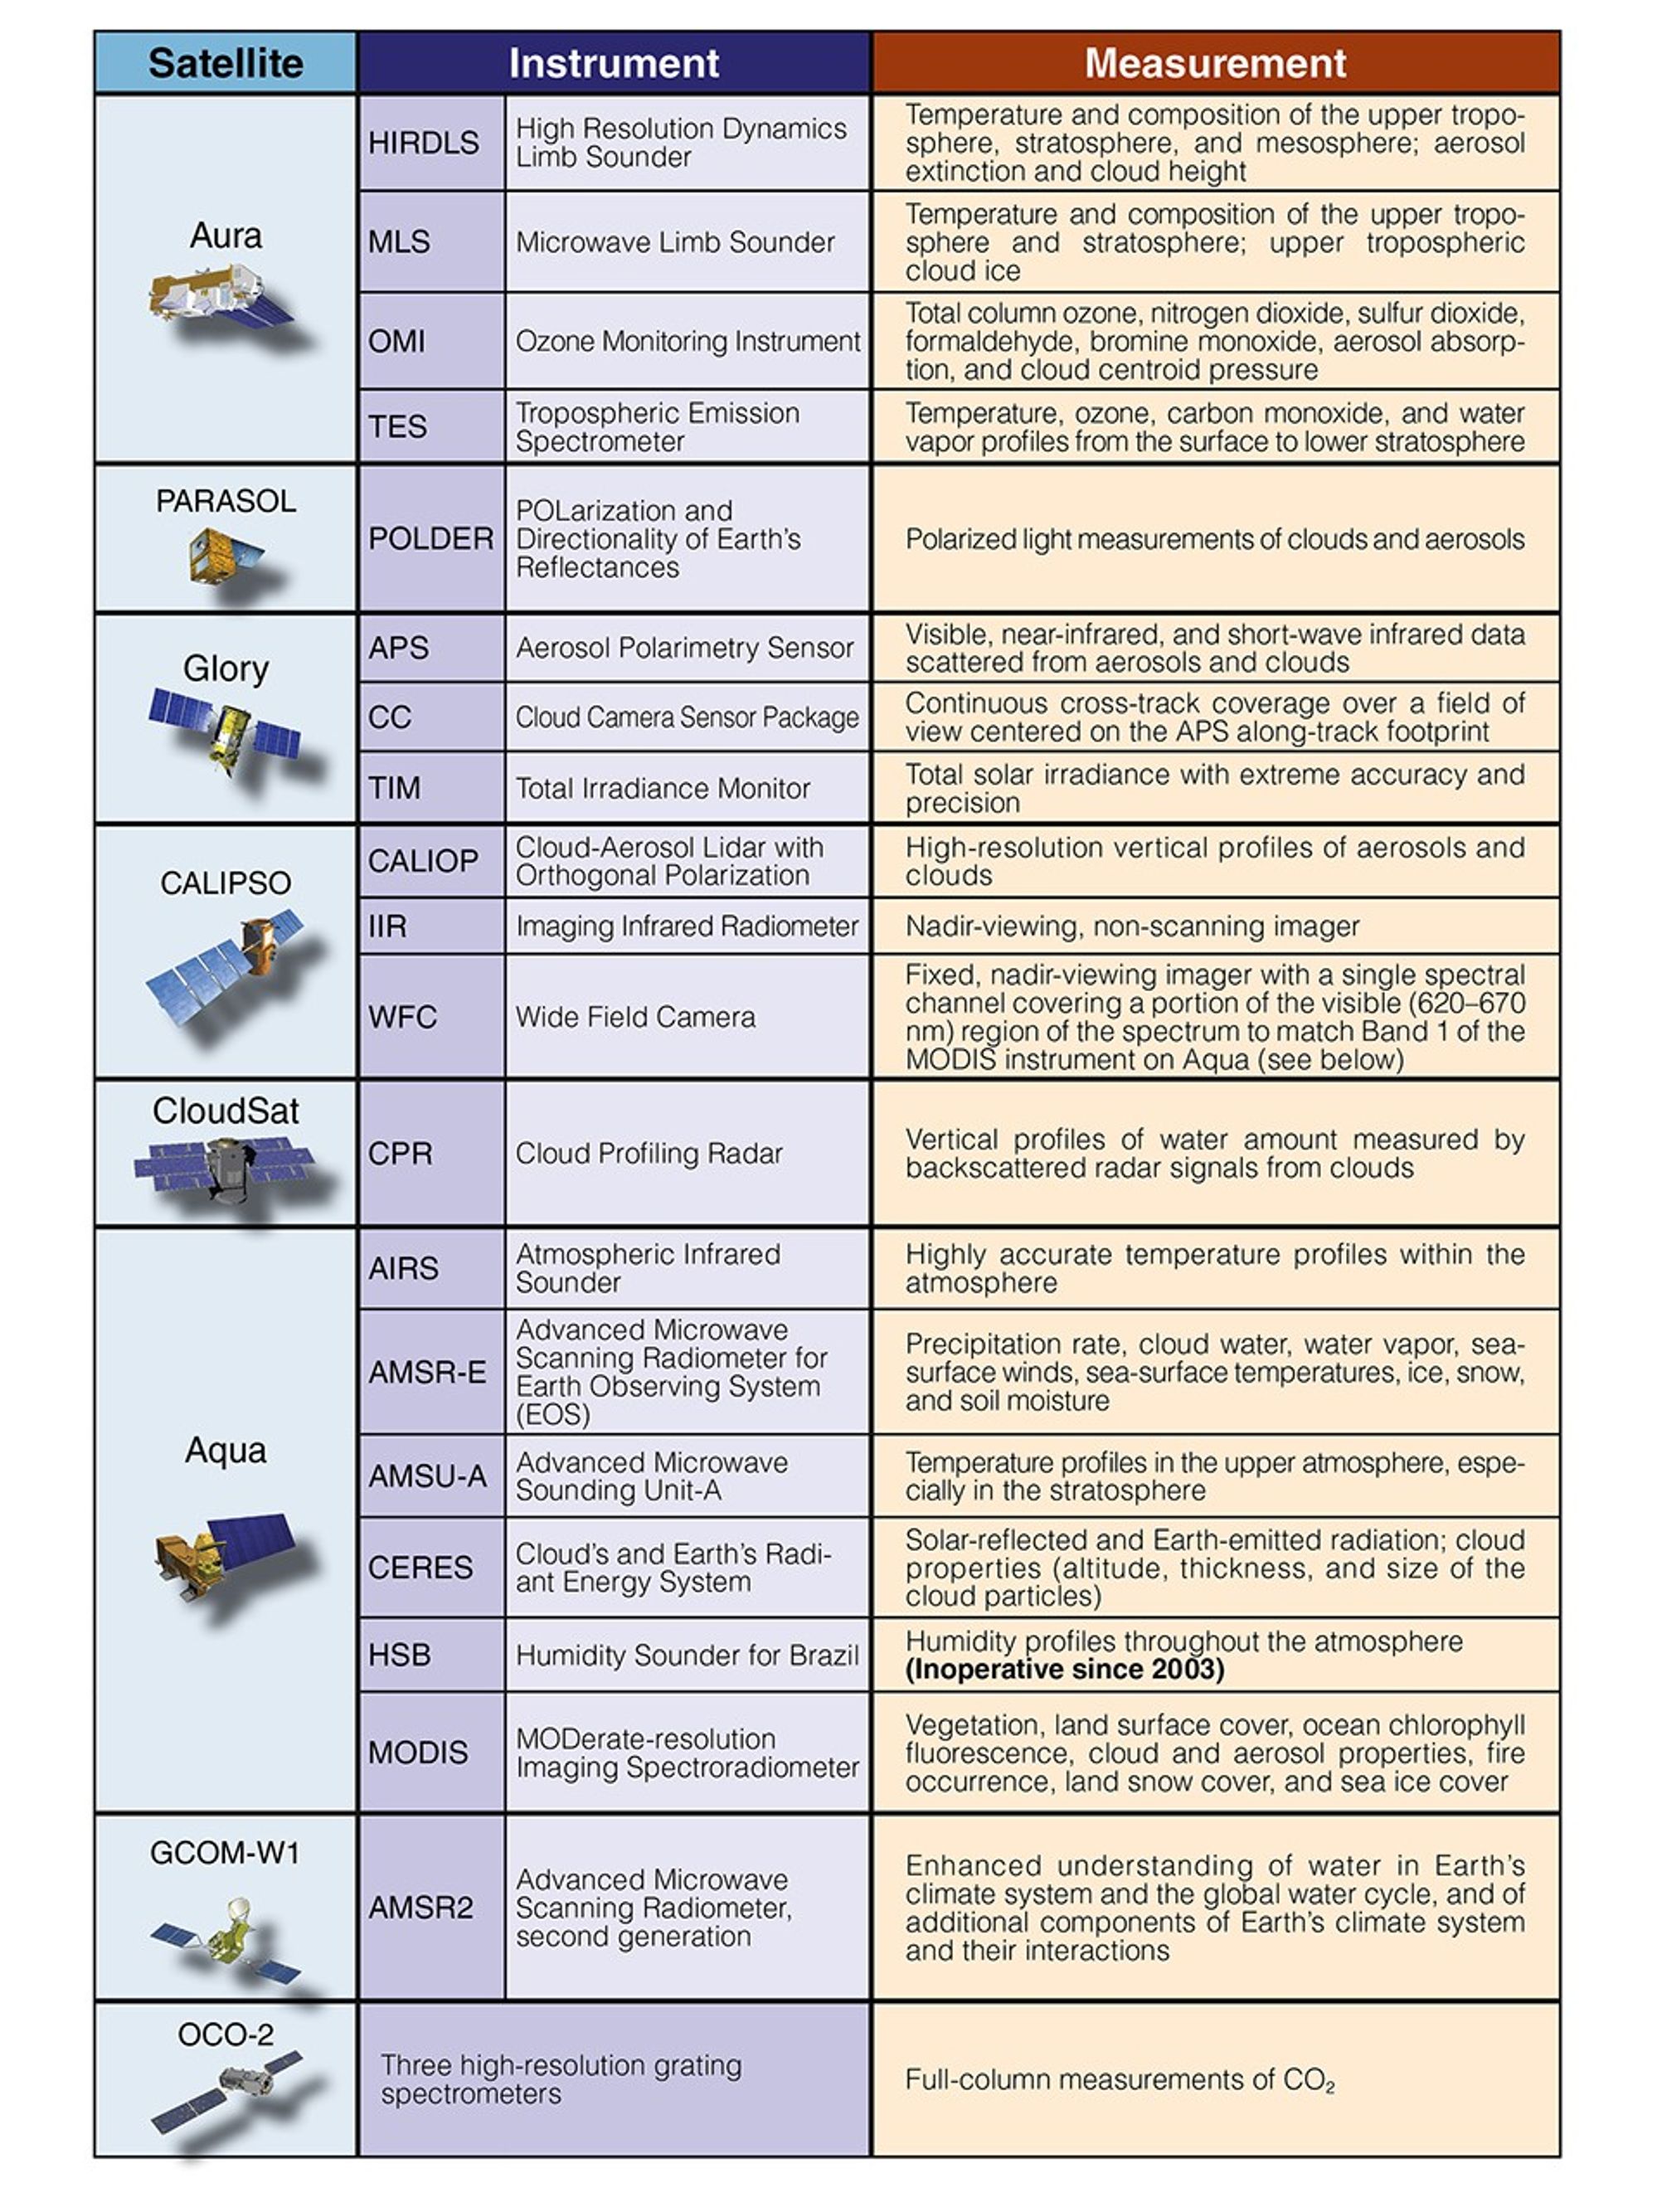
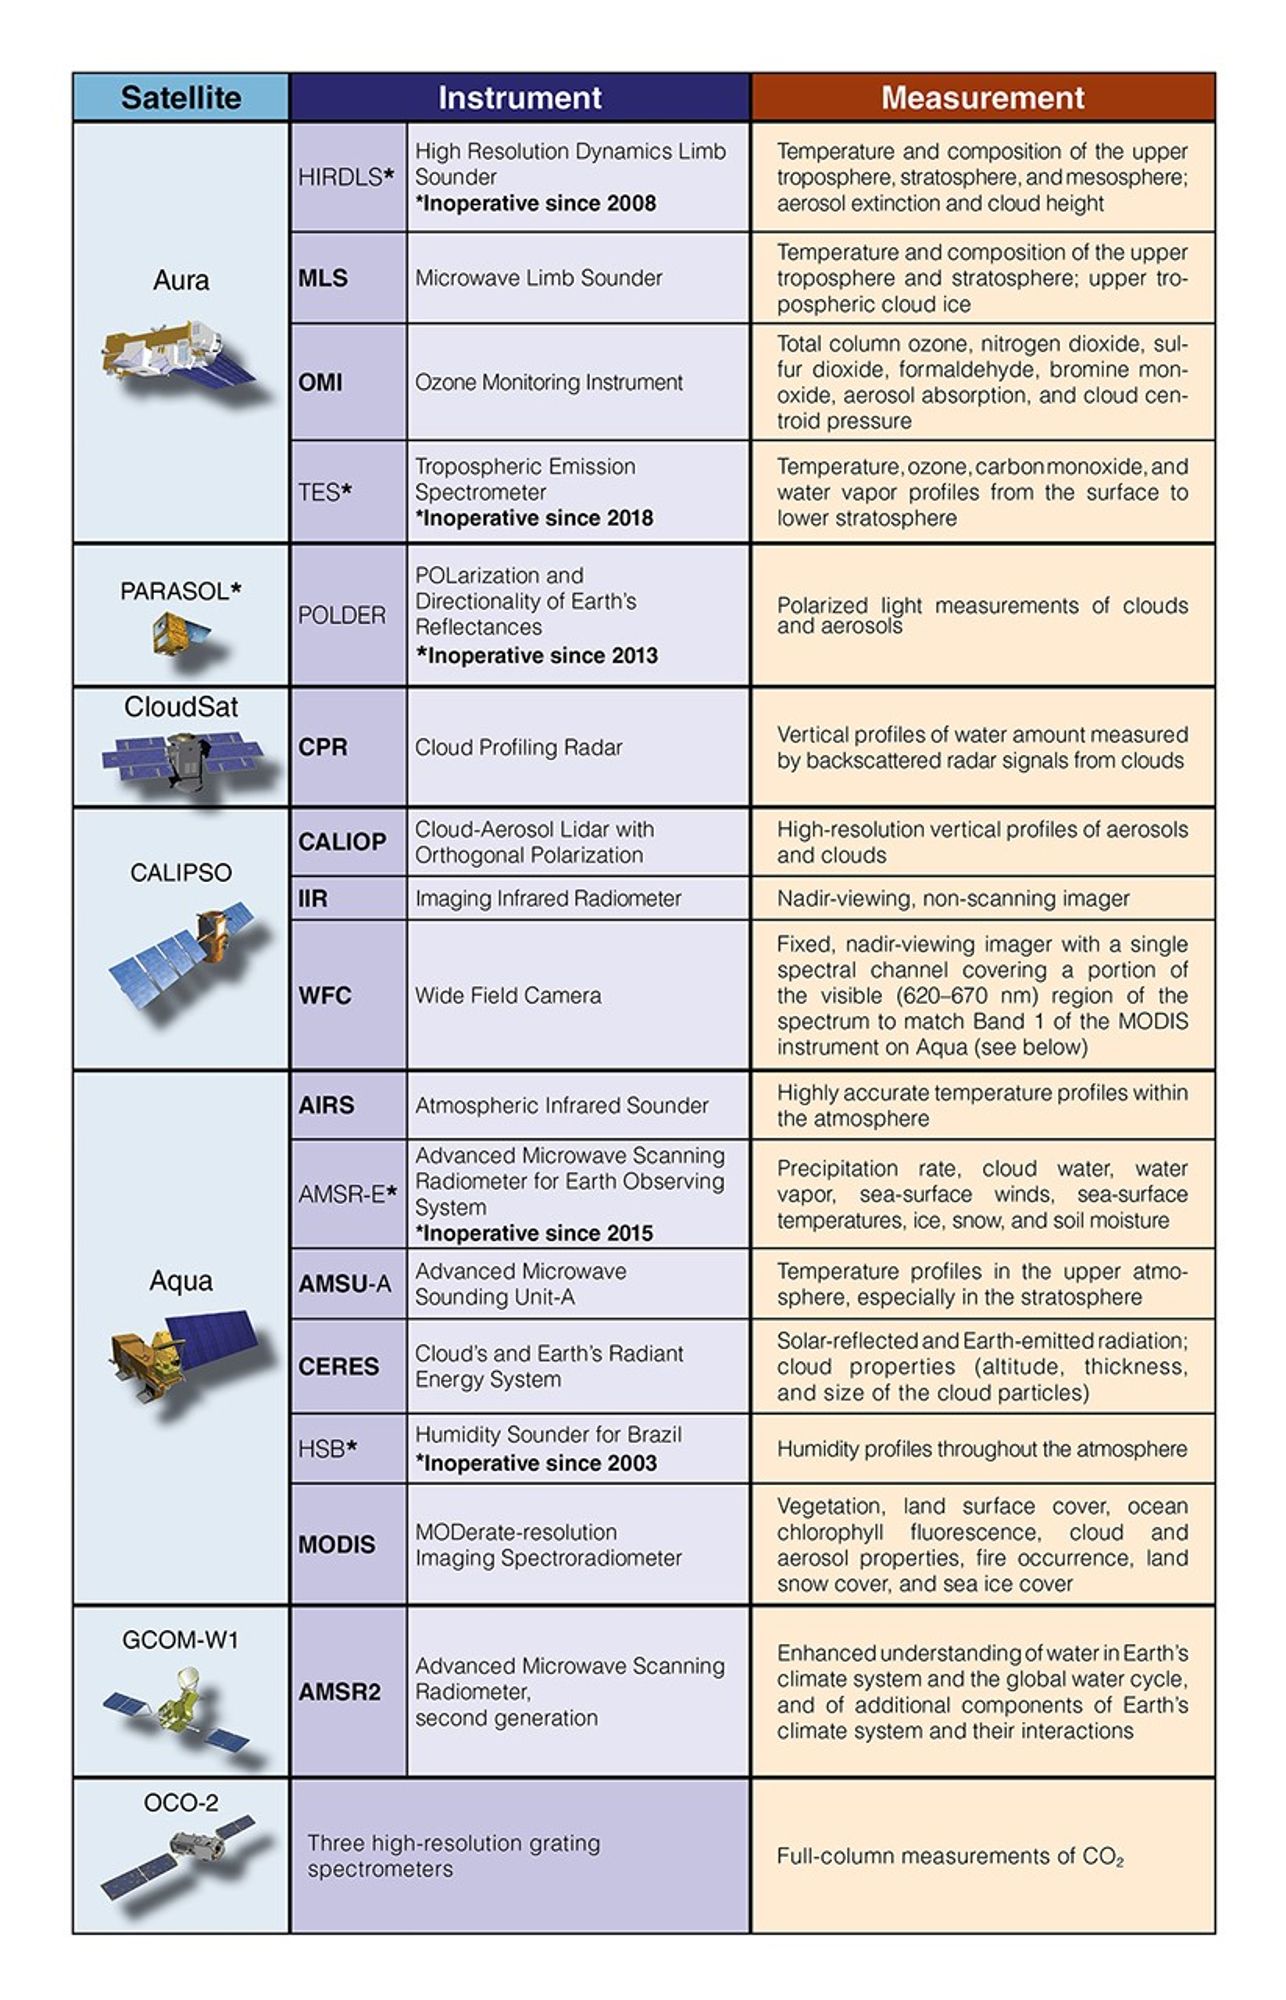
These tables provide an overview of each satellite‘s instruments.