Ultraviolet Imaging Spectrograph
How It Worked
The Ultraviolet Imaging Spectrograph created pictures by observing ultraviolet light. In ultraviolet wavelengths of light, gases that the human eye can’t see become observable. The spectrograph could determine what those gases are made of by splitting the light into its component wavelengths, or "colors," much like a rainbow.
How We Used It
Scientists used this instrument to study Saturn’s rings and atmosphere, along with features of the planet's many moons. The instrument could study the composition of atmospheres on the night-sides of the planet and its moon Titan, and also looked at how light from the Sun and stars passed through atmospheres and rings in the Saturn system. Light is altered when it passes through gas or dust, and those changes tell scientists about the density and composition of the material through which the light passed.
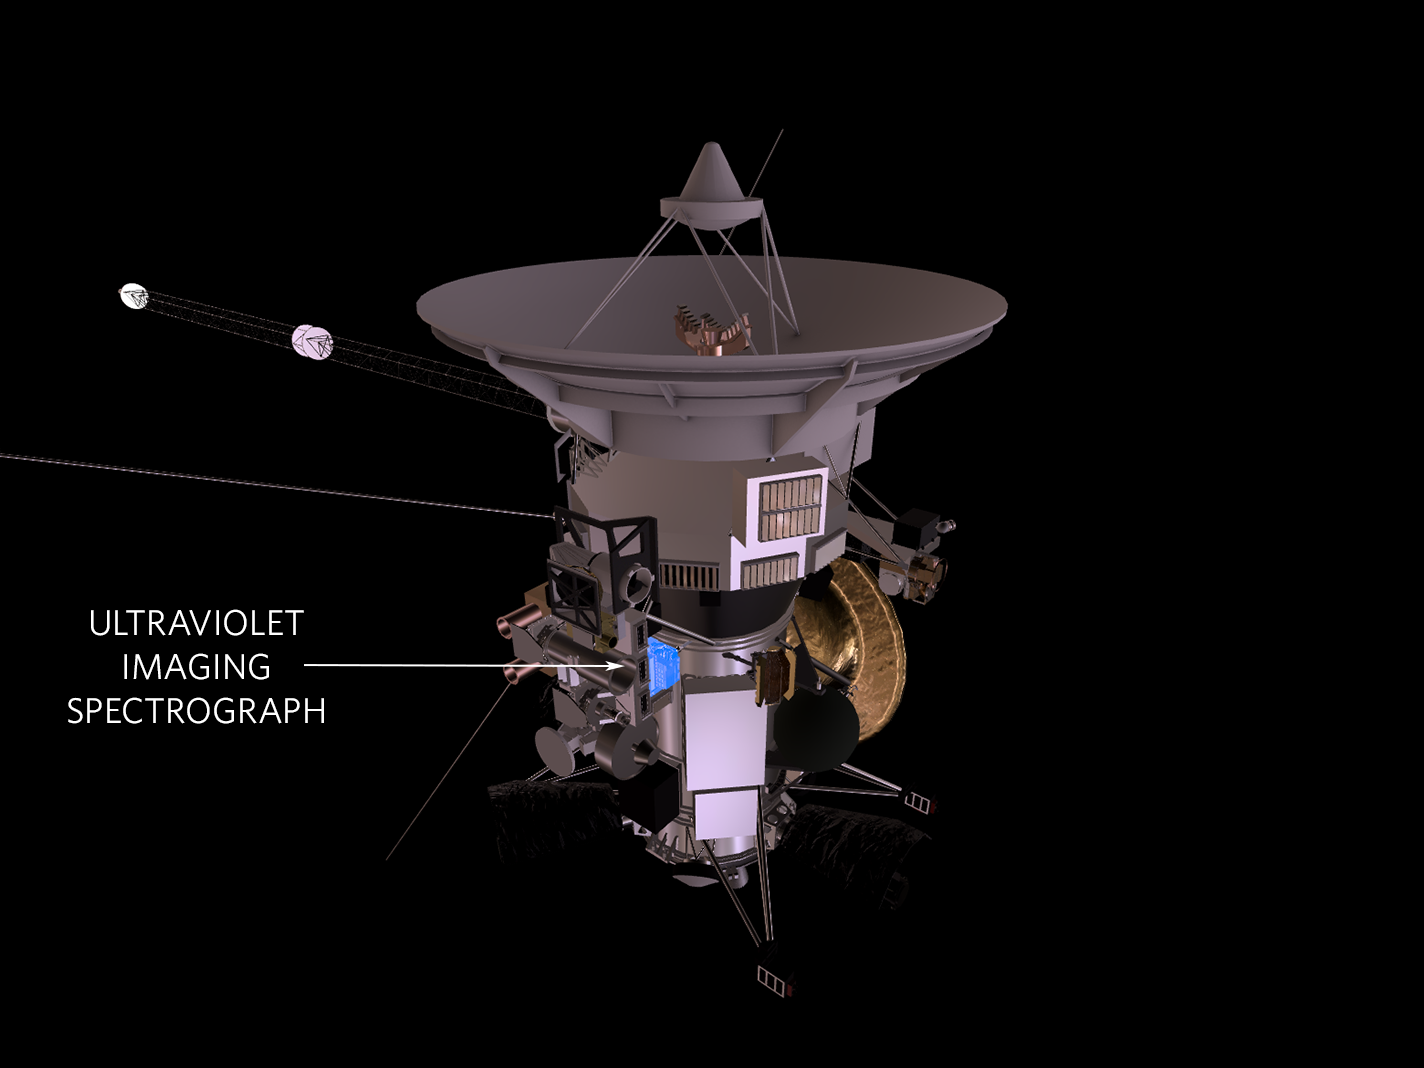
The Ultraviolet Imaging Spectrograph (known to the science team as UVIS) was a box of four telescopes that could see ultraviolet light, which is invisible to the human eye. On Earth, ultraviolet light causes sunburns, but with a space-based spectrograph, ultraviolet light shows researchers what no other type of light can show.
The cool thing about UVIS is that we can see things that are invisible to other instruments.- Amanda Hendrix, UVIS team member
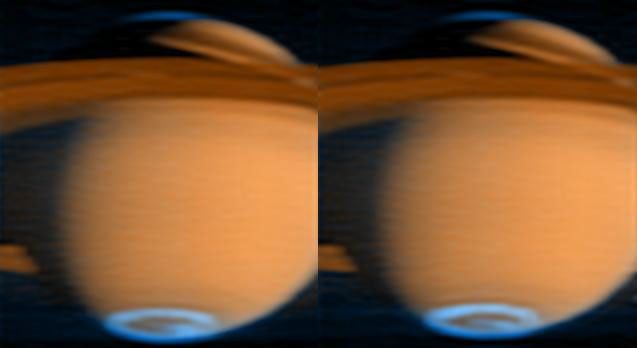
"The cool thing about UVIS is that we can see things that are invisible to other instruments," said Amanda Hendrix, a planetary scientist at the Planetary Science Institute and a UVIS team member who analyzes icy satellite data. "For example, UVIS can 'see' gases in the Saturn system that aren't seen by Cassini’s visible-light camera. The instrument can also see the dark, night side of the moons of Saturn, which stand out against the sky because they are bright at ultraviolet wavelengths."
When the instrument collected ultraviolet light, the light contained patterns that scientists recognize as tell-tale signs of certain chemical elements and compounds. So from a million miles away, the spectrograph could tell what some materials were made of.
The science team used the instrument to study the composition of Titan’s upper atmosphere, and helped determine that the plume of material erupting near Enceladus’ south pole is made largely of water. Elsewhere in the Saturn system, the instrument observed acetylene, ethane, hydrogen, methane and oxygen, among other materials.
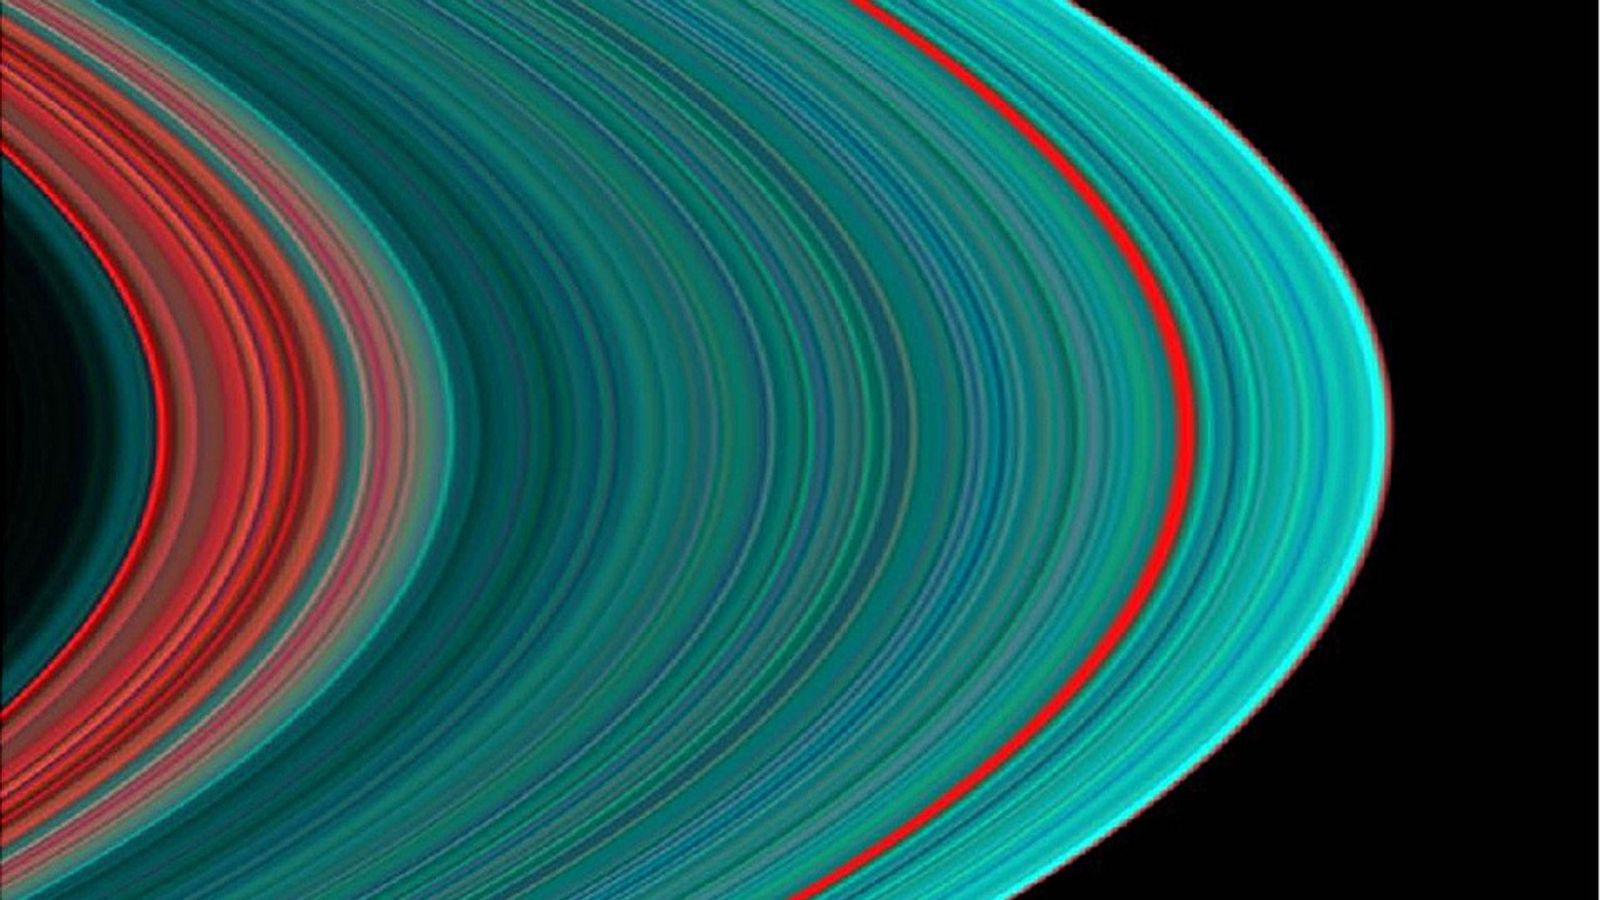
Though ultraviolet light is invisible to the human eye, scientists used measurements from Cassini's ultraviolet spectrograph to produce pictures we can see. By studying the images, scientists can watch certain gases come and go over time in a world’s upper atmosphere, or they can compare their images to data from Cassini’s other instruments to figure out the causes-and-effects of phenomena on Saturn’s moons or in the rings.
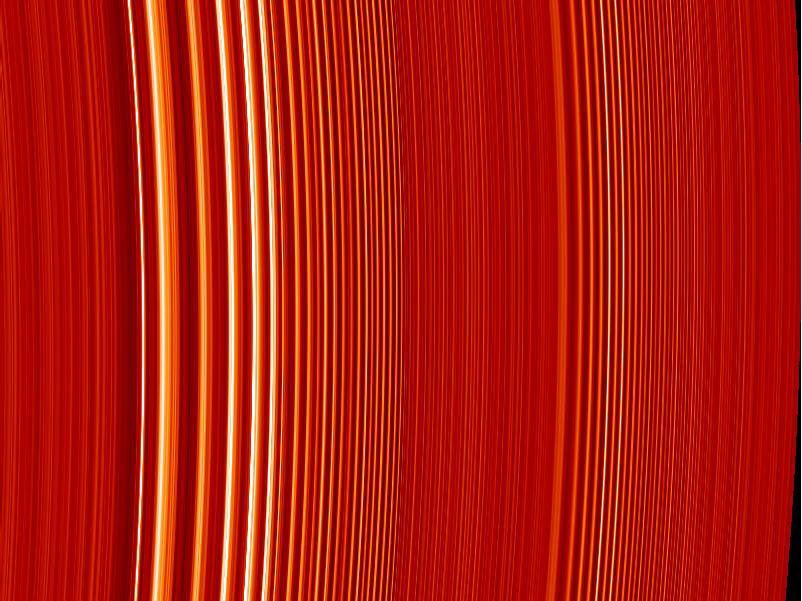
In addition to looking at the night side of Saturn or its moons, or at the sunlight reflected off of gases and ring particles, the UV spectrograph science team also observed features of the Saturn system by looking at them when they were backlit by the Sun or stars. Cassini was constantly moving, so it could lock onto a bright star and record how the star’s light changed as Saturn’s rings or an atmosphere intruded upon the instrument’s line of sight. The process is called an “occultation” because the object in the background (in this case a star) is “occulted” (hidden) by an object in the foreground such as the rings or a moon.
The occultation technique allowed the spectrograph team to map features of Saturn’s rings that were 10 times smaller than Cassini’s visible-light cameras can see.
At a Glance
Built by the Laboratory for Atmospheric and Space Physics (LASP) located in the Research Park of the University of Colorado in Boulder, UVIS was a Remote Sensing Instrument (think sight) that captured images of the ultraviolet light reflected off an object. Designed to measure ultraviolet light over wavelengths from 55.8 to 190 nanometers, this instrument was also a valuable tool to help determine the composition, distribution, aerosol particle content and temperatures of their atmospheres. UVIS included a two-channel, far- and extreme-ultraviolet imaging spectrograph that studies light over wavelengths from 55.8 to 190 nanometers.
- Mass (current best estimate) = 14.46 kg
- Peak Operating Power (current best estimate) = 11.83 W
- Peak Data Rate (current best estimate) = 32.096 kilobits/sec
- Dimensions (approximate) = 48 cm x 30 cm x 23 cm
Cassini Orbiter Instruments
They surveyed and sniffed, analyzed and scrutinized. They took stunning images in various visible spectra. Cassini's 12 science instruments were designed to carry out sophisticated scientific studies of Saturn, from collecting data in multiple regions of the electromagnetic spectrum, to studying dust particles, to characterizing Saturn's plasma environment and magnetosphere.
Optical Remote Sensing
Mounted on the remote sensing pallet, these instruments studied Saturn and its rings and moons in the electromagnetic spectrum.
- Composite Infrared Spectrometer (CIRS)
- Imaging Science Subsystem (ISS)
- Ultraviolet Imaging Spectrograph (UVIS)
- Visible and Infrared Mapping Spectrometer (VIMS)
Fields, Particles and Waves
These instruments studied the dust, plasma and magnetic fields around Saturn. While most didn't produce actual "pictures," the information they collected is critical to scientists' understanding of this rich environment.
- Cassini Plasma Spectrometer (CAPS)
- Cosmic Dust Analyzer (CDA)
- Ion and Neutral Mass Spectrometer (INMS)
- Magnetometer (MAG)
- Magnetospheric Imaging Instrument (MIMI)
- Radio and Plasma Wave Science (RPWS)
Microwave Remote Sensing
Using radio waves, these instruments mapped atmospheres, determined the mass of moons, collected data on ring particle size, and unveiled the surface of Titan.


