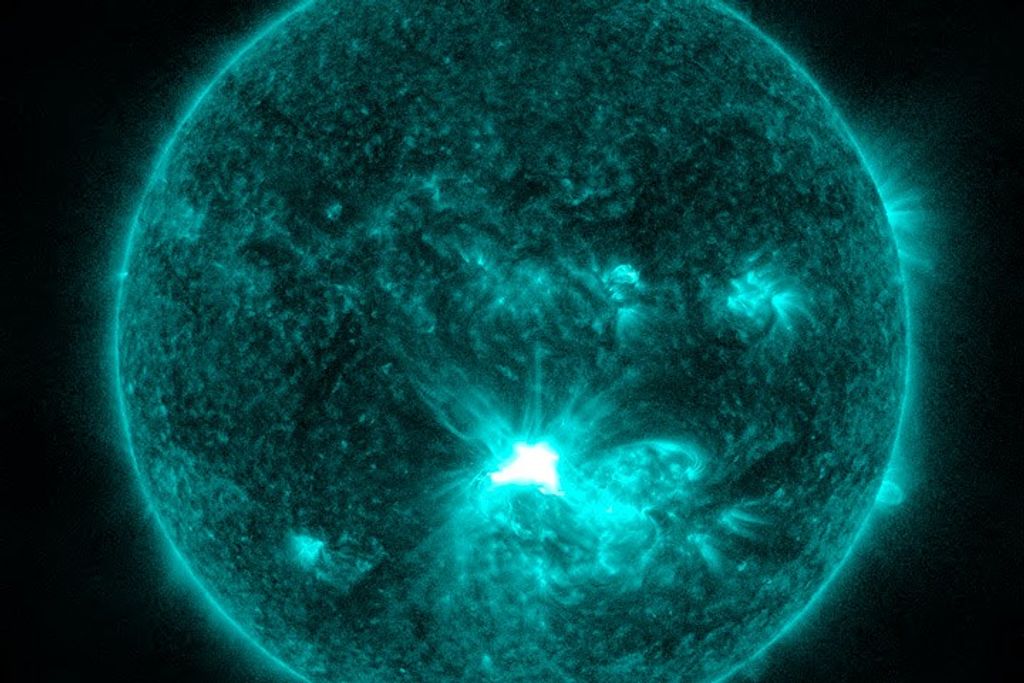
Scientists have devised a new method for mapping the spottiness of distant stars by using observations from NASA missions of orbiting planets crossing their stars’ faces. The model builds on a technique researchers have used for decades to study star spots.
By improving astronomers’ understanding of spotty stars, the new model — called StarryStarryProcess — can help discover more about planetary atmospheres and potential habitability using data from telescopes like NASA’s upcoming Pandora mission.
“Many of the models researchers use to analyze data from exoplanets, or worlds beyond our solar system, assume that stars are uniformly bright disks,” said Sabina Sagynbayeva, a graduate student at Stony Brook University in New York. “But we know just by looking at our own Sun that stars are more complicated than that. Modeling complexity can be difficult, but our approach gives astronomers an idea of how many spots a star might have, where they are located, and how bright or dark they are.”
A paper describing StarryStarryProcess, led by Sagynbayeva, published Monday, August 25, in The Astrophysical Journal.
NASA’s Goddard Space Flight Center
NASA’s TESS (Transiting Exoplanet Survey Satellite) and now-retired Kepler Space Telescope were designed to identify planets using transits, dips in stellar brightness caused when a planet passes in front of its star.
These measurements reveal how the star’s light varies with time during each transit, and astronomers can arrange them in a plot astronomers call a light curve. Typically, a transit light curve traces a smooth sweep down as the planet starts passing in front of the star’s face. It reaches a minimum brightness when the world is fully in front of the star and then rises smoothly as the planet exits and the transit ends.
By measuring the time between transits, scientists can determine how far the planet lies from its star and estimate its surface temperature. The amount of missing light from the star during a transit can reveal the planet’s size, which can hint at its composition.
Every now and then, though, a planet’s light curve appears more complicated, with smaller dips and peaks added to the main arc. Scientists think these represent dark surface features akin to sunspots seen on our own Sun — star spots.
The Sun’s total number of sunspots varies as it goes through its 11-year solar cycle. Scientists use them to determine and predict the progress of that cycle as well as outbreaks of solar activity that could affect us here on Earth.
Similarly, star spots are cool, dark, temporary patches on a stellar surface whose sizes and numbers change over time. Their variability impacts what astronomers can learn about transiting planets.
Scientists have previously analyzed transit light curves from exoplanets and their host stars to look at the smaller dips and peaks. This helps determine the host star’s properties, such as its overall level of spottiness, inclination angle of the planet’s orbit, the tilt of the star’s spin compared to our line of sight, and other factors. Sagynbayeva’s model uses light curves that include not only transit information, but also the rotation of the star itself to provide even more detailed information about these stellar properties.
“Knowing more about the star in turn helps us learn even more about the planet, like a feedback loop,” said co-author Brett Morris, a senior software engineer at the Space Telescope Science Institute in Baltimore. “For example, at cool enough temperatures, stars can have water vapor in their atmospheres. If we want to look for water in the atmospheres of planets around those stars — a key indicator of habitability — we better be very sure that we’re not confusing the two.”
To test their model, Sagynbayeva and her team looked at transits from a planet called TOI 3884 b, located around 141 light-years away in the northern constellation Virgo.
Discovered by TESS in 2022, astronomers think the planet is a gas giant about five times bigger than Earth and 32 times its mass.
The StarryStarryProcess analysis suggests that the planet’s cool, dim star — called TOI 3384 — has concentrations of spots at its north pole, which also tips toward Earth so that the planet passes over the pole from our perspective.
Currently, the only available data sets that can be fit by Sagynbayeva’s model are in visible light, which excludes infrared observations taken by NASA’s James Webb Space Telescope. But NASA’s upcoming Pandora mission will benefit from tools like this one. Pandora, a small satellite developed through NASA’s Astrophysics Pioneers Program, will study the atmospheres of exoplanets and the activity of their host stars with long-duration multiwavelength observations. The Pandora mission’s goal is to determine how the properties of a star’s light differs when it passes through a planet’s atmosphere so scientists can better measure those atmospheres using Webb and other missions.
“The TESS satellite has discovered thousands of planets since it launched in 2018,” said Allison Youngblood, TESS project scientist at NASA’s Goddard Space Flight Center in Greenbelt, Maryland. “While Pandora will study about 20 worlds, it will advance our ability to pick out which signals come from stars and which come from planets. The more we understand the individual parts of a planetary system, the better we understand the whole — and our own.”
By Jeanette Kazmierczak
NASA’s Goddard Space Flight Center, Greenbelt, Md.
Media Contact:
Alise Fisher
202-358-2546
alise.m.fisher@nasa.gov
NASA Headquarters, Washington

