


Description
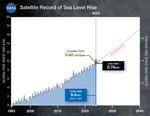
This graph shows the rise in global mean sea level from 1993 to 2023 based on data from a series of five international satellites. The solid red line indicates the trajectory of this increase, which has more than doubled over the three decades. The dotted red line projects future sea level rise.
The relatively large jump in sea level from 2022 to 2023, a rise of about 0.3 inches (0.76 centimeters), is due mostly to a warming climate and the development of a strong El Niño. The 2022-2023 rise is equivalent to draining a quarter of Lake Superior into the ocean over the course of a year.
This NASA-led analysis is based on a sea level data set featuring more than 30 years of satellite observations, starting with the U.S.-French TOPEX/Poseidon mission, which launched in 1992. The Sentinel-6 Michael Freilich mission, which launched in November 2020, is the latest in the series of satellites that have contributed to this sea level record.