


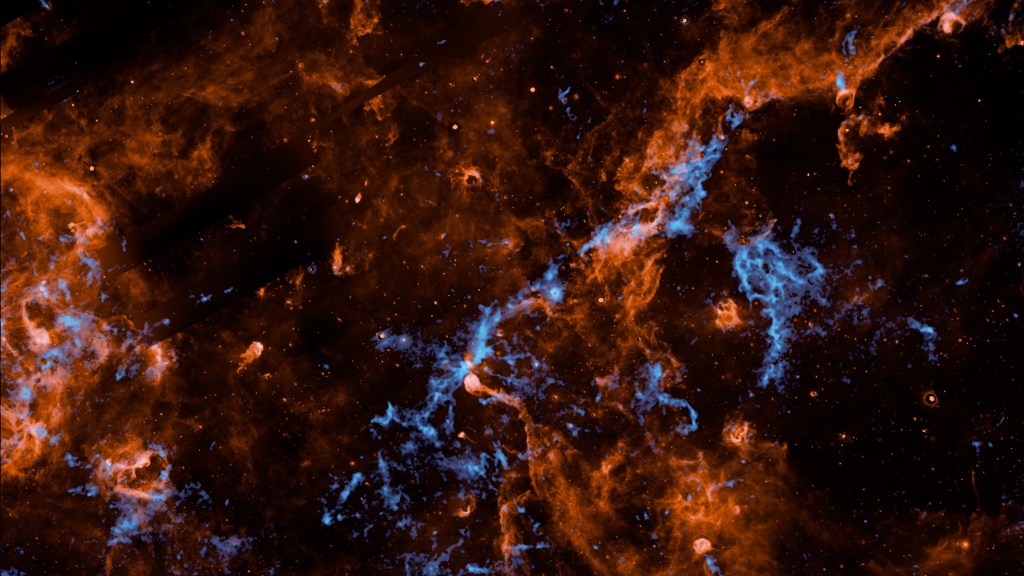


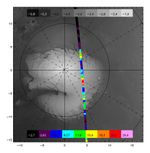
Description
This image is TES thermal data (Orbit 222) overlayed on the MOLA DEM. The color scale is TES T18-T25, which is a cold spot index. The grey scale is MOLA elevation in kilometers. Most cold spots can be attributed to surface spectral emissivity effects. Regions that are colored black-violet-blue have near unity emissivity and are coarse grained CO2. Regions that are yellow-red are fined grained CO2. The red-white spot located approximately 300W85N is our most likely candidate for a CO2 snow storm.