


Description
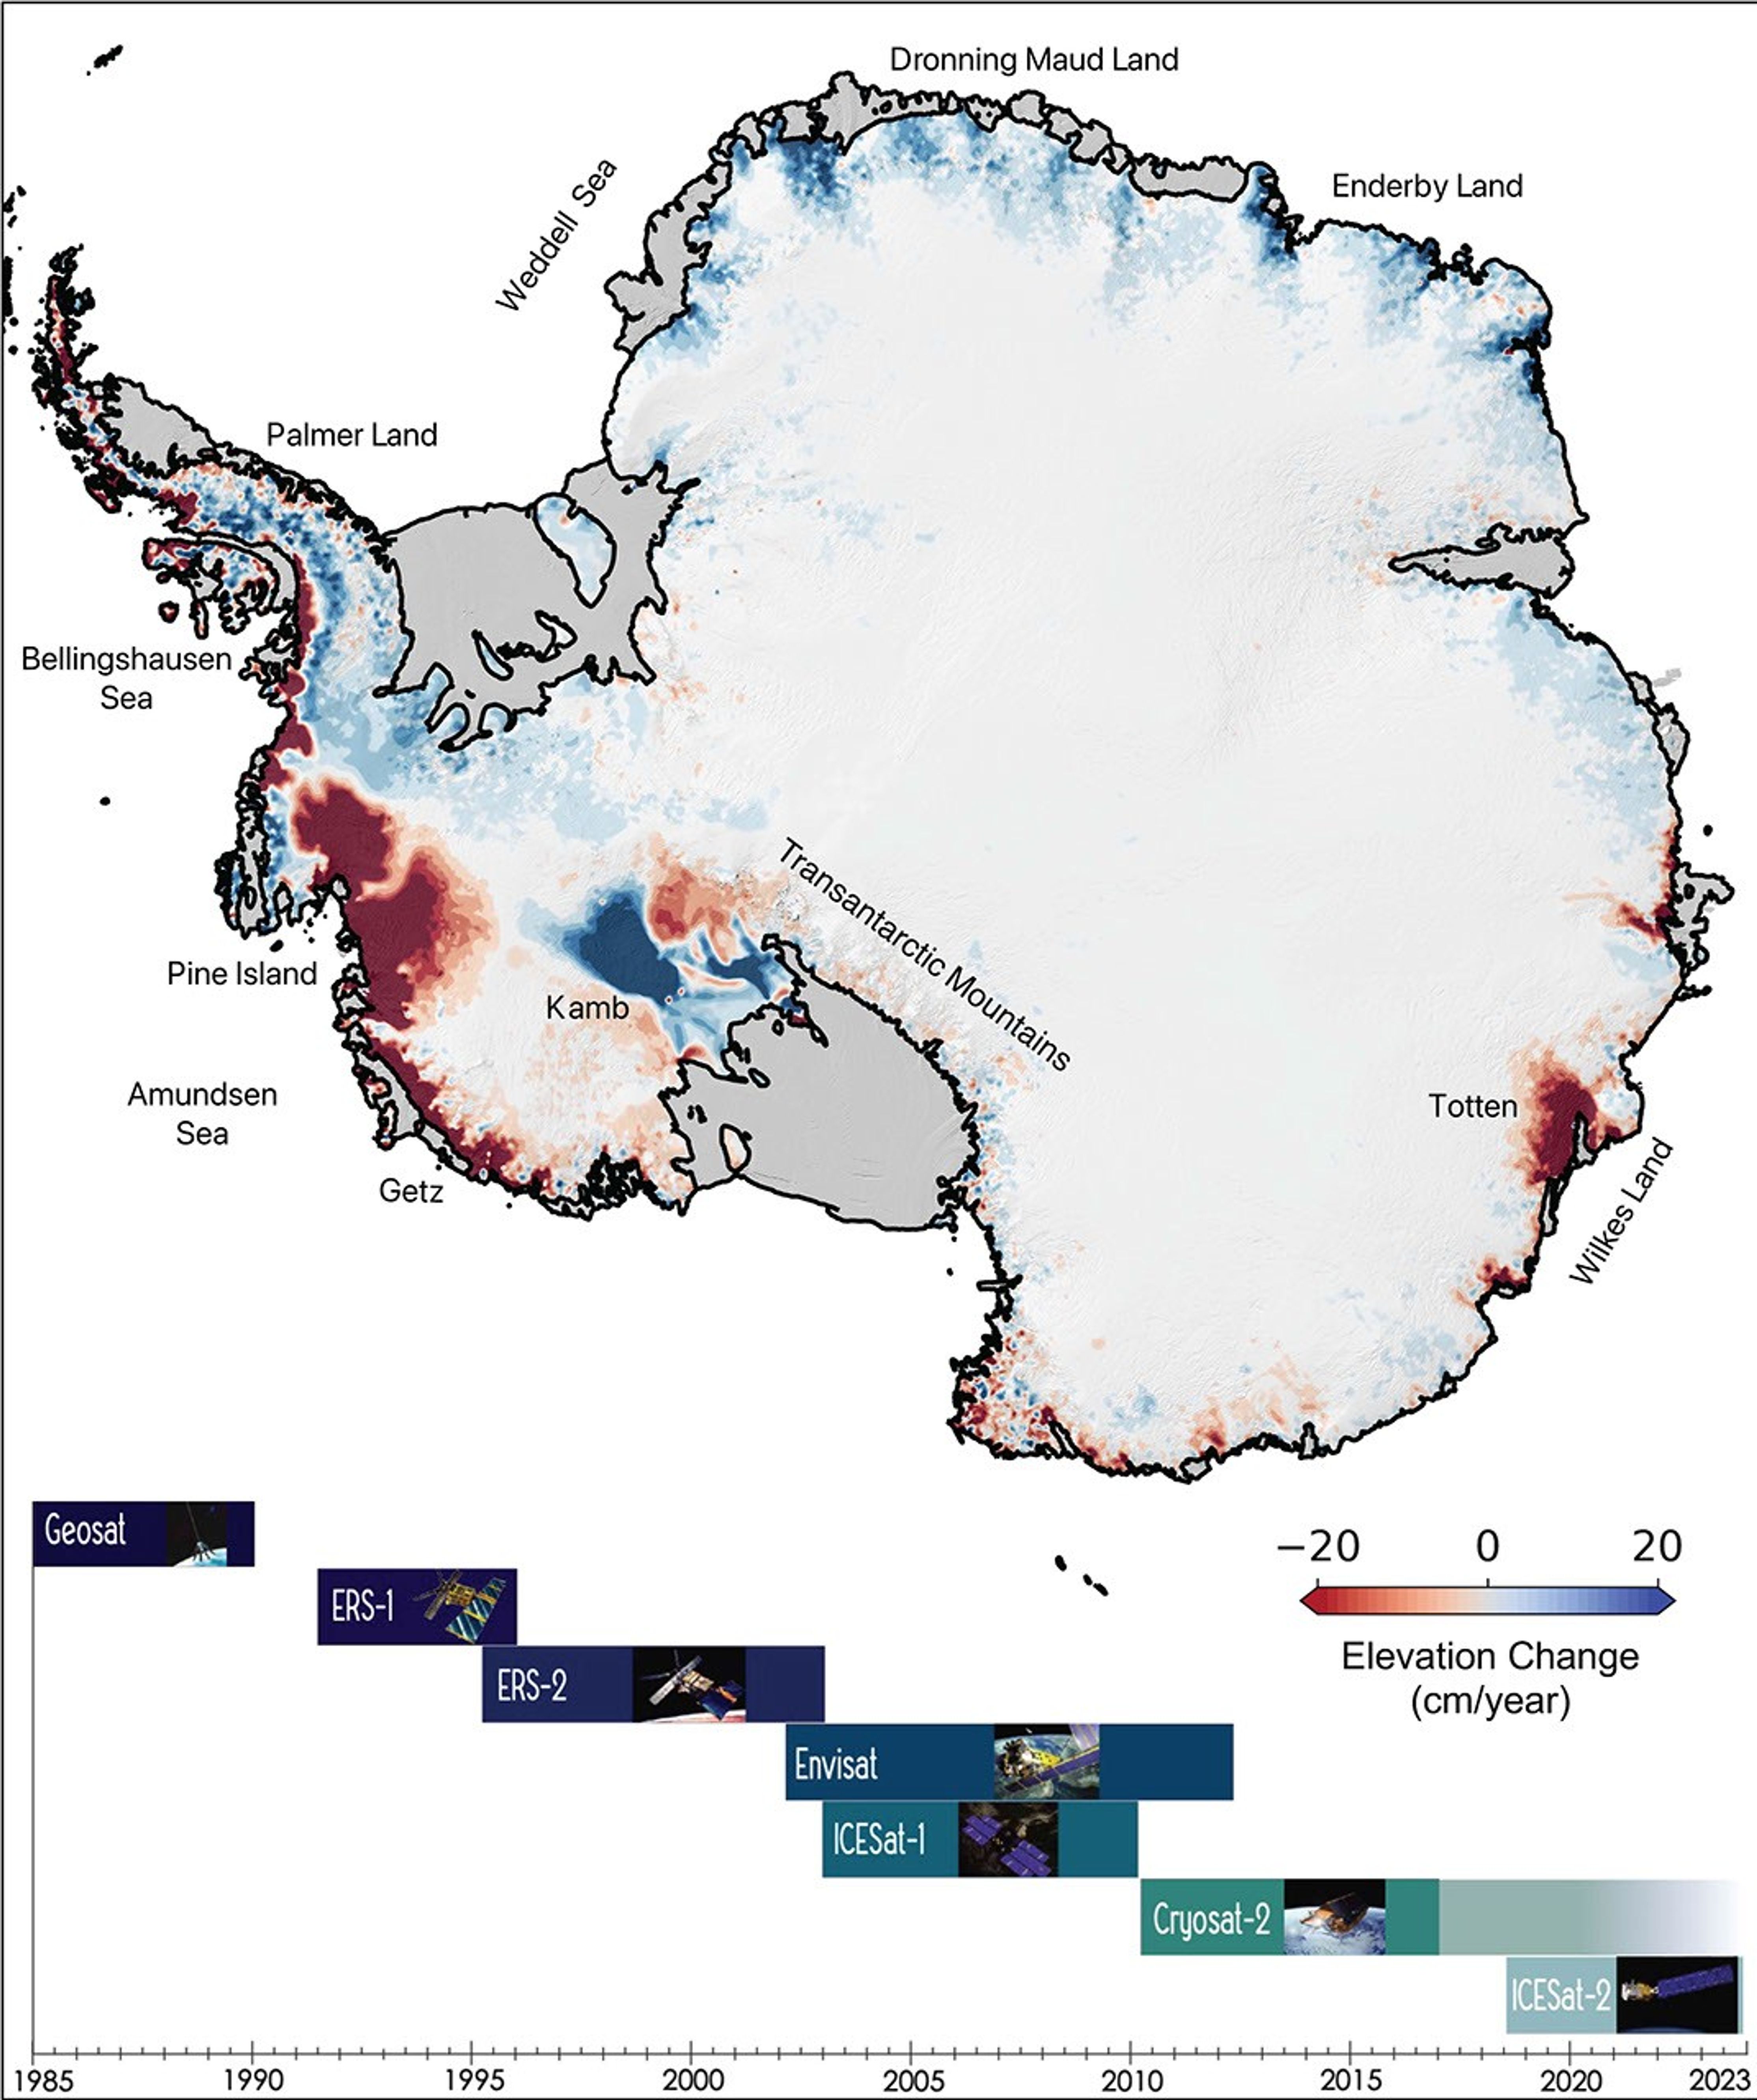
This map of Antarctica shows the changes in the elevation of the Antarctic ice sheet from 1985 through 2021. The map is part of a study, published in Earth System Science Data, conducted by researchers at NASA's Jet Propulsion Laboratory in Southern California.
Ice height diminishes (shown in red) as the ice sheet melts by contact with ocean water; ice height rises (shown in blue) where accumulation exceeds ice loss. Ice shelves are shown in gray.
The Pine Island and Thwaites glaciers in West Antarctica (the dark red spots on the left side of the map) are the largest areas of rapid ice loss. The stagnant Kamb Ice Stream (the dark blue area at middle-left) is the only major site of rapid accumulation as ice continues to push in from the interior but no longer flows out to an ice shelf.
The image summarizes a new data set of monthly high-resolution "snapshots" of ice change. The satellite altimetry missions that supplied data for the study are listed in the timeline at the bottom of the image: Geosat (U.S. Navy), ERS-1 and ERS-2 (ESA, or European Space Agency), Envisat (ESA), ICESat-1 (NASA), Cryosat-2 (ESA), and ICESat-2 (NASA).