Daily Cycles of Radiation and Pressure at Gale Crater

| Credit | NASA/JPL-Caltech/SwRI |
|---|---|
| Language |
|
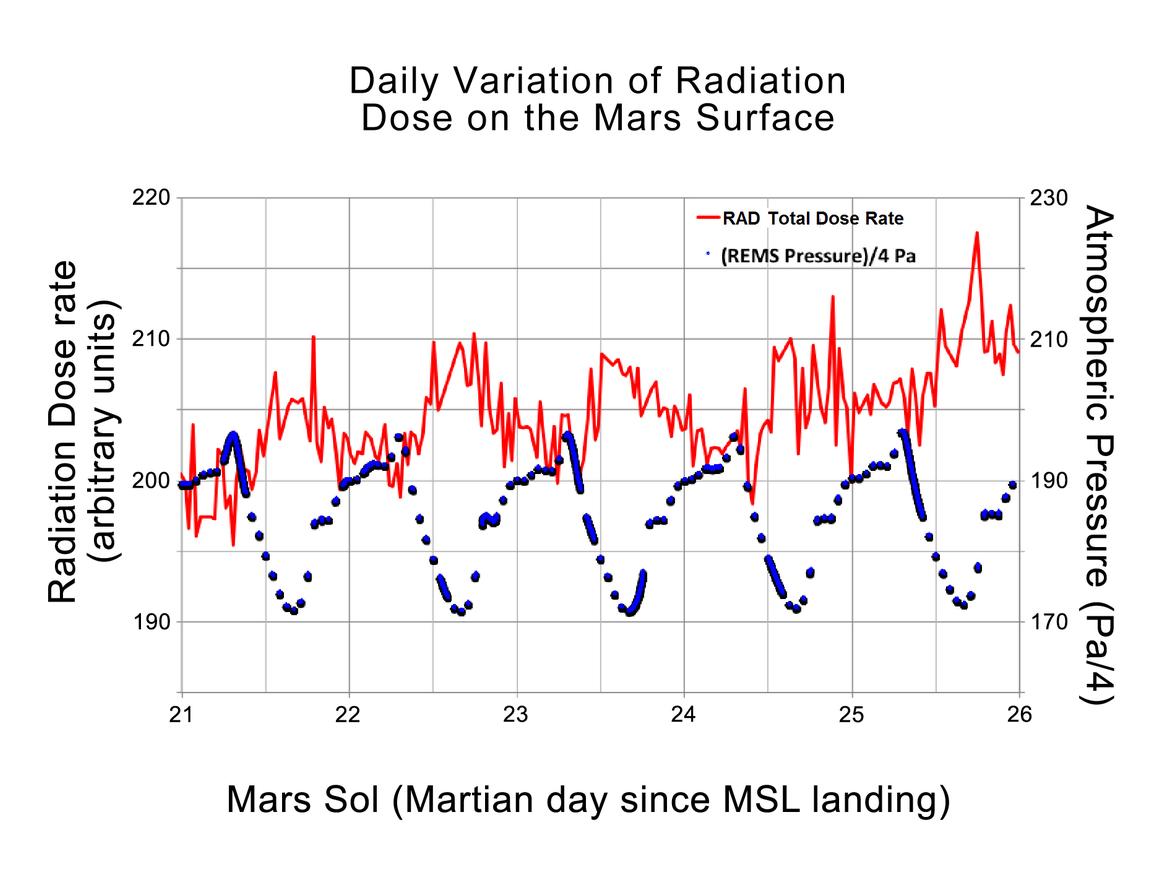
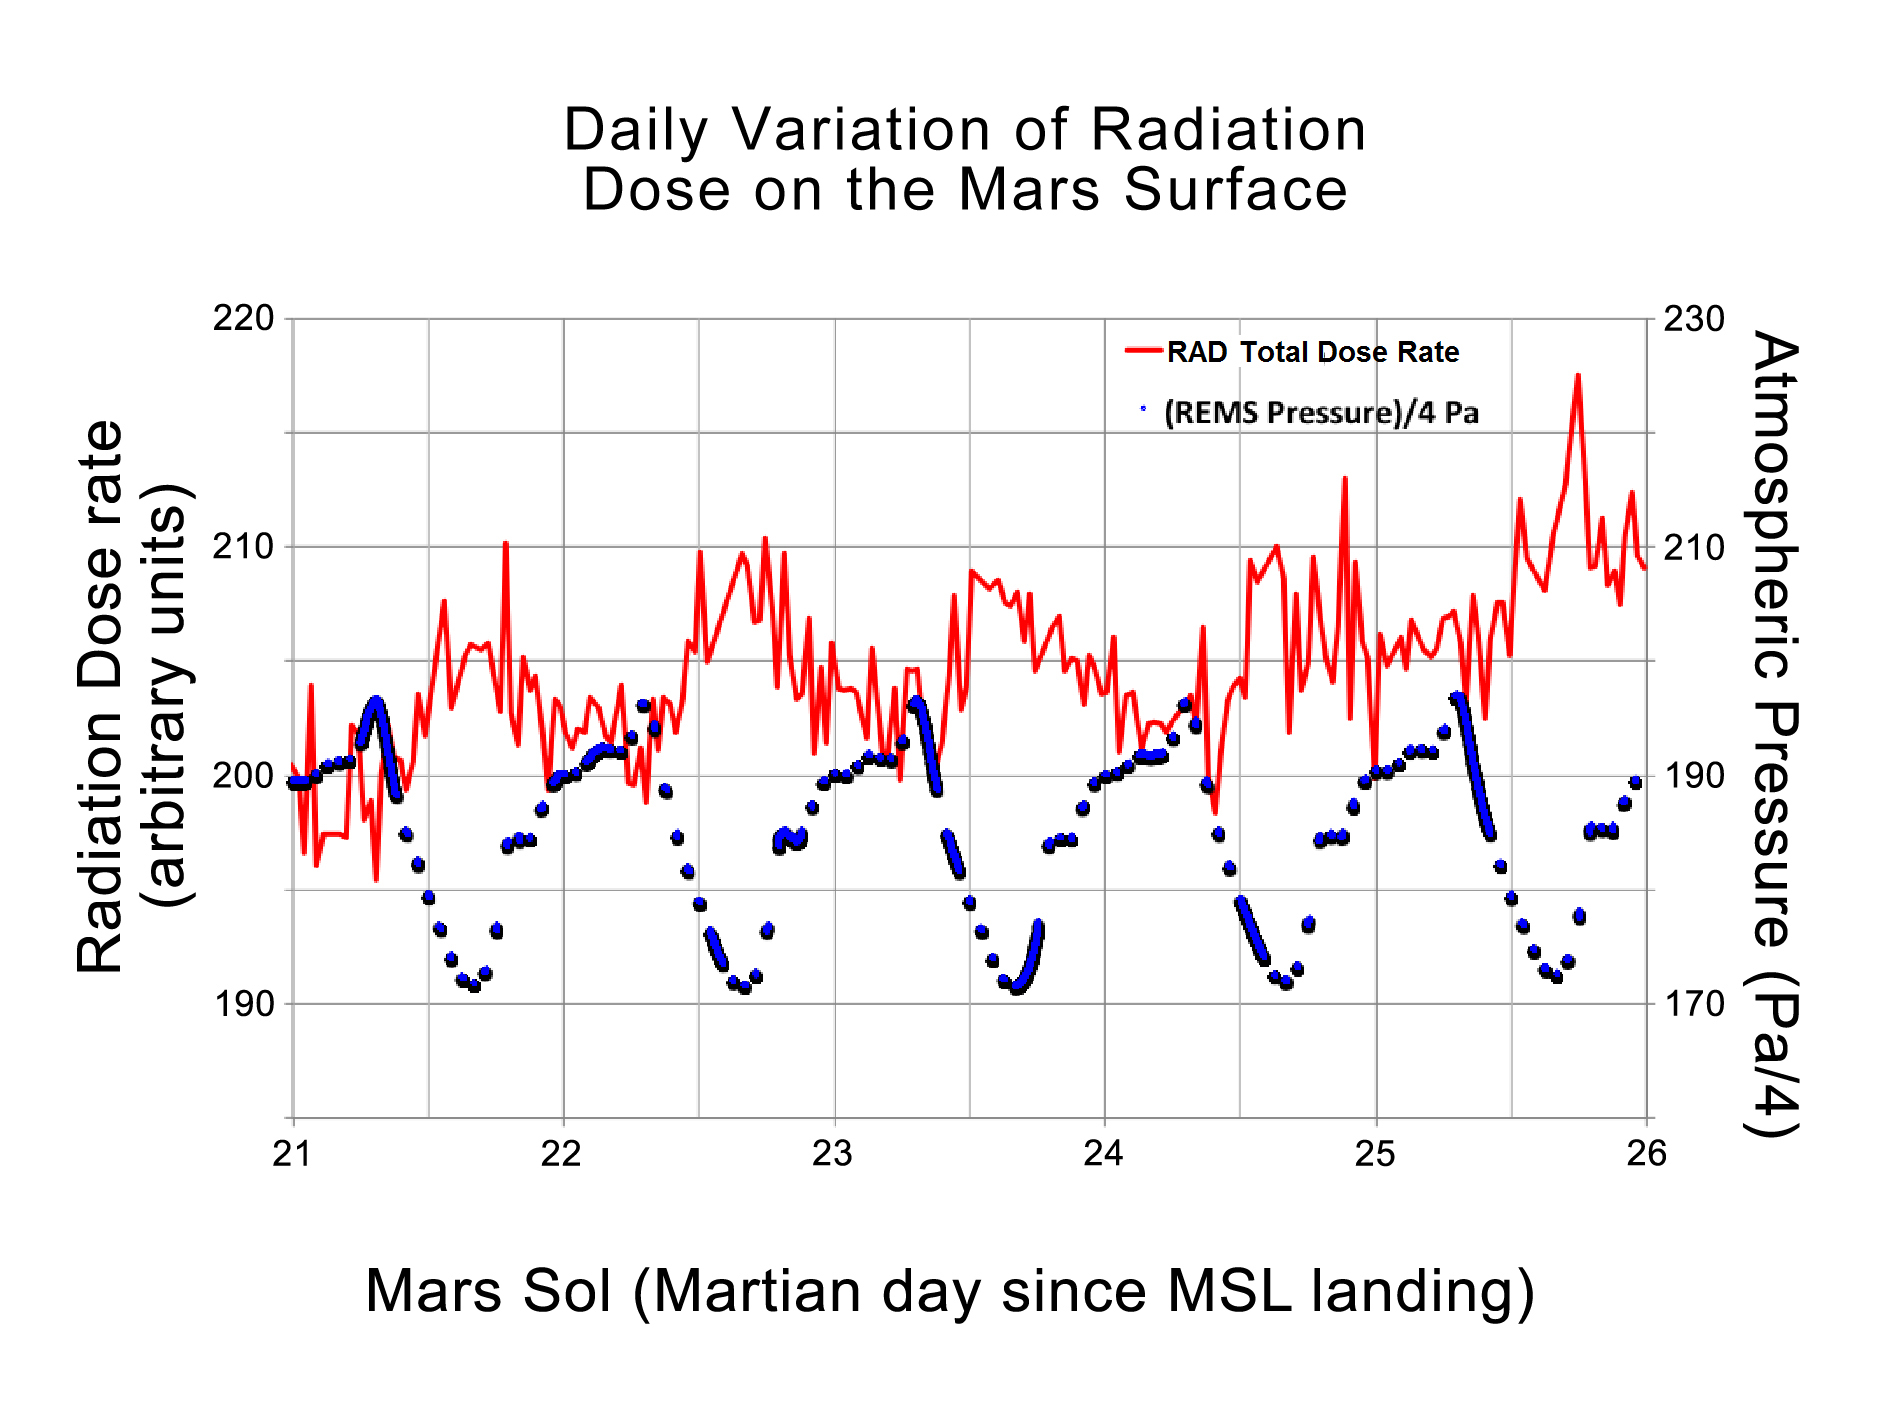
This graphic shows the daily variations in Martian radiation and atmospheric pressure as measured by NASA's Curiosity rover. As pressure increases, the total radiation dose decreases. When the atmosphere is thicker, it provides a better barrier with more effective shielding for radiation from outside of Mars. At each of the pressure maximums, the radiation level drops between 3 to 5 percent. The radiation level goes up at the end of the graph due to a longer-term trend that scientists are still studying.
The red line indicates the total dose rate of radiation from both charged particles and neutrons, as detected by Curiosity's Radiation Assessment Detector. The blue dots represent atmospheric pressure in units of Pascal (divided by four) taken by Curiosity's Rover Environmental Monitoring Station. The atmospheric data were scaled to fit in the same plot as the radiation data.
The dosages and pressures are plotted over five sols, or Martian days, from the 21st sol of operations to the 26th. That corresponds to Aug. 26 to Sept. 1, 2012. Curiosity landed on Mars on Aug. 5, 2012. Radiation dose is given in arbitrary units to reflect the magnitude of the variations. Calibration of the absolute dose levels is ongoing.

