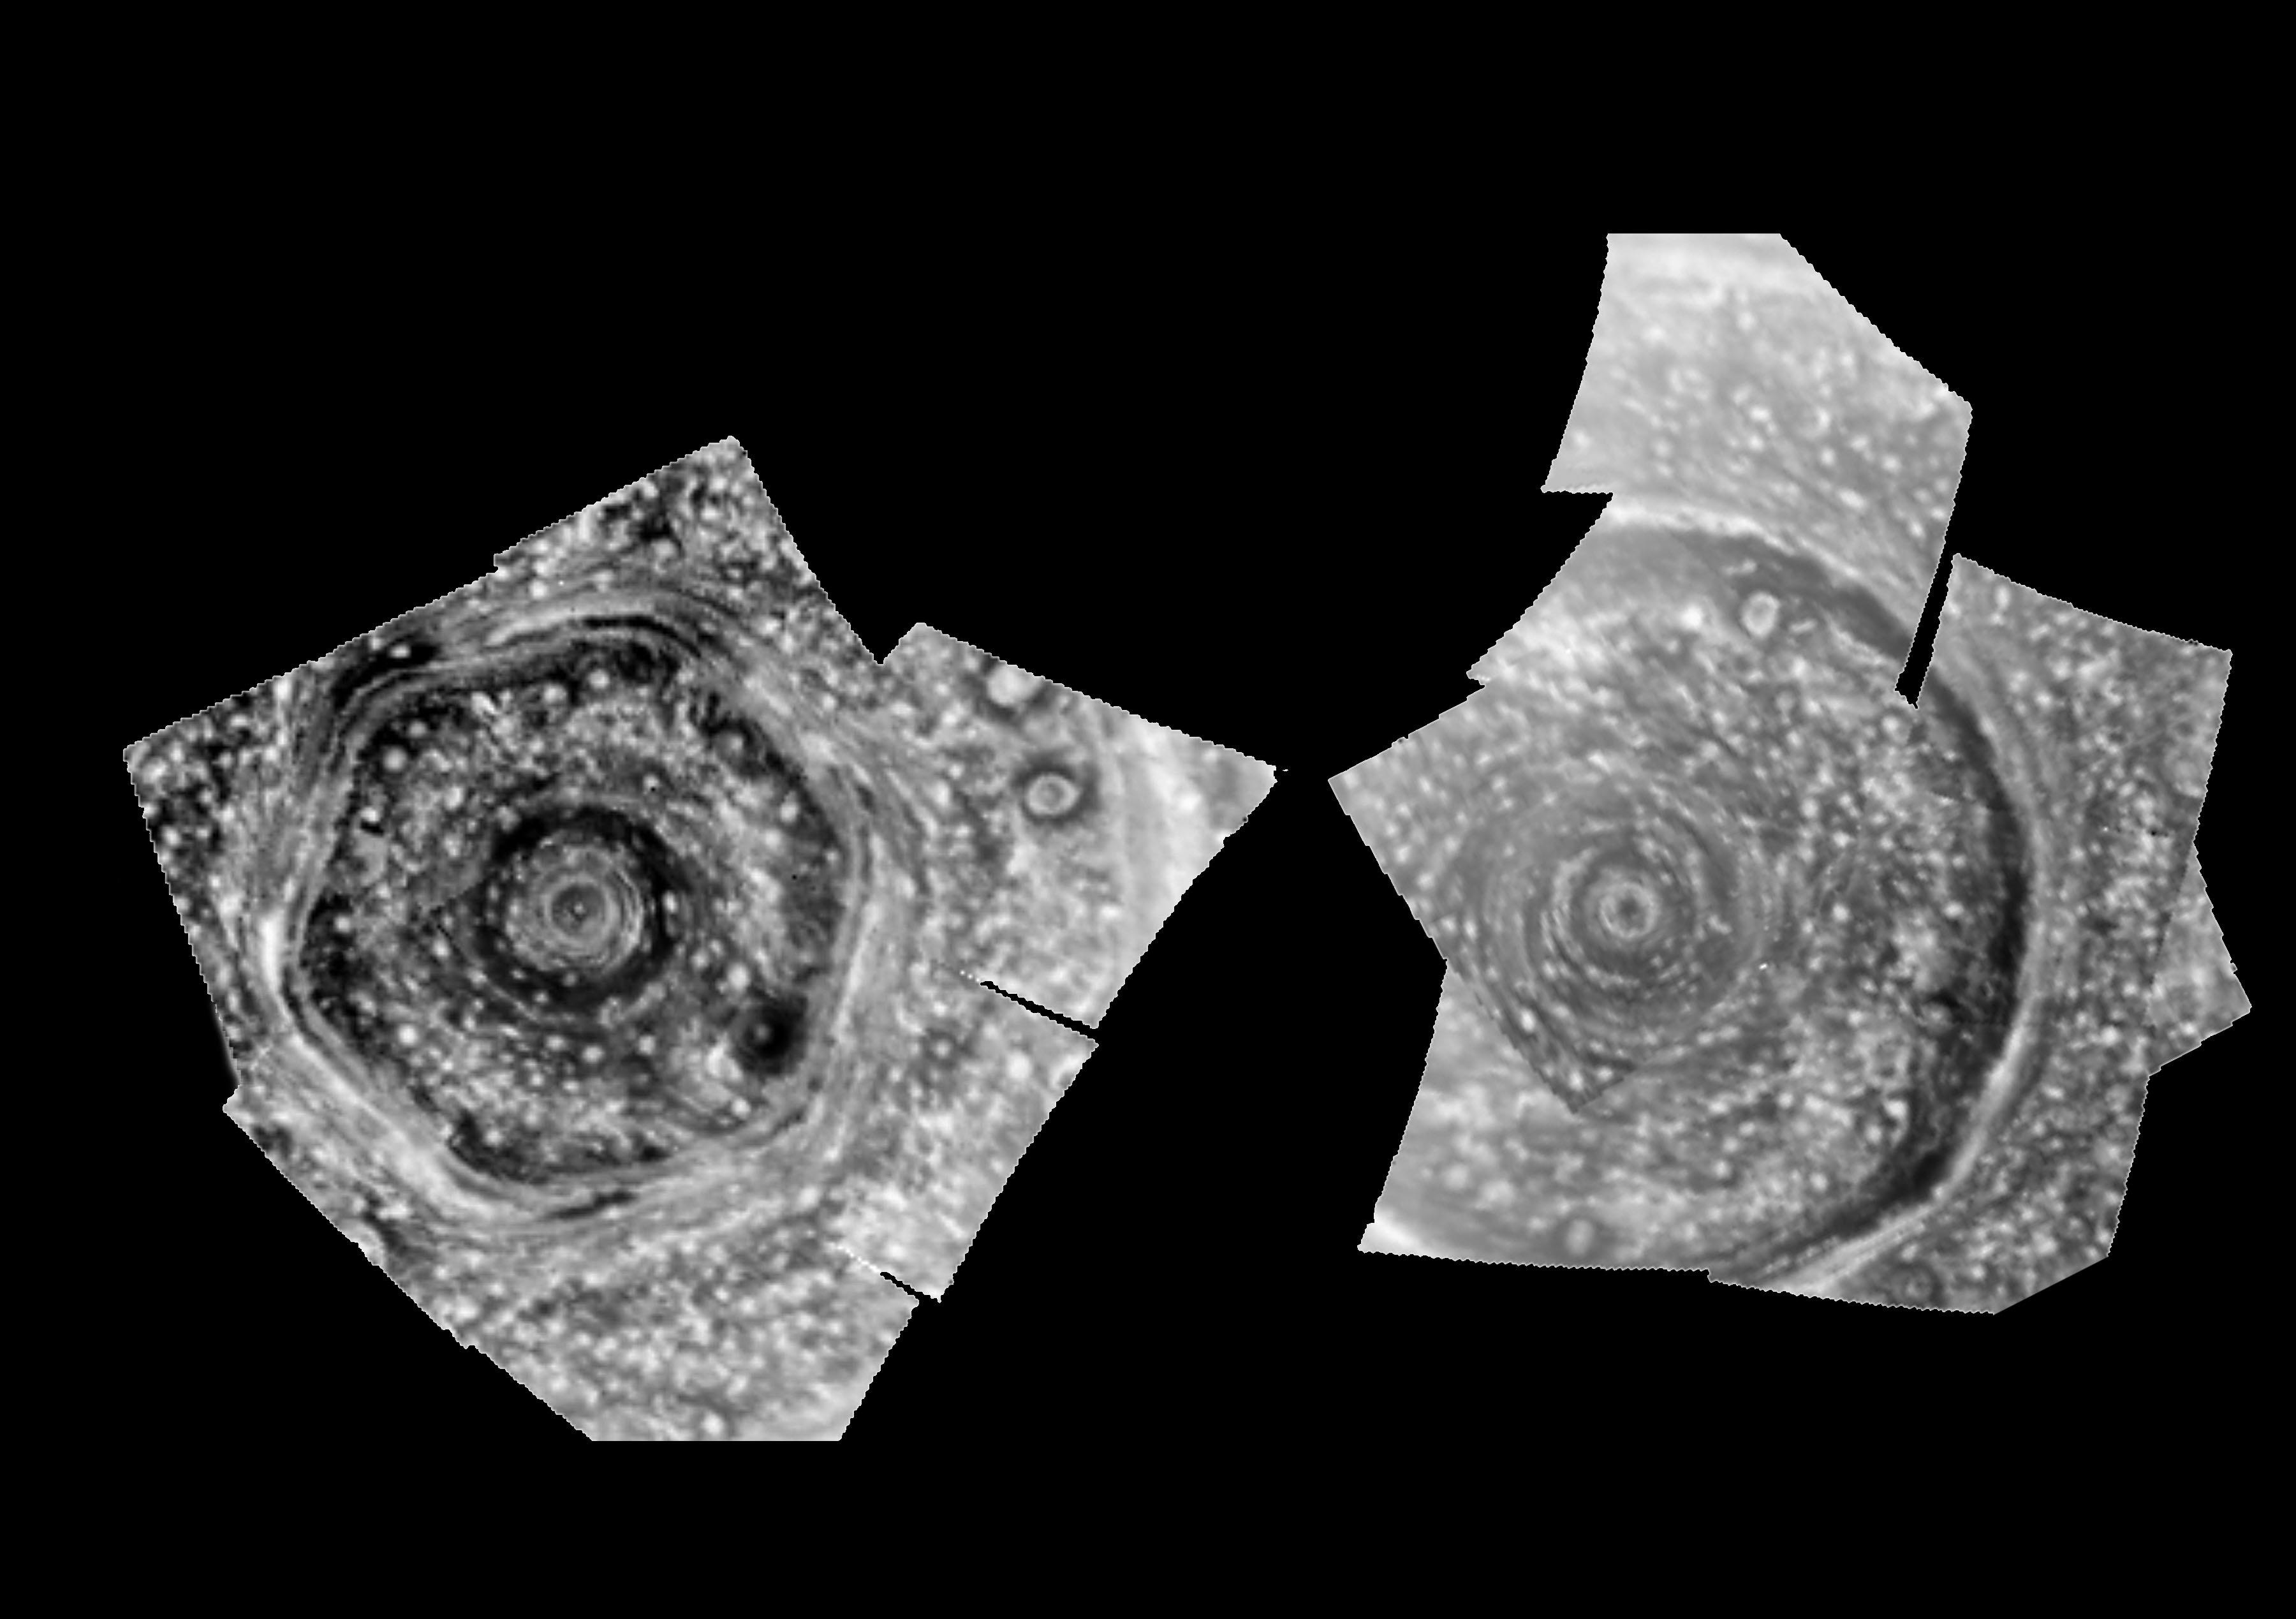
Infrared Images of Saturn’s Poles

| Credit | NASA/JPL/University of Arizona |
|---|---|
| PIA Number | PIA11216 |
| Language |
|
This is a side-by-side view of large cyclones at both poles of Saturn obtained by the visual and infrared mapping spectrometer onboard the Cassini spacecraft.
These high-spatial-resolution polar orthographic projections of the north (left) and south (right) polar regions show rings of clouds and hazes circling the poles, as observed in the near-infrared at a wavelength of 5 micron, some seven times the reddest wavelength observed by the human eye. The resolution is 200 kilometers (149 miles) per pixel.
The left image is the first detailed image of Saturn’s entire north polar region ever obtained. The movie covers a six-hour period at close range, as close as 240,000 kilometers (149,000 miles) above the clouds from a nearly-overhead viewpoint. Winds reach over 150 meters per second (325 miles per hour) at 88.3 degrees south latitude, just outside the first bright ring nearest the pole. The pole itself is covered by a small cloud some 600 kilometers (about 375 miles) wide. The cyclone reaches out some 12,000 kilometers (7,500 miles) from the pole, bordered by the hexagon. This hexagon is populated by fast-moving clouds which also reach speeds of over 500 kilometers per hour (300 miles per hour).
The south pole image (right), acquired just a few hours after the north polar image also shows a polar cyclone, complete with a central eye clear of clouds. This cyclone extends out some 15,000 kilometers (9,000 miles) from the pole.
At both poles, the discrete, circular and oblong clouds dotting the image are likely convective upwelling originating deep inside the planet, which help to power the cyclones. These views show clouds throughout the atmosphere, down to as deep as 125 kilometers (78 miles) below the haze. Many of the features seen are thought to be deep-level clouds of ammonia-hydrosulfide, which form at these levels and rise to higher altitudes in convective updrafts.
Normally, Saturn’s internal glow illuminates Saturn’s deep clouds from below, thus rendering the clouds in silhouette against this background glow. In these images, the contrast has been reversed so as to make the clouds appear more like they would look if seen in reflected sunlight. The original images obtained by infrared spectrometer show the clouds as dark features against the internal glow. The grid shows planeticentric latitudes. In this polar orthographic projection, 0 degrees longitude is toward the top, 90 degrees west longitude to the right, etc, based on the longitude system established by Voyager.
These images were obtained on June 15, 2008 (left) and June 16, 2008 (right) from distances of 602,000 kilometers (374,000 miles) and 652,000 kilometers (405,000 miles) above the clouds, respectively, and a sub-spacecraft planetocentric latitude of 73 degrees north (left) and 48 degrees south (right).
The Cassini-Huygens mission is a cooperative project of NASA, the European Space Agency and the Italian Space Agency. The Jet Propulsion Laboratory, a division of the California Institute of Technology in Pasadena, manages the mission for NASA's Science Mission Directorate, Washington, D.C. The Cassini orbiter was designed, developed and assembled at JPL. The Visual and Infrared Mapping Spectrometer team is based at the University of Arizona.
For more information about the Cassini-Huygens mission visit http://saturn.jpl.nasa.gov/home/index.cfm. The visual and infrared mapping spectrometer team homepage is at http://wwwvims.lpl.arizona.edu.
