


Jason-CS (Continuity of Service) / Sentinel-6
Filters
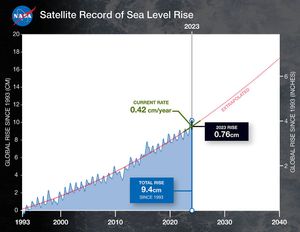
This graph shows global mean sea level (in blue) since 1993 as measured by a series of five satellites. The…
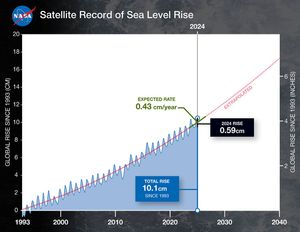
This graph shows global mean sea level (in blue) since 1993. The solid red line indicates the trajectory of this…
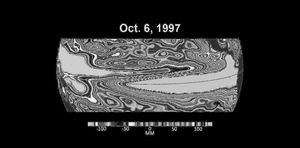
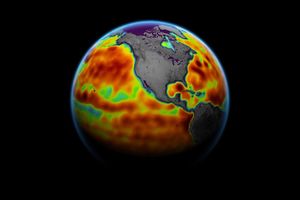
The maps in the animation show sea levels in the Pacific Ocean during early October of 1997, 2015, and 2023,…
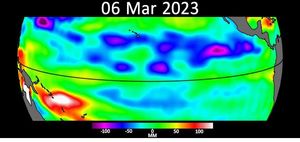
This animation shows Kelvin waves moving across the equatorial Pacific Ocean from west to east during March and April, 2023.…
This map shows sea level measured by the Sentinel-6 Michael Freilich satellite from June 5 to15. Red areas are regions…
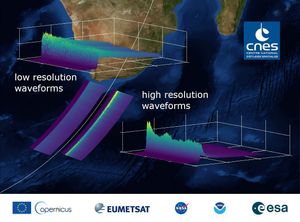
This graphic shows radar measurements, called waveforms, collected by the sea level instrument on Sentinel-6 Michael Freilich.
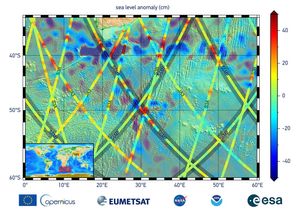
The data in this graphic are the first sea surface height measurements from the Sentinel-6 Michael Freilich satellite (S6MF), which…
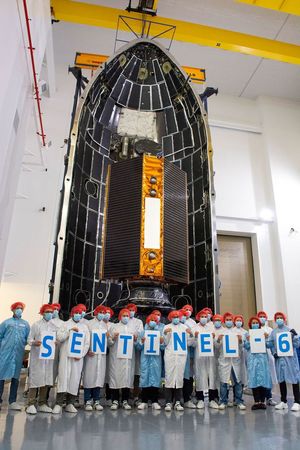
Technicians and engineers working on the Sentinel-6 Michael Freilich satellite pose in front of the spacecraft in its protective nosecone,…
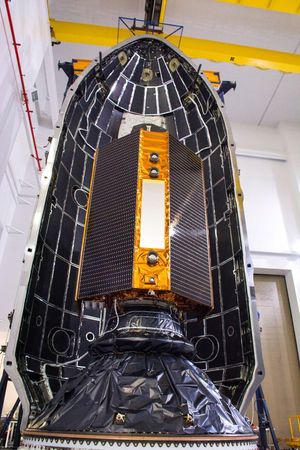
The Sentinel-6 Michael Freilich satellite is encapsulated in a protective nosecone, or payload fairing, at Vandenberg Air Force Base in…