What would you do with 50 years of Earth observations?
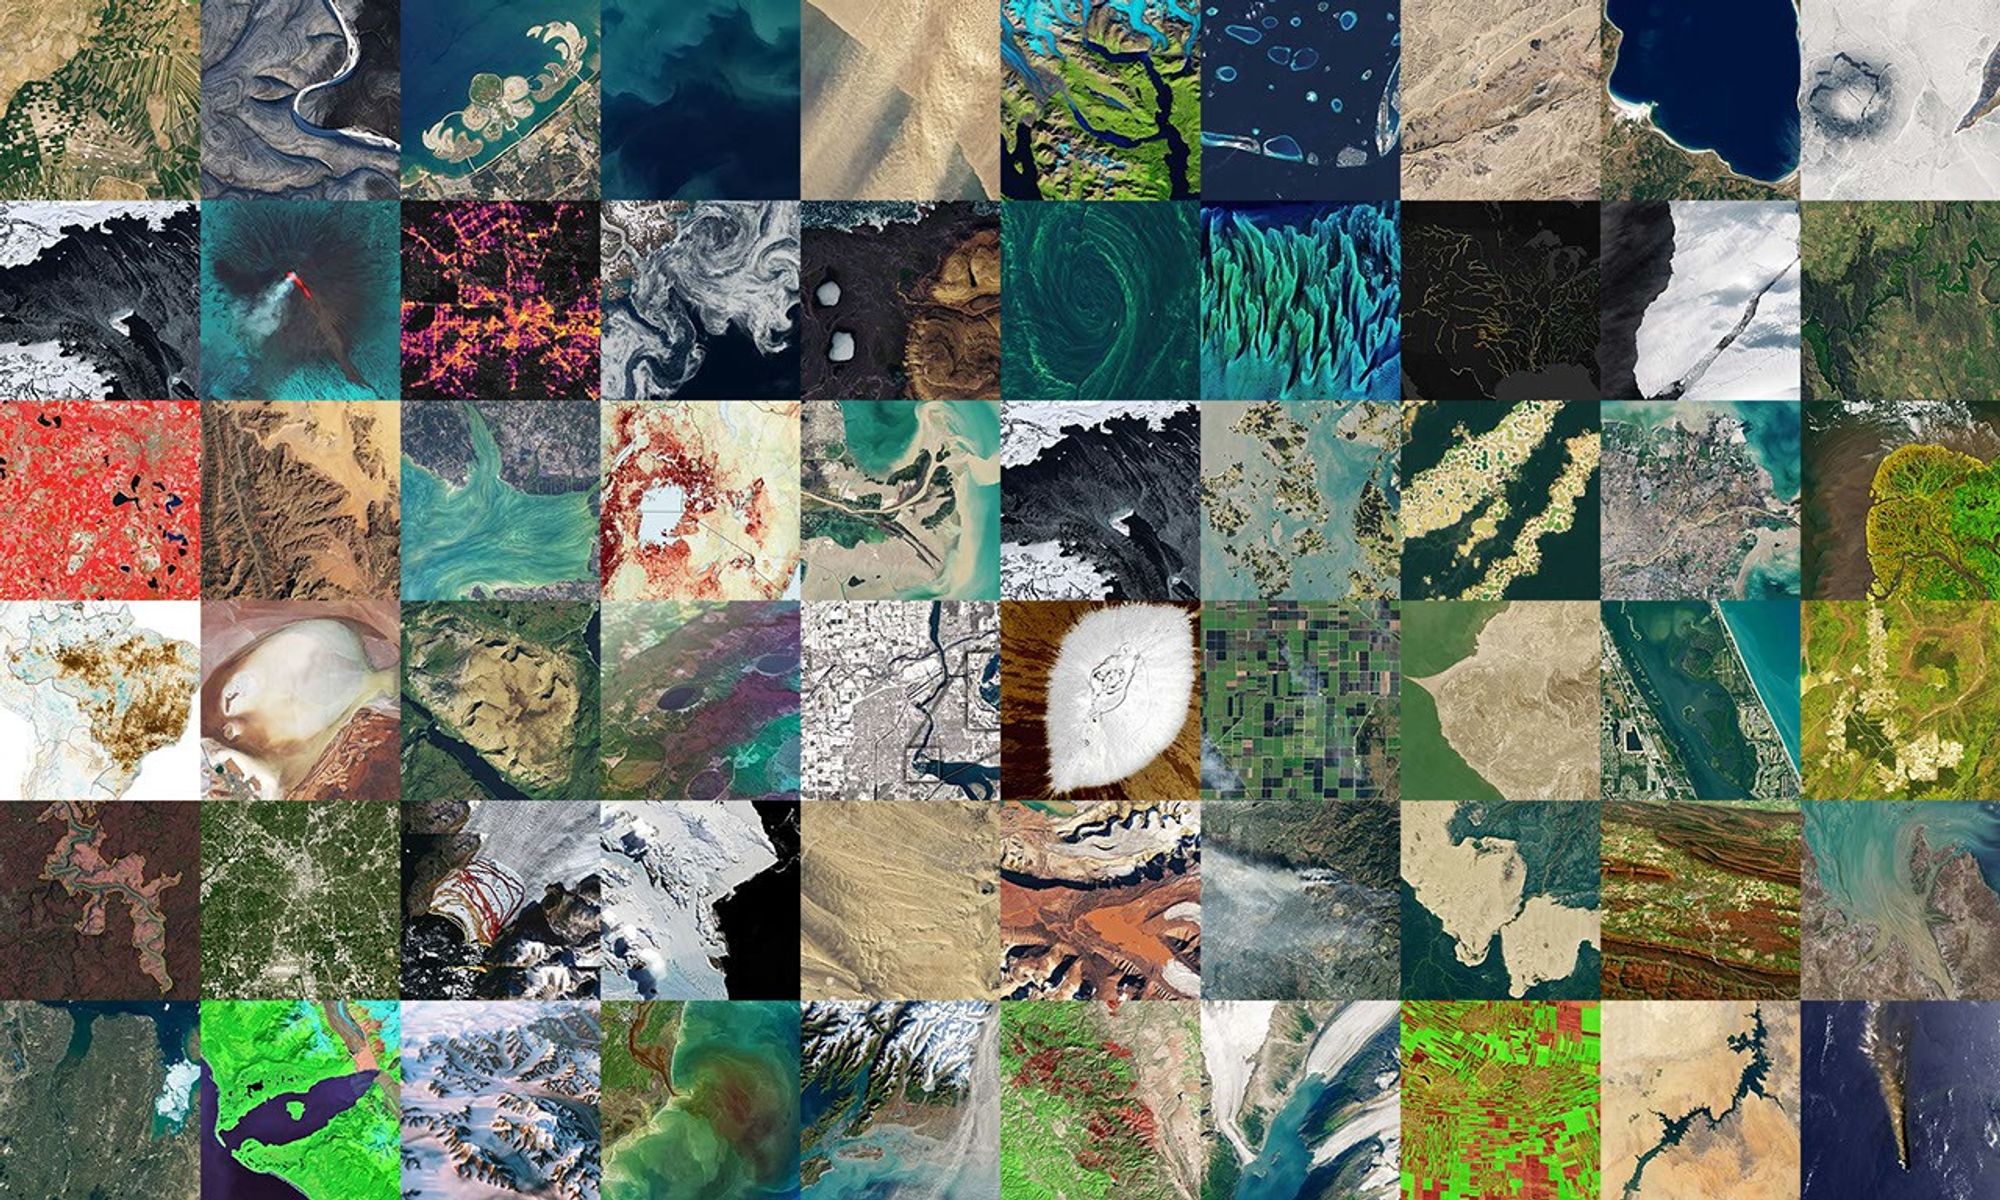
With 9 million images of our home planet’s landscapes and coastlines seen from space, all for free at your fingertips?
The Landsat mission asks just that.
Since 1972, this partnership between NASA and the U.S. Geological Survey has continuously had satellites in orbit, looking back at Earth – and it continues with this year’s Landsat 9 launch.
Decades of Observation
Over the decades, Landsat has shown us:
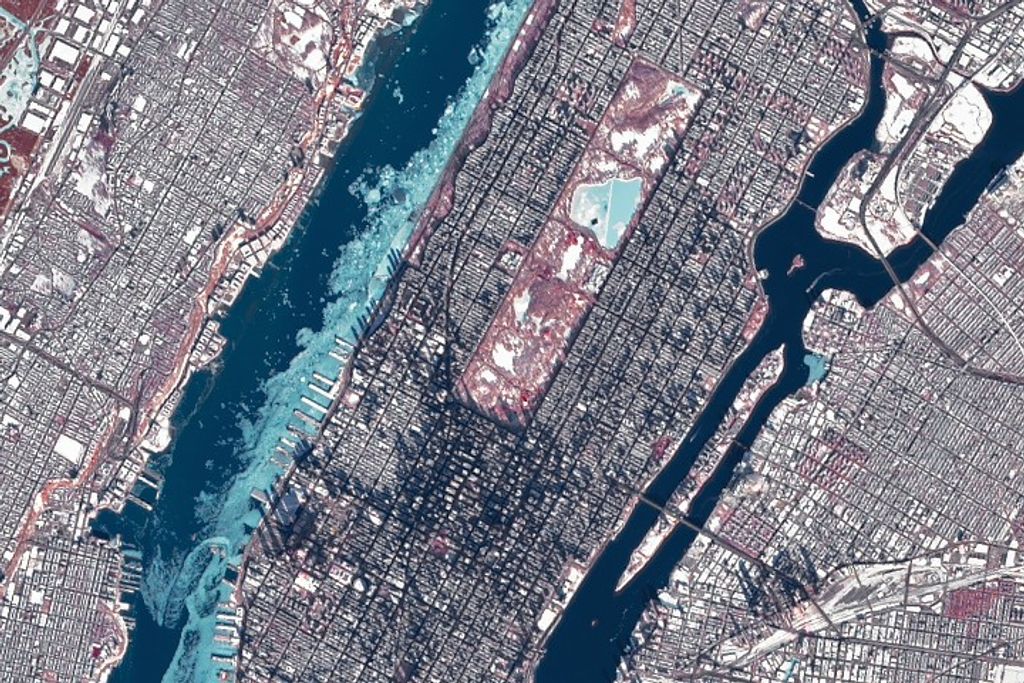
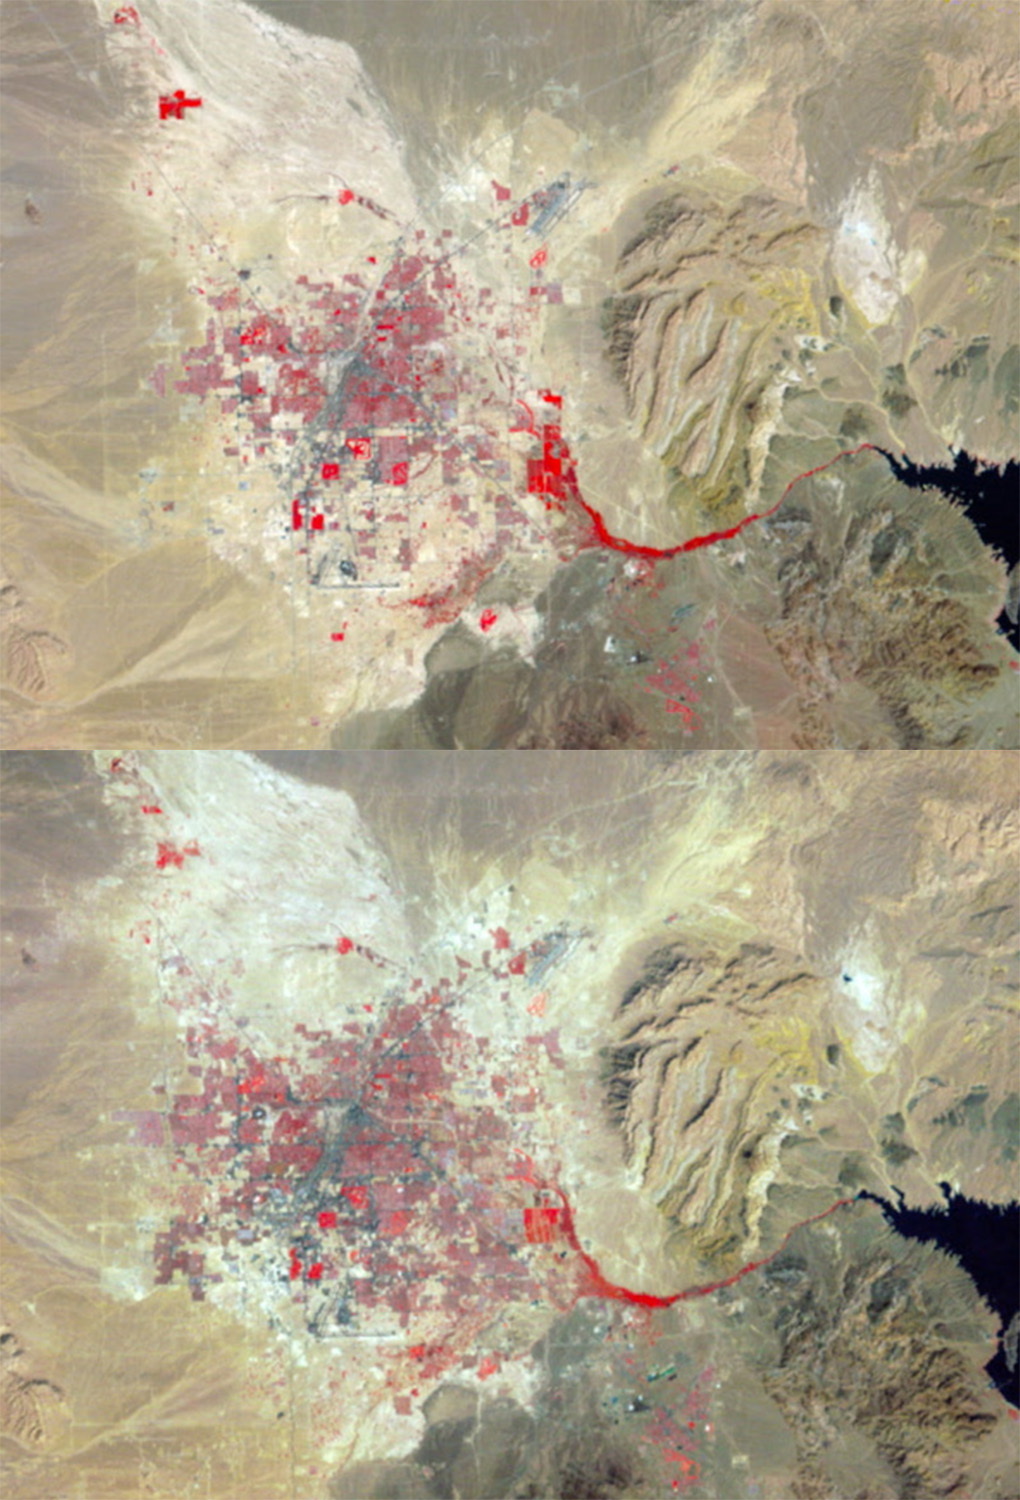
Cities expanding into the desert (1972-1982)
Rivers and deltas changing course (1984-1991)
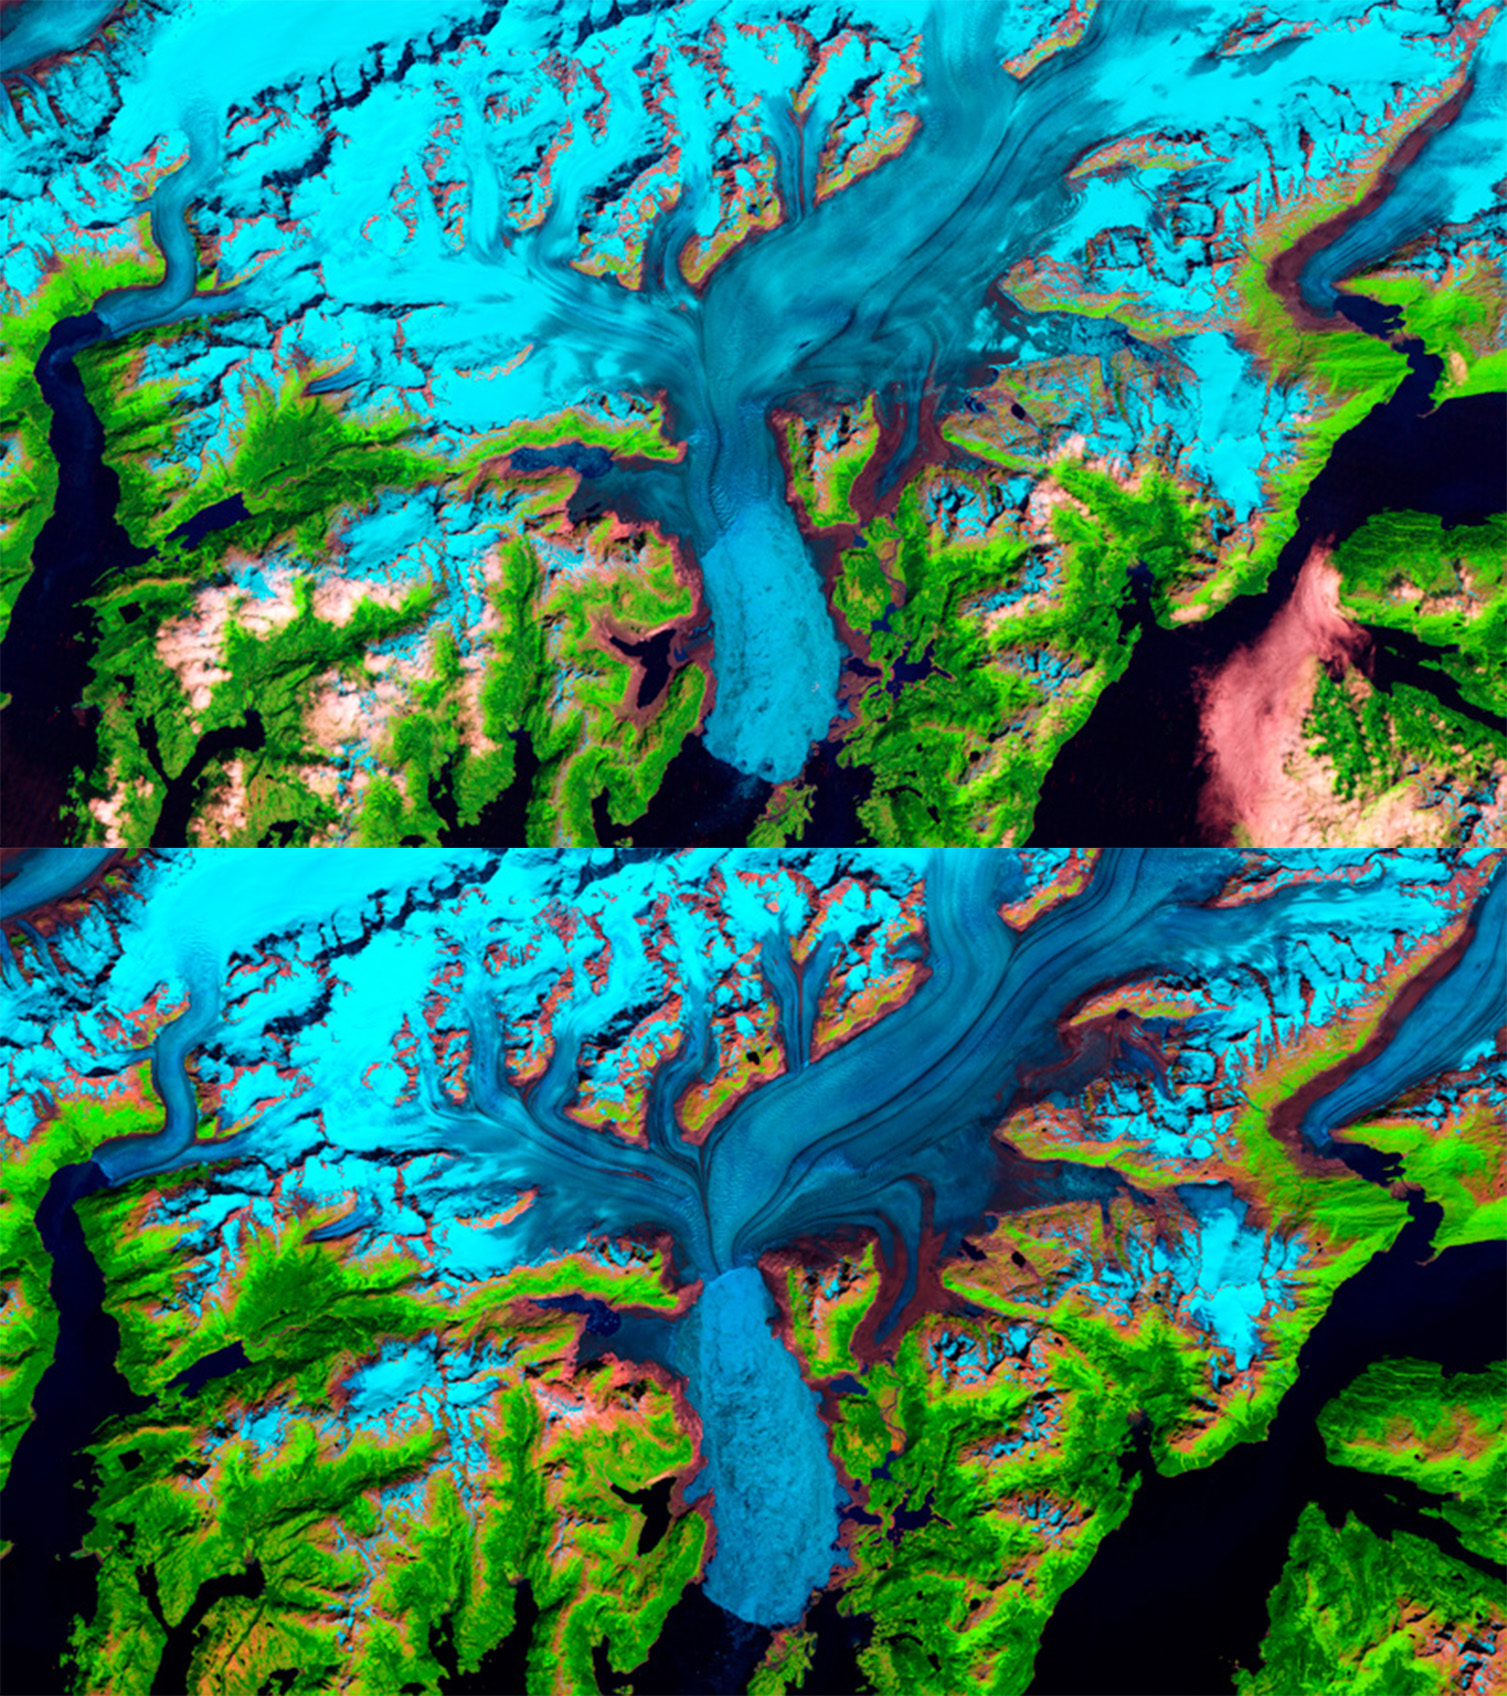
Glaciers melting (1995-2002)
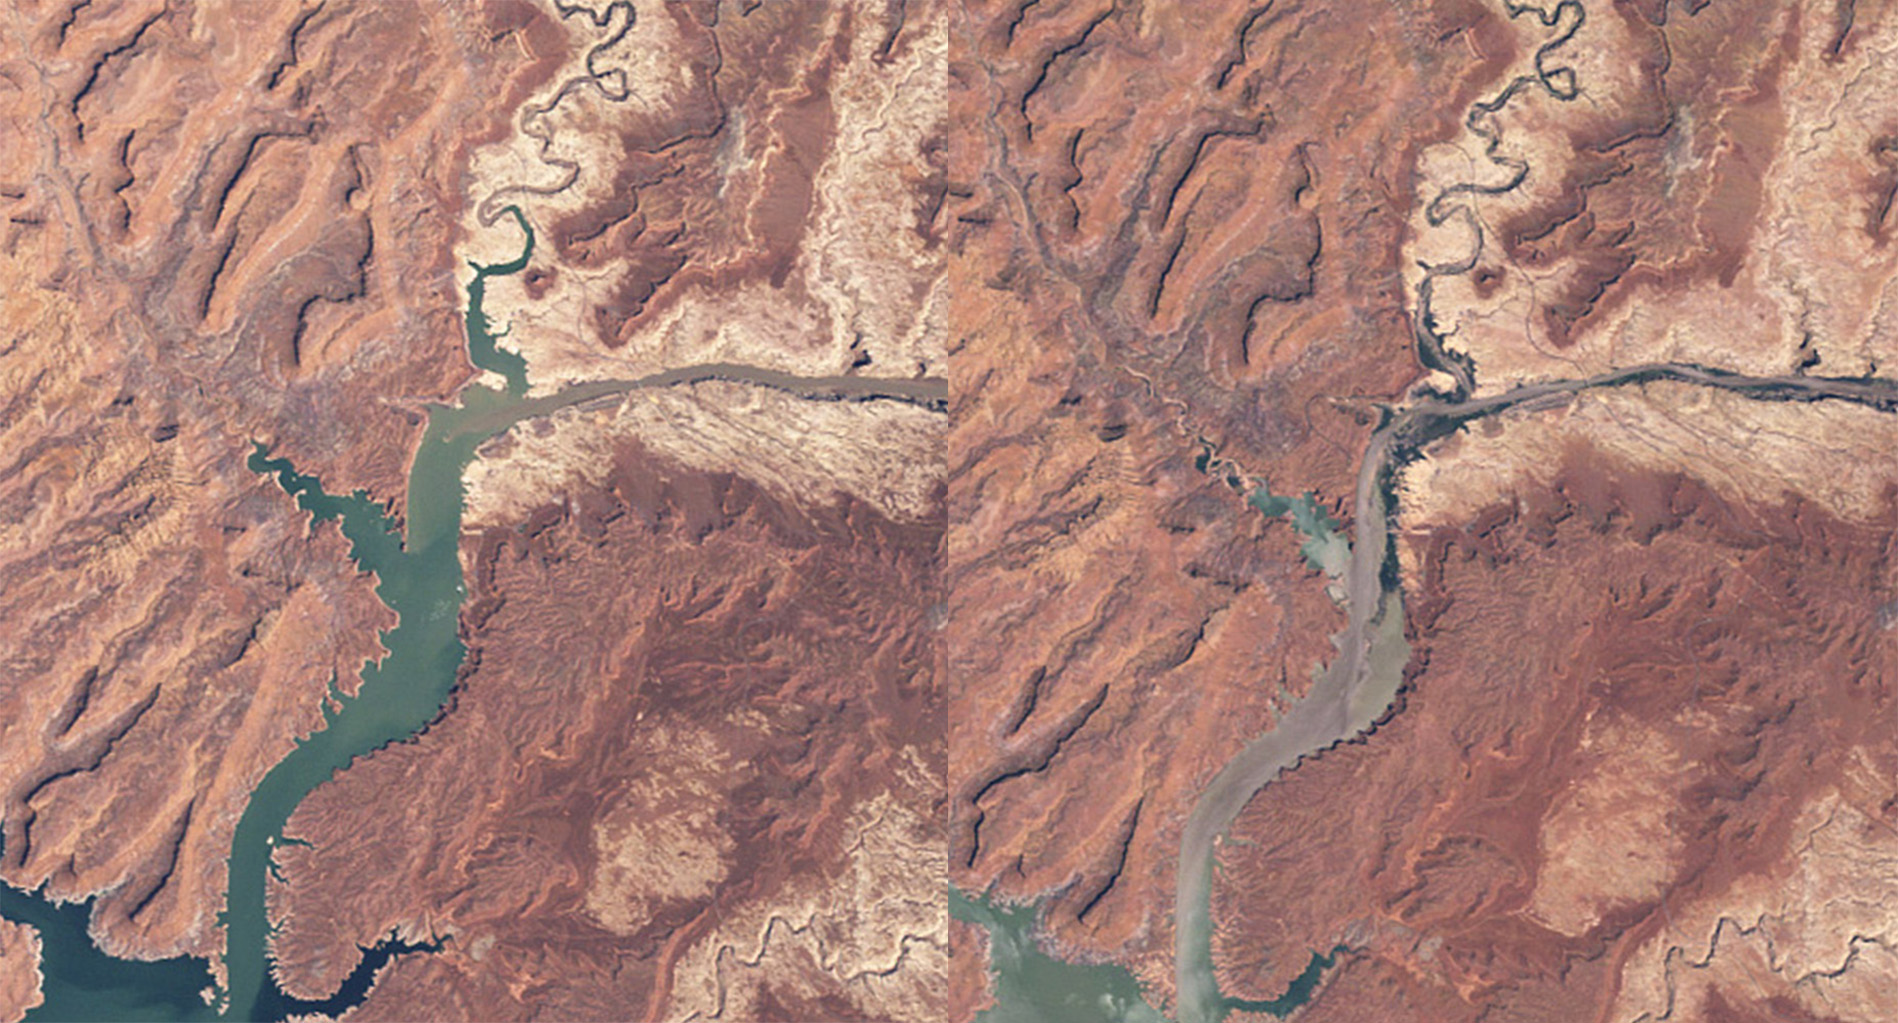
Reservoirs drying up in droughts (2002-2007)
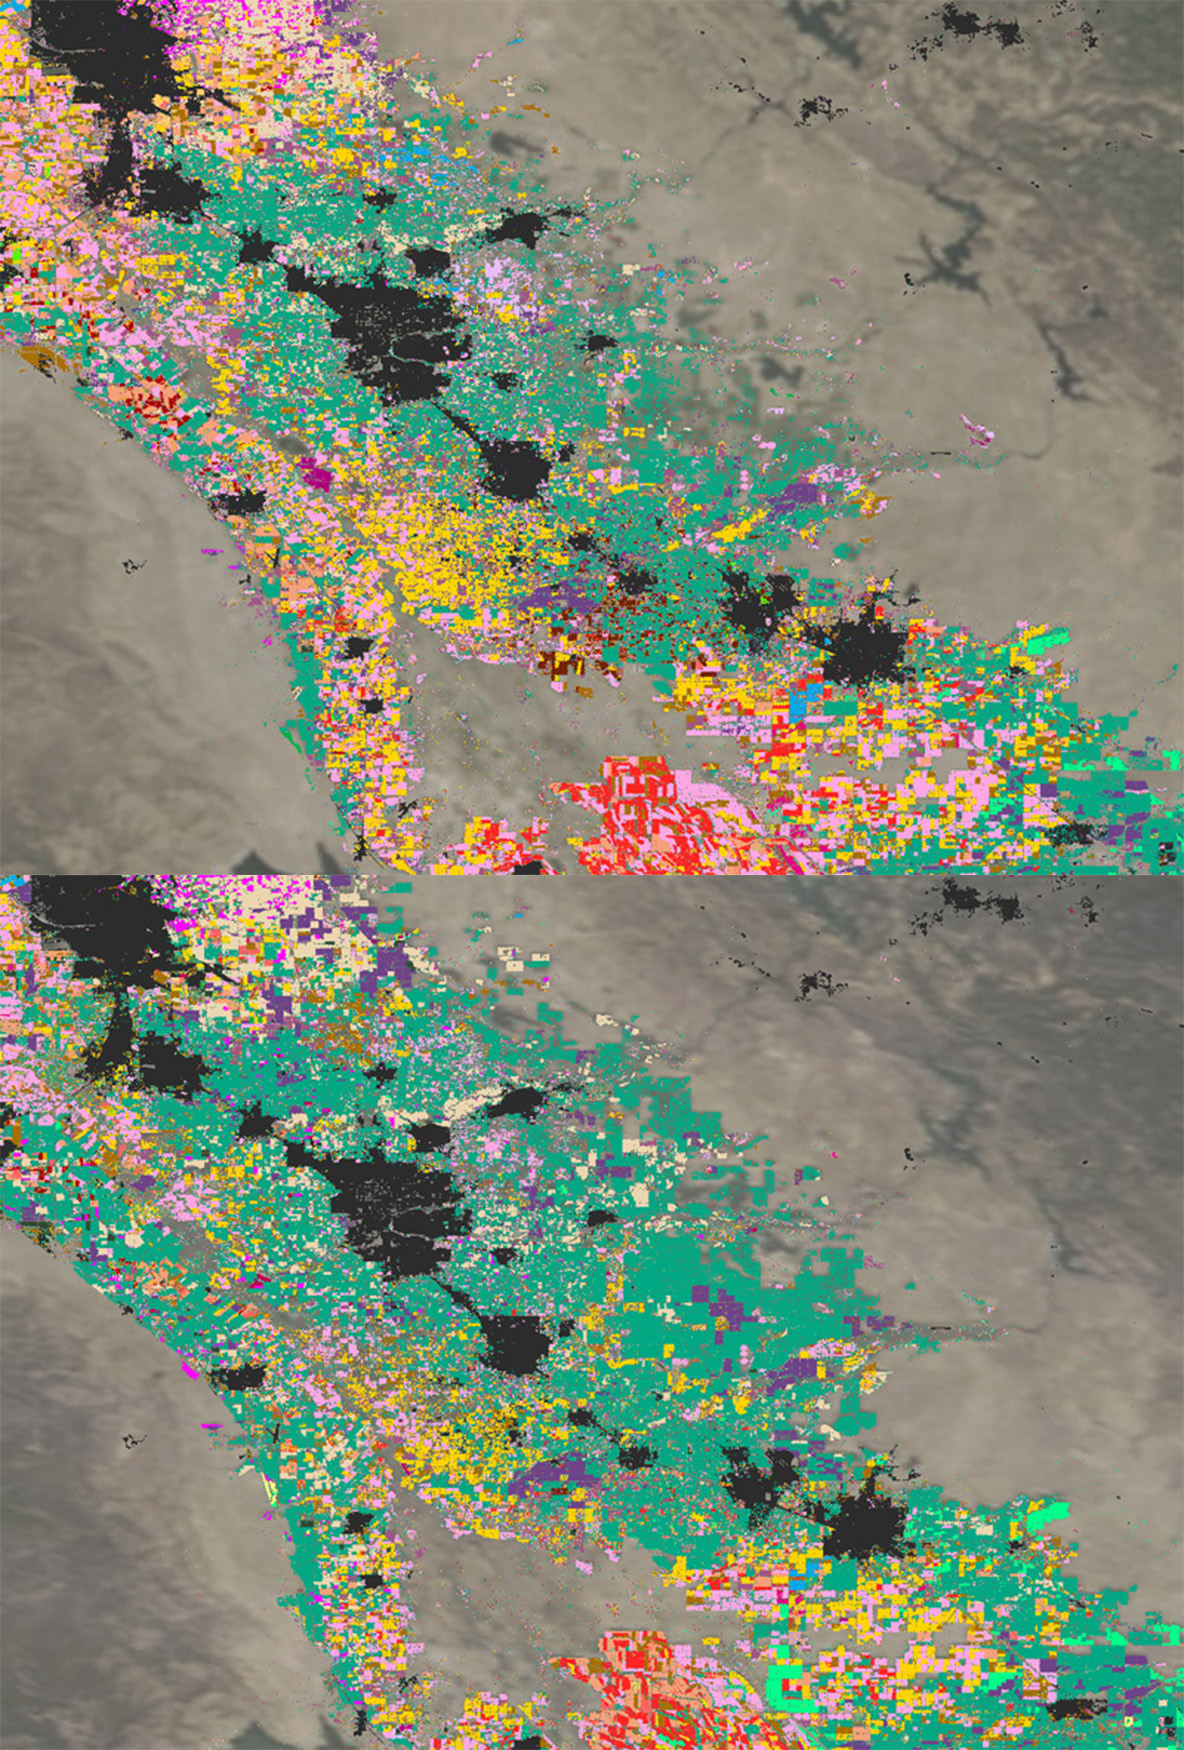
Farmers changing what they grow (2012-2020)
Data in Action
Landsat satellites give us a global perspective of how Earth is changing. That change could be due to natural causes like earthquakes, or due to human-caused drivers like greenhouse gas emissions that lead to warming temperatures on a global scale.
The satellite technology improves through the years, but the mission stays the same: monitor Earth’s land and coastal regions to help people manage natural resources. A recent USGS study found that in 2017 alone, having free and available Landsat data resulted in more than $3.4 billion in economic benefits to society.
Generations have used Landsat data to tackle problems crucial to everyday life on our planet.
California
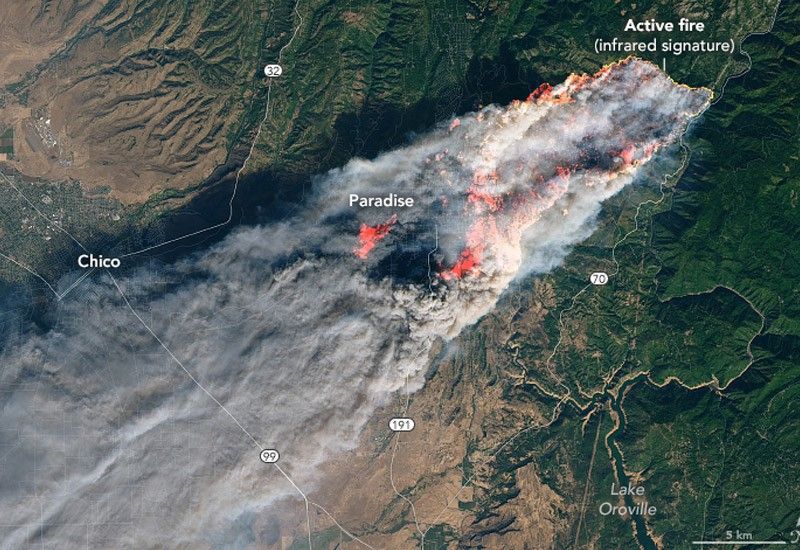
In wildfire-prone California, Landsat data provides crucial information about the health of a forest. If a beetle infestation or drought kills trees, it shows up in Landsat images and tells us an area could be more at risk of a fire.
When a wildfire burns, Landsat images in natural color capture plumes of smoke. The satellite also has instruments that let us peer through the smoke and clouds to outline the extent of a burning or smoldering fire.
Landsat’s job isn’t over after the flames die down. The satellite helps direct recovery experts to the most damaged sites for replanting and landslide-prevention efforts. A recent study estimated Landsat data saves federal agencies in the United States about $7.7 million annually in post-fire recovery efforts by identifying these restoration sites.
Utah
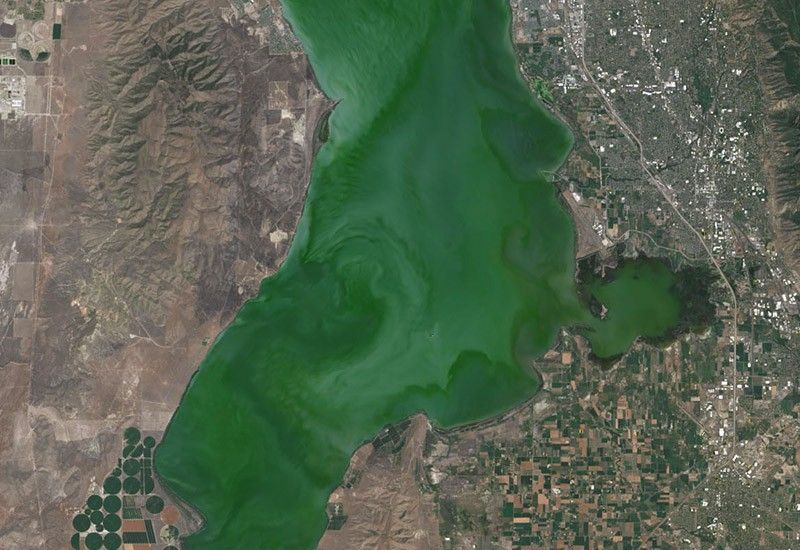
From its orbit 400 miles above Earth, Landsat can also help us identify lakes and reservoirs struck by potentially harmful algal blooms. These greenish blooms are swirls of microscopic organisms, which can release toxins that sicken people and pets.
Scientists are developing computer programs that would use Landsat and other satellite data to automatically warn lake recreation managers when blooms pop up – allowing them to test the waters and warn swimmers, boaters and picnickers before the little organisms become a big problem. Landsat 9 will be even better at distinguishing details of scenes that are really dark, like the deep blues and greens of these lakes.
Greenland
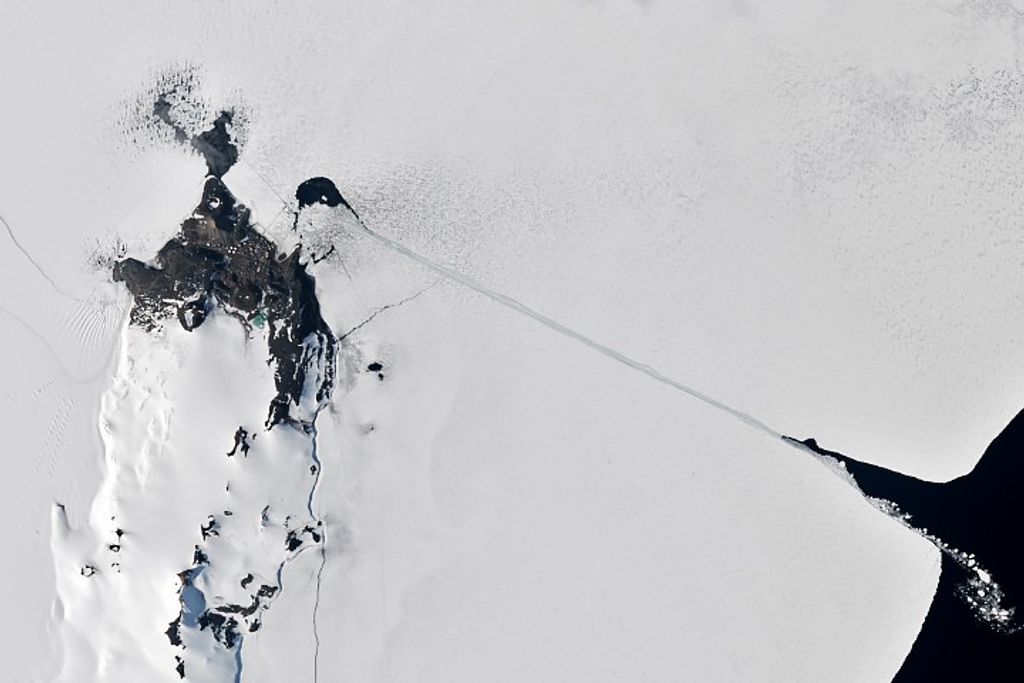
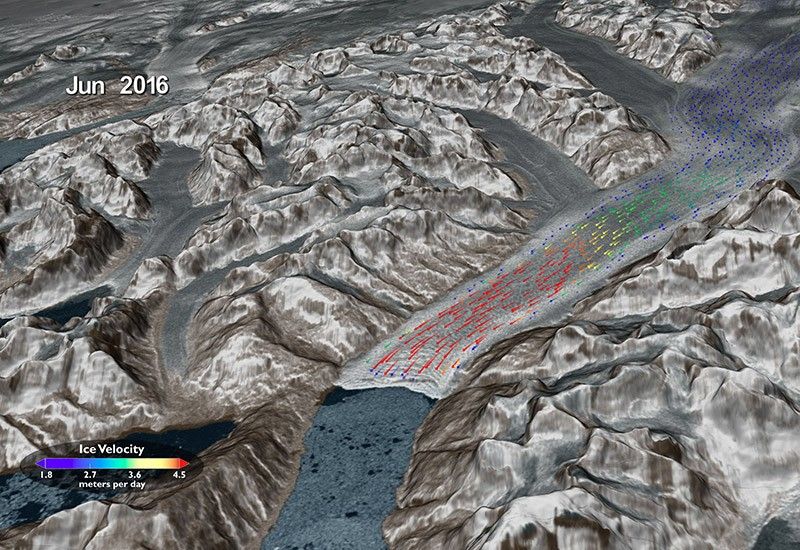
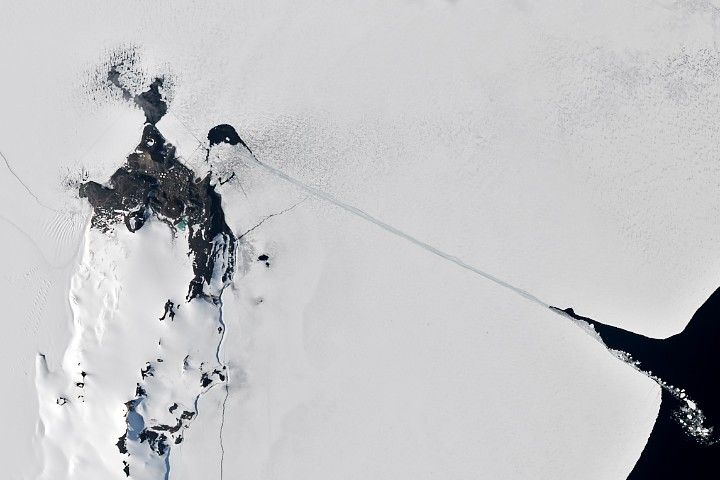
Landsat also helps scientists study water in its frozen form – vast ice sheets in Antarctica, Arctic sea ice, and glaciers worldwide, including in Greenland.
Glaciologists can identify cracks and ridges in the glacier. By tracking them over time, they can see how fast the ice is moving – and get a better handle on the impacts of warming global temperatures on glaciers and on sea level rise.
Congo and Brazil
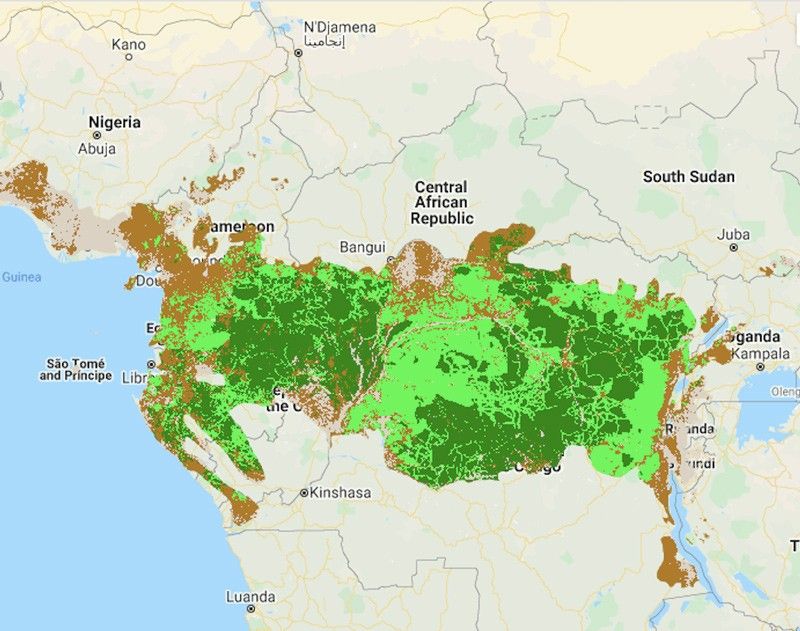
Scientists frequently combine Landsat data with other remote-sensing data, to give us a fuller portrait of Earth’s terrain. Scientists who wanted to map the healthiest tropical forests – showing not just the location of forests but the height of trees, combined Landsat data with observations from a NASA instrument that uses lasers to measure the height of trees.
They’re hoping to use this tool in places like Congo and Brazil to focus conservation efforts on key forests.
Amazon
Since the early days of the Landsat program, researchers and conservation groups have been tracking deforestation in the Amazon. There, they can see changes in the patterns of deforestation – from individual ranchers cutting down and burning smaller parcels of land to graze cattle, to the rise of large-scale industrial ranching and soybean farms.
Colorado
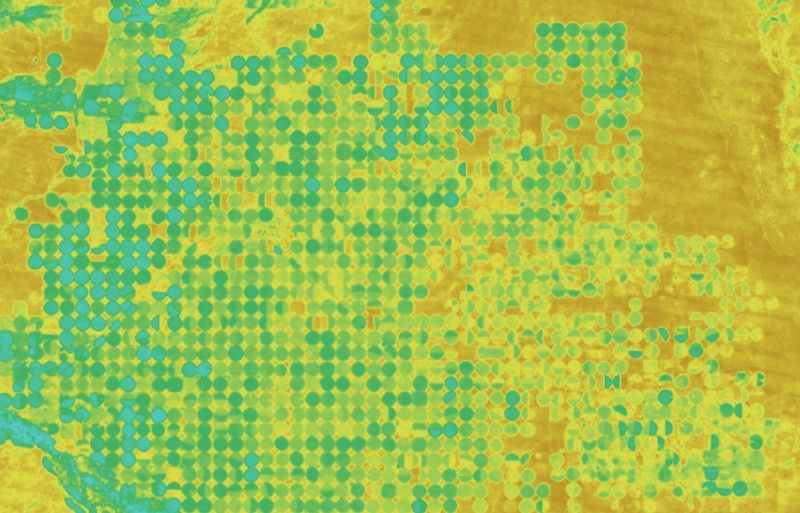
The first Landsat was designed with agricultural monitoring in mind – the size of one Landsat pixel lets us map even small farm fields in the U.S. And farmers and irrigation managers have harnessed the satellite’s data to improve the management of those fields as well.
With a new program called OpenET, they are improving the efficiency of irrigation in a water-parched region by using Landsat data to investigate how much water individual crop fields are soaking up.
The Spacecraft
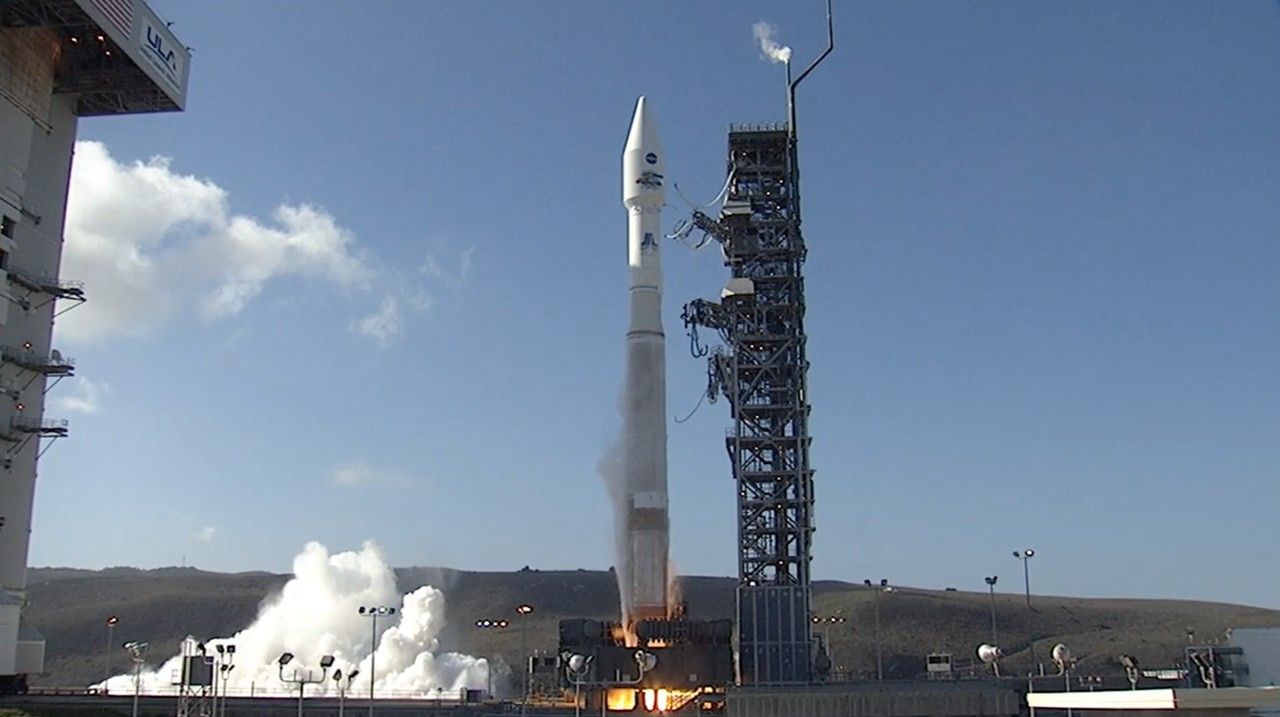
We're launching Landsat 9 from Vandenberg Space Force Base, near the agricultural fields and vineyards of Lompoc, California.
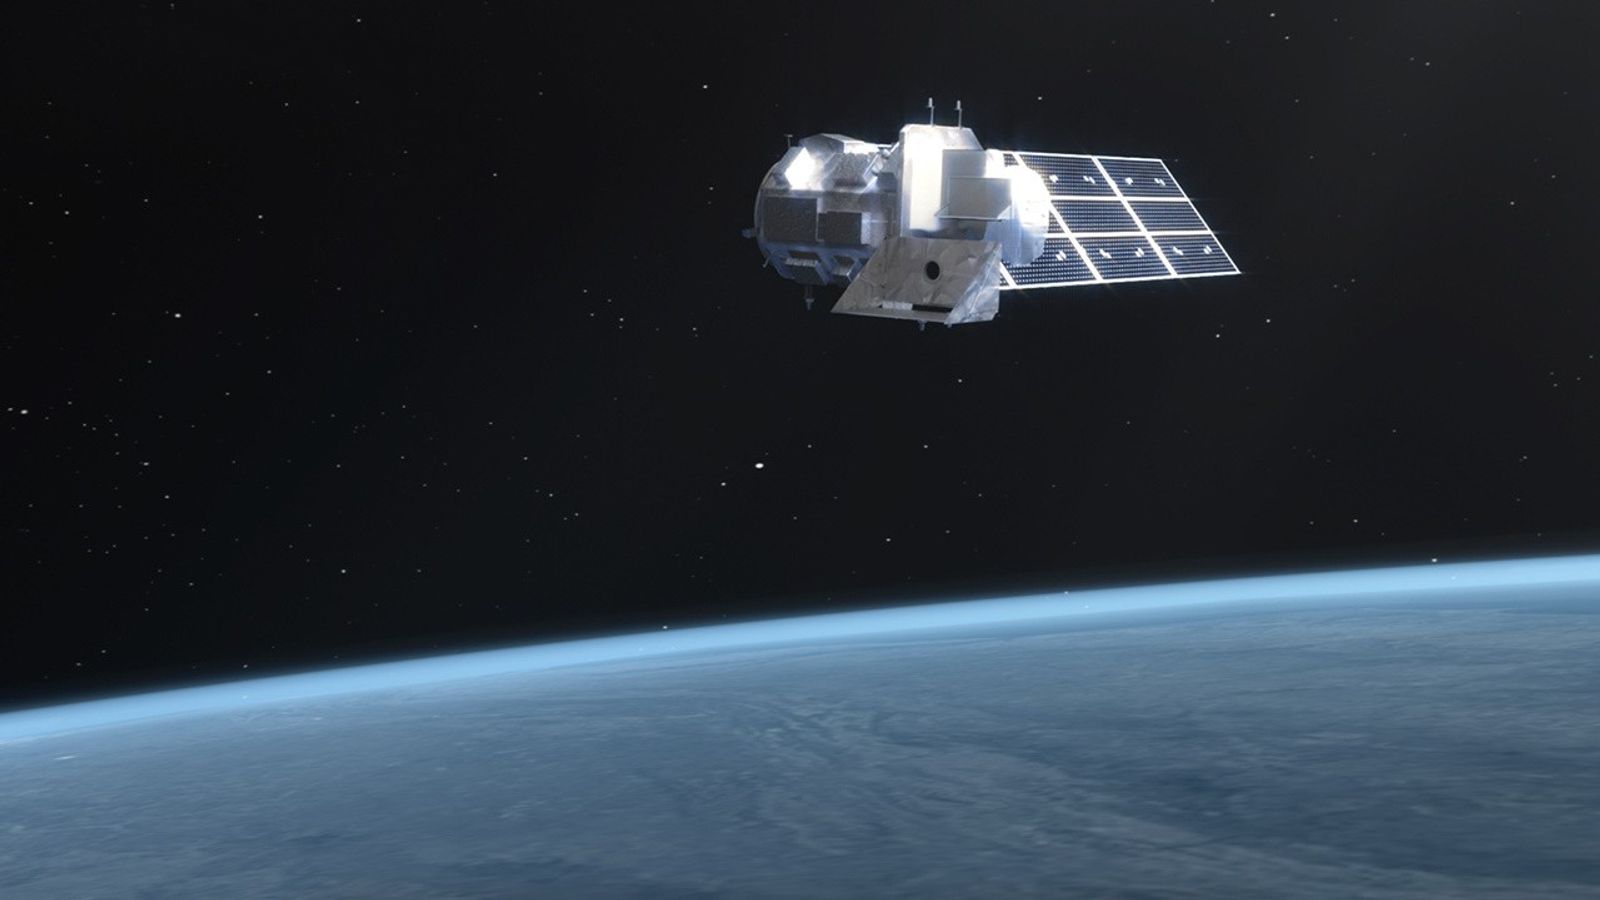
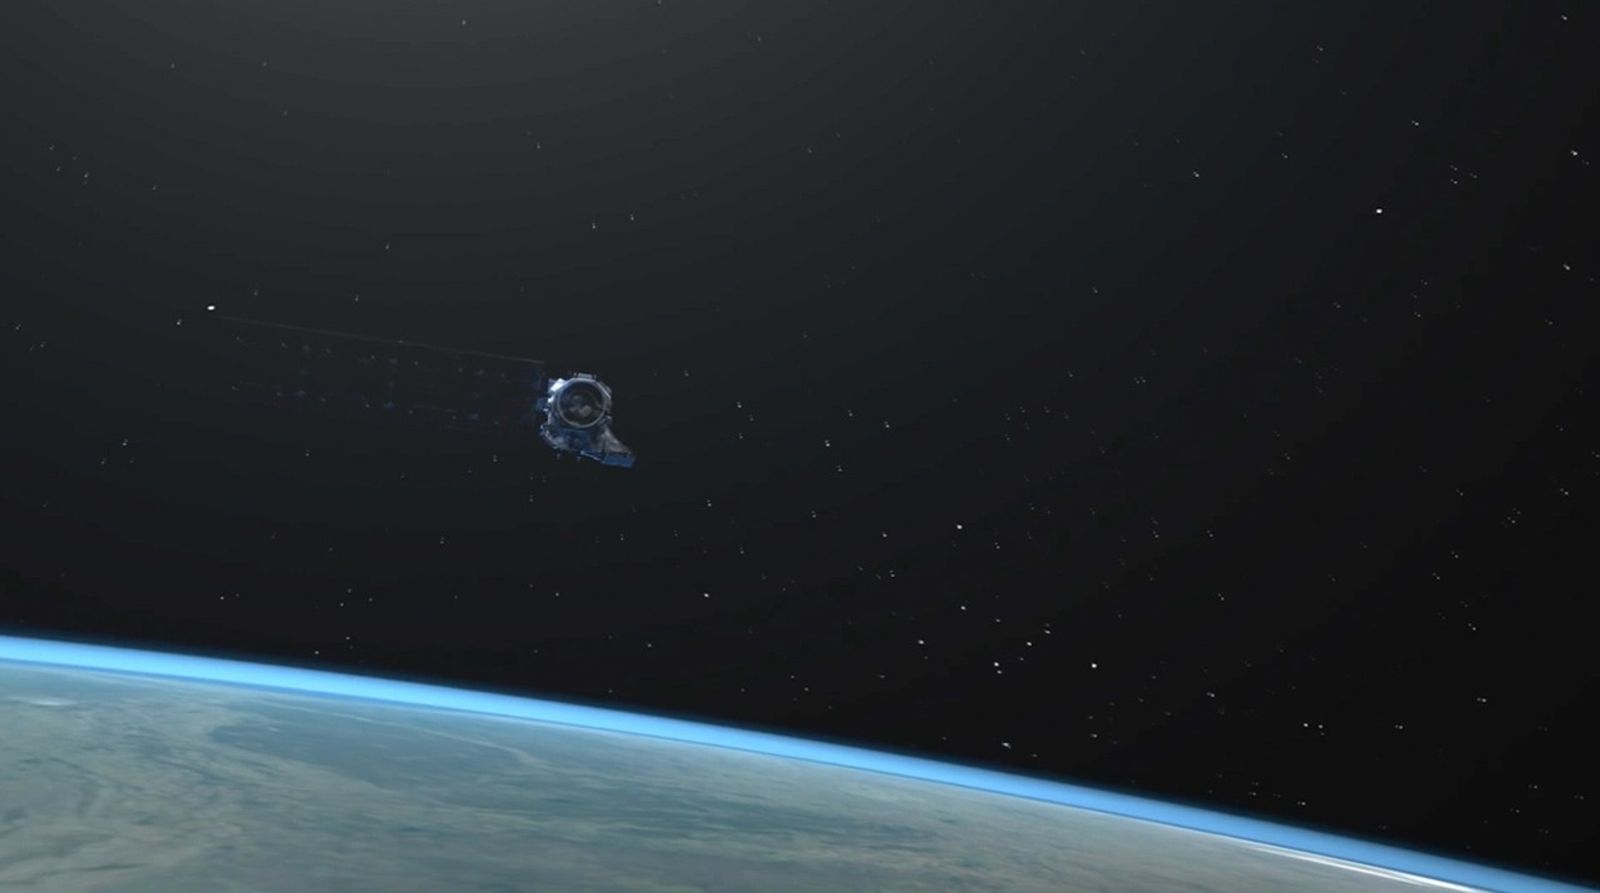
Landsat 9 carries two instruments, similar to those on Landsat 8, to collect invaluable data on Earth below.
- Operational Land Imager 2 (OLI-2)
The Operational Land Imager 2 captures wavelengths of visible light as well as near infrared and shortwave infrared that reflect off Earth. Specific combinations of these wavelengths give us the natural color of a scene, the health of vegetation, the strength of a wildfire, and information beyond what we could see with our eyes. - The Thermal Infrared Sensor 2 measures the amount of heat emitted from Earth’s surface, which allows us to calculate surface temperature. This helps water managers track the health of plants, which cool down when they’re well-watered and growing.
The Landsat spacecraft provides power, navigation, data storage and more to the satellite.
From orbit, the Landsat 9 observatory continues the legacy of 50 years of Earth observations from space. The Landsat mission is the cornerstone of America’s land imaging program and will continue as NASA and USGS develop Landsat Next.

