8 min read

Story by: Kate Ramsayer
Design by: Shannon Forrey and Ellen Gray
Earth’s global sea levels are rising – and are doing so at an accelerating rate. Waters in the ocean are expanding as they absorb massive amounts of heat trapped by greenhouse gases in Earth’s atmosphere. Glaciers and ice sheets are adding hundreds of gigatons of meltwater into the oceans each year. The land surface along the coasts is also creeping up and down, affecting relative sea level rise. People are feeling the impacts, as seemingly small increments of sea level rise become big problems along coastlines worldwide.
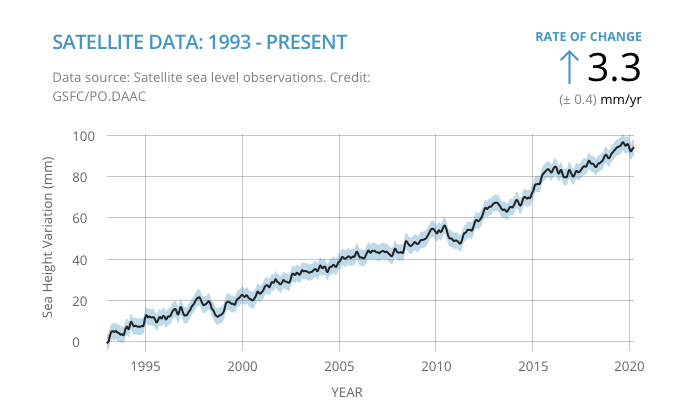
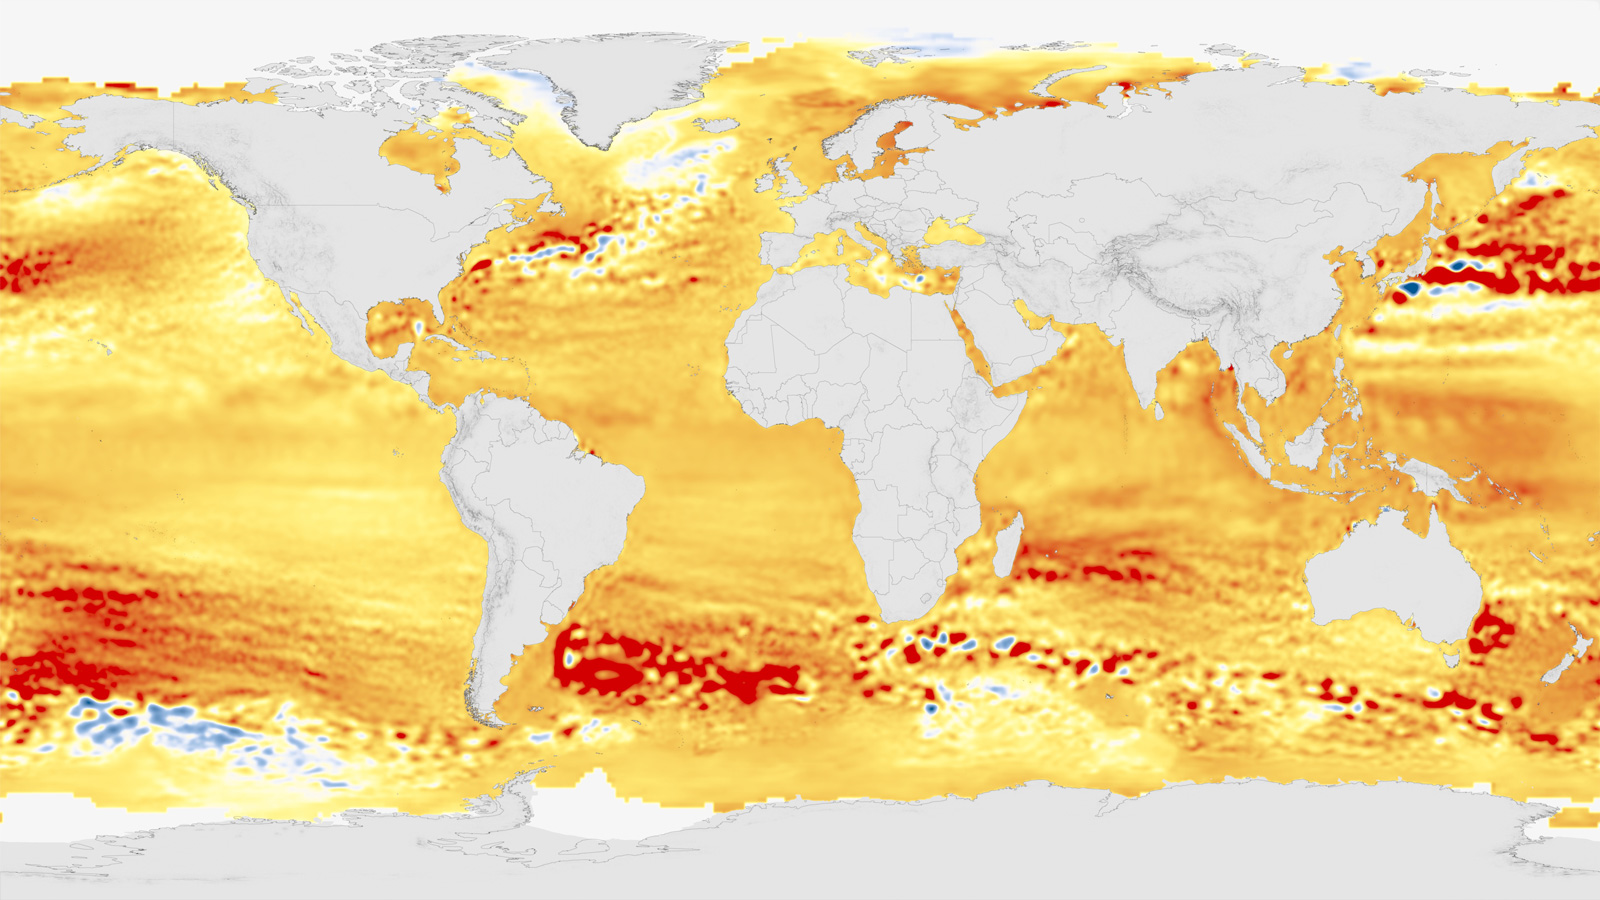
With satellites, airborne missions, shipboard measurements, and supercomputers, NASA has been investigating sea level rise for decades. Together with our international and interagency partners, we’re monitoring the causes of sea level rise with high accuracy and precision. Global sea level is rising approximately 0.13 inches (3.3 millimeters) a year. That’s 30% more than when NASA launched its first satellite mission to measure ocean heights in 1992.

Humanity, not one agency, not one country, not one continent, but . . . humanity has been monitoring global sea level from space with exquisite accuracy for more than 28 years.- Michael Freilich, 1954-2020
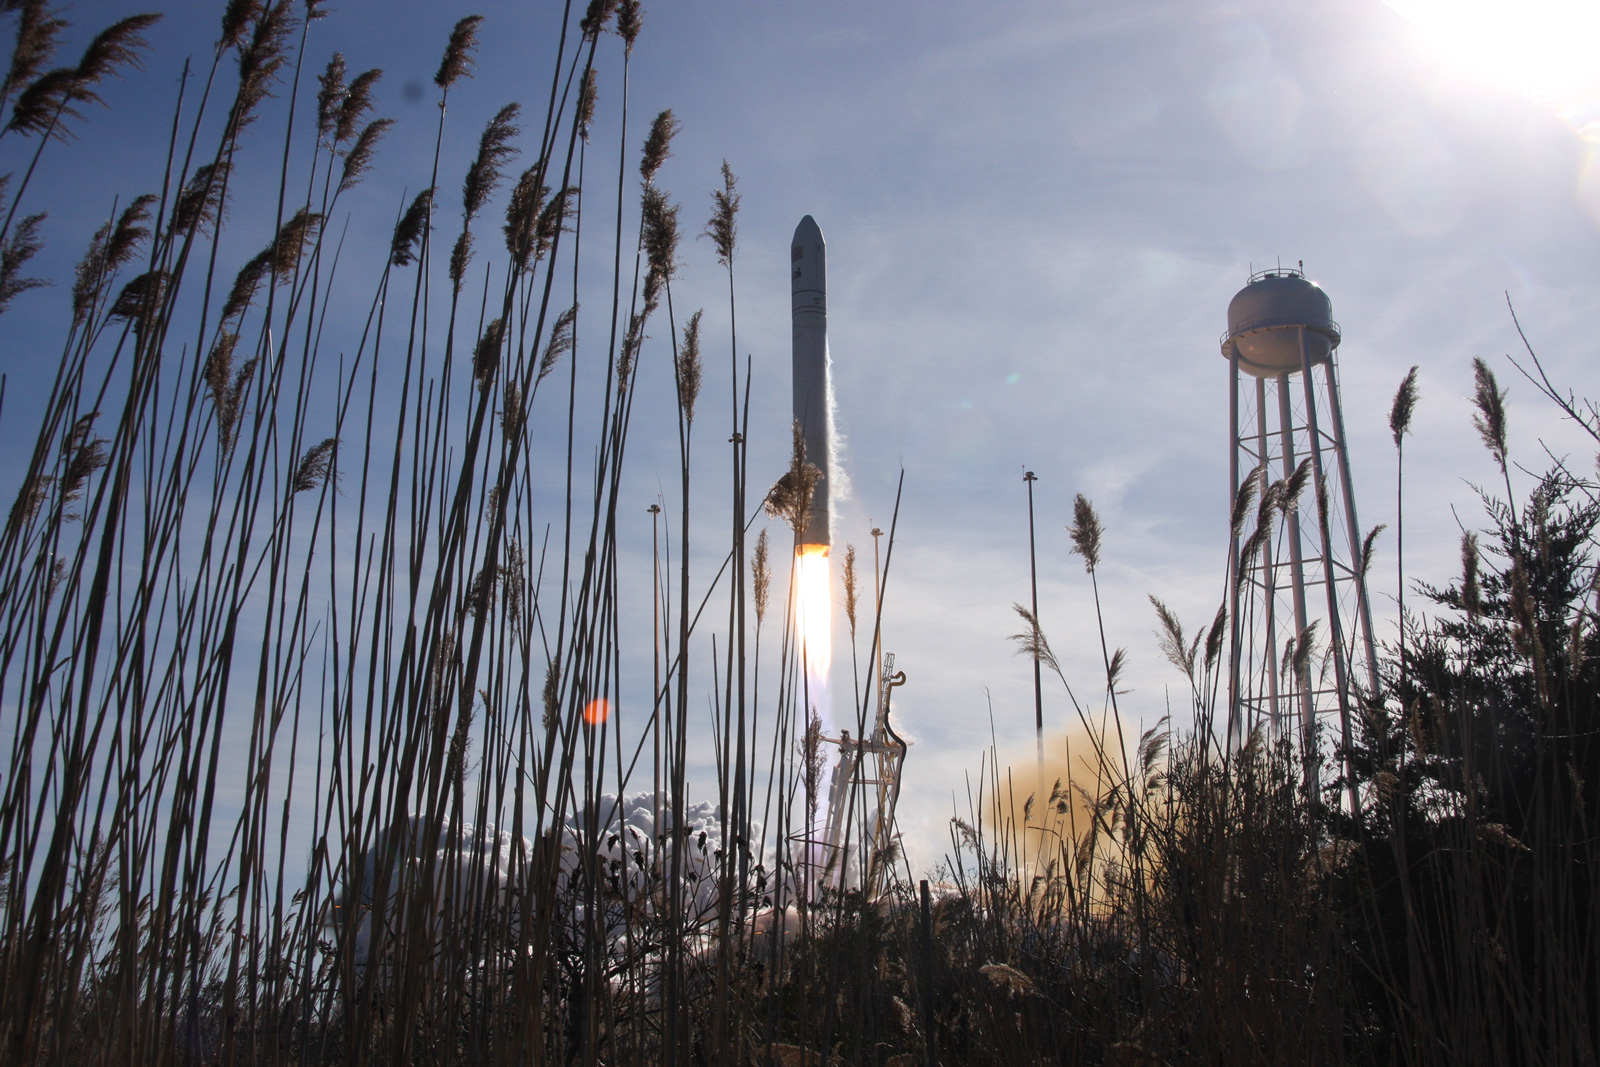
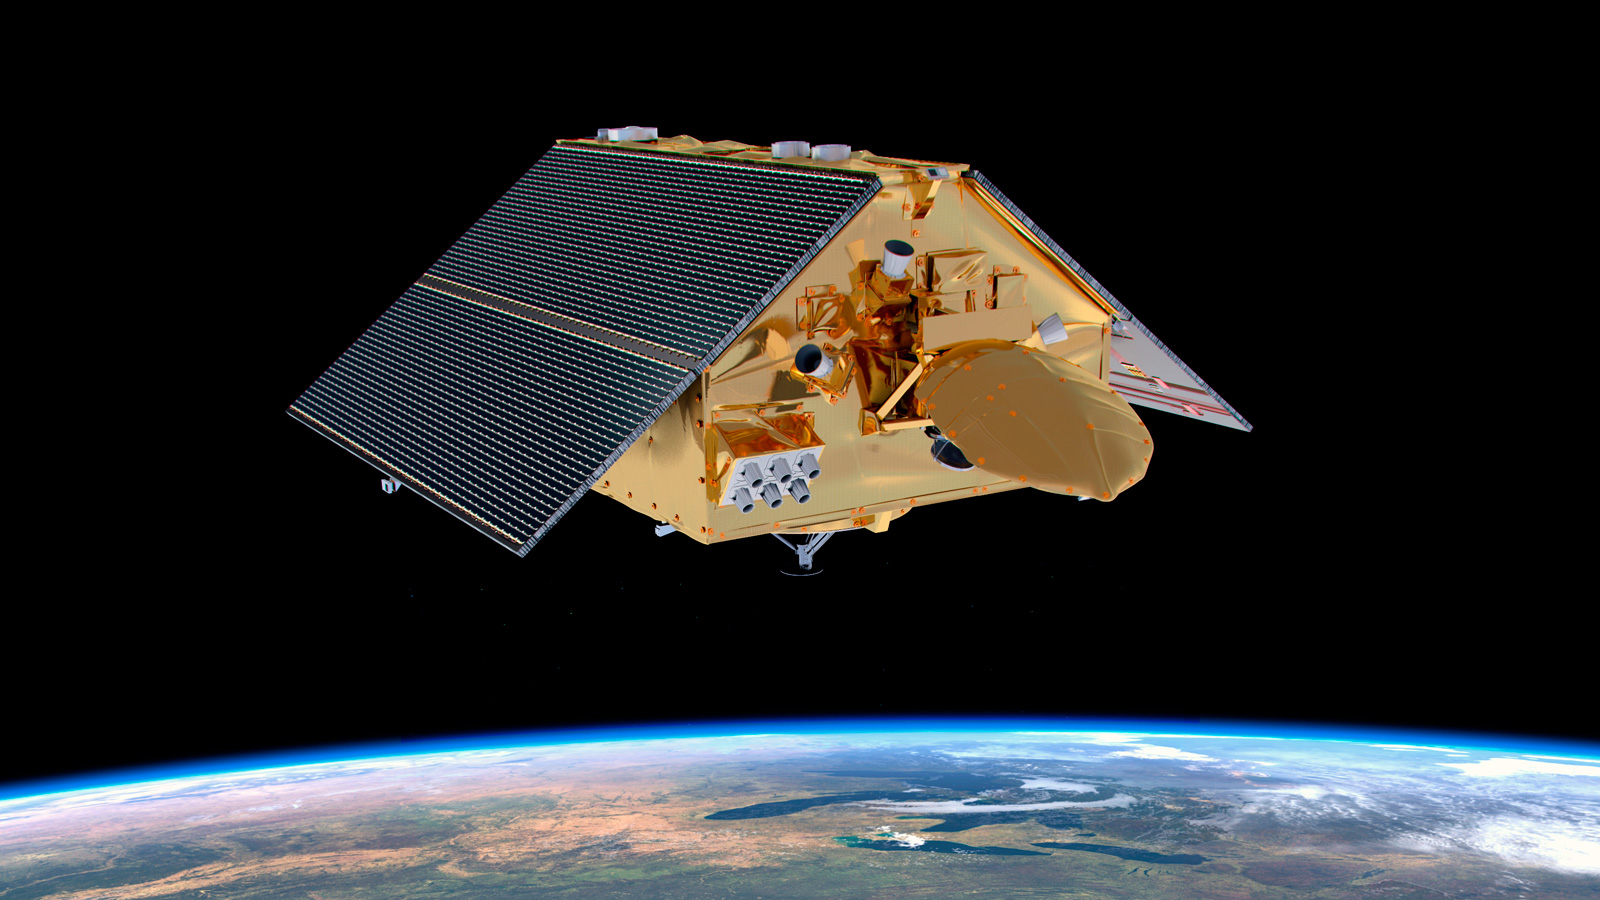
This month, NASA is partnering with the European Space Agency, NOAA and EUMESTAT to launch the Sentinel-6 Michael Freilich satellite, which will continue 28 years of satellite-based ocean height measurements. The satellite was renamed in honor of the late director of NASA’s Earth Science Division, an oceanographer by training who recognized that a complex problem like sea level rise requires people with diverse backgrounds, from across the globe, to solve.
In 2014, NASA created a Sea Level Change Science Team to bring together experts from across the agency and at other institutions that study different aspects of this multidisciplinary problem. Scientists studying glaciers, ice sheets, ocean physics, land movement and more are brought together to tackle what sea level rise looks like now – and what it will look like in the future.
“We’re united by this big goal,” said Nadya Vinogradova Shiffer, the NASA program manager who oversees the team. “Sea level is impacted by these different factors that one discipline doesn’t cover – so we’ve got to bring in experts to approach it from all angles.”
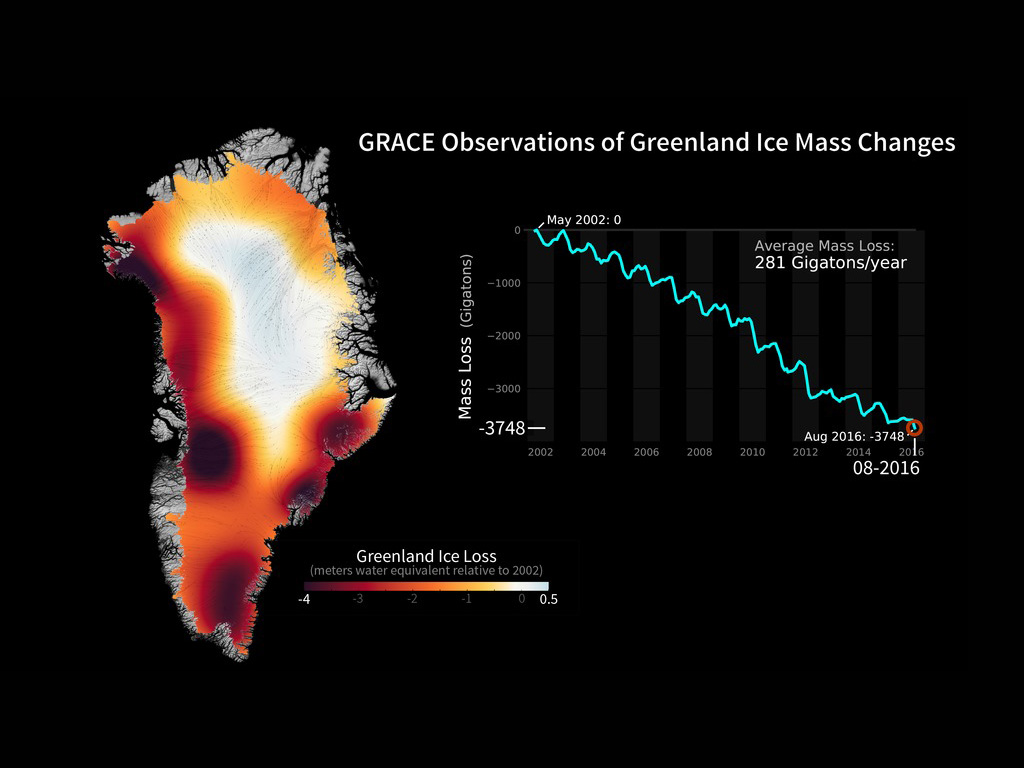
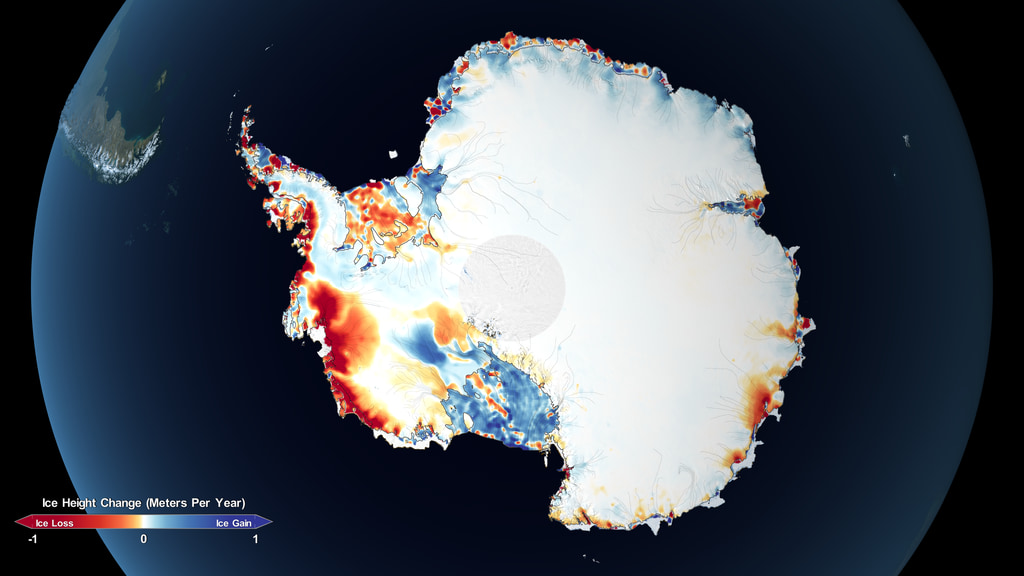
About two-thirds of global sea level rise is due to meltwater from glaciers and ice sheets, the vast expanses of ice that cover Antarctica and Greenland. In Greenland, most of the ice loss stems from warming air temperatures that melt the surface of the ice sheet, as well as calving from the glaciers that empty into the sea. In Antarctica, however, year-round freezing temperatures mean that the surface of the interior ice sheet doesn’t melt. Instead, most of the ice is lost as warmer ocean temperatures join warm air temperatures to eat away at the floating ice shelves at the ends of glaciers in West Antarctica. This causes the glaciers to speed up, and more ice to flow – and melt – into the sea.
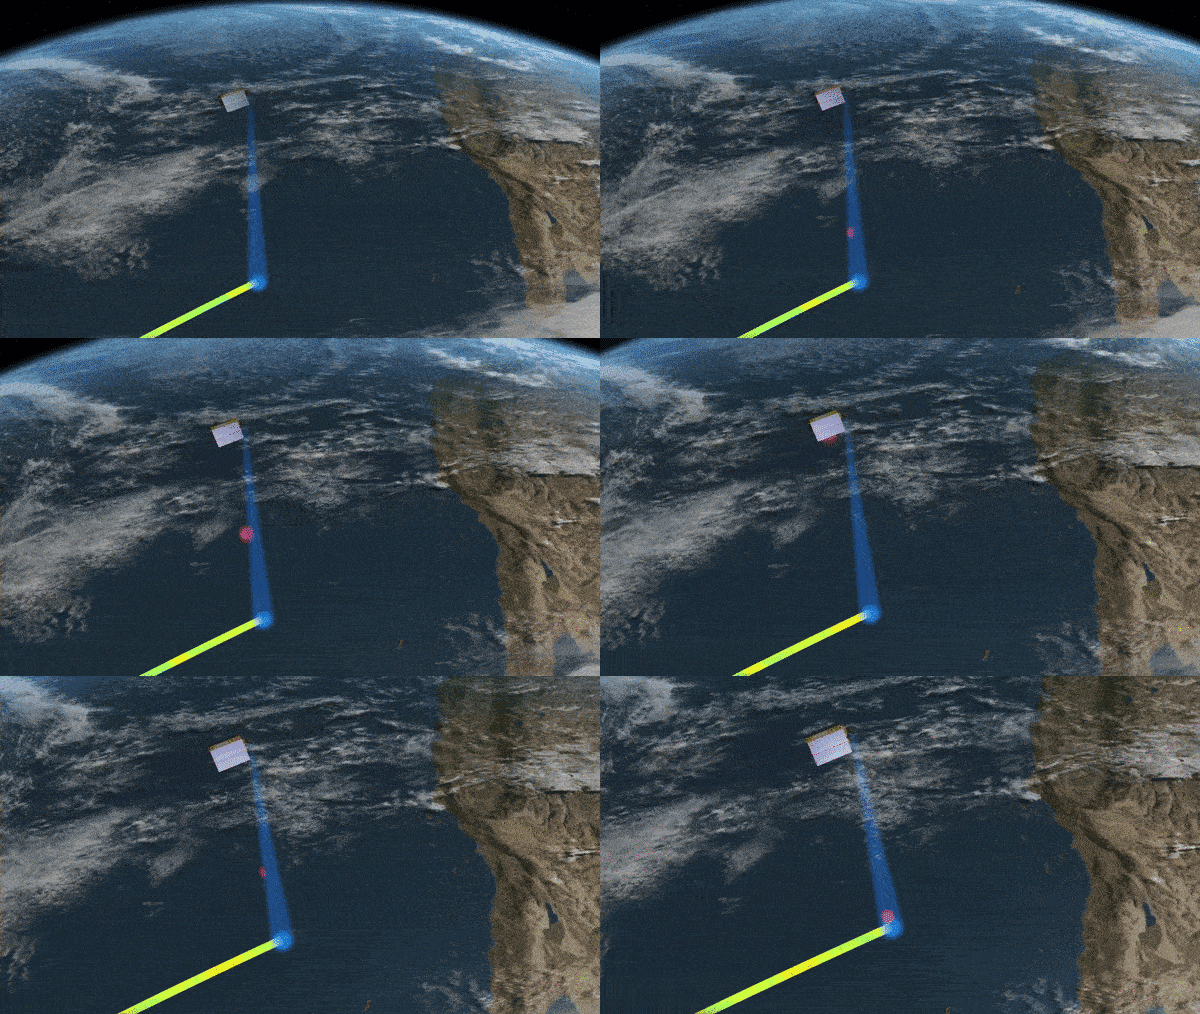
NASA measures this change from space. With the Ice, Cloud and land Elevation Satellite 2, or ICESat-2, scientists can calculate the change in height of the ice sheets to within a fraction of an inch, allowing them to calculate how changing ice sheets are contributing to sea level rise. With the Gravity Recovery and Climate Experiment Follow-On satellites, or GRACE-FO, a partnership with the German Research Centre for Geosciences, scientists can calculate the mass of ice lost from these vast expanses across Greenland and Antarctica.
The ice sheets alone contributed around 1.2 millimeters per year to sea level rise between 2002 and 2017, scientists calculated by comparing data from the GRACE and GRACE-FO satellites.
Since 2006, an average of 318 gigatons of ice per year has melted from Greenland and Antarctica’s ice sheets, scientists calculated by comparing data from the first ICESat and ICESat-2.
One gigaton is enough to cover New York City’s Central Park in ice 1,000 feet deep.
Glaciers in places like Alaska, High Mountain Asia, South America and the Canadian Arctic are susceptible to warming air temperatures. Over the last decade, nearly all glaciers have been shrinking. Whether the glaciers empty directly into the ocean, or into rivers that eventually reach the sea, the meltwater from these smaller glaciers contributes about as much to sea level rise as the meltwater from massive ice sheets contributes.
Not only is more water flowing into the ocean from ice sheets and glaciers – the warmer water of the ocean is taking up more space, adding to sea level rise. The upper 2,300 feet (700 meters) of the ocean has been warming since the 1970s – and much of the extra heat generated by global warming is absorbed by the ocean. When water warms, individual molecules move around faster, expanding the volume that they take up. On a global scale, this causes about a third of the sea level rise that scientists have measured.
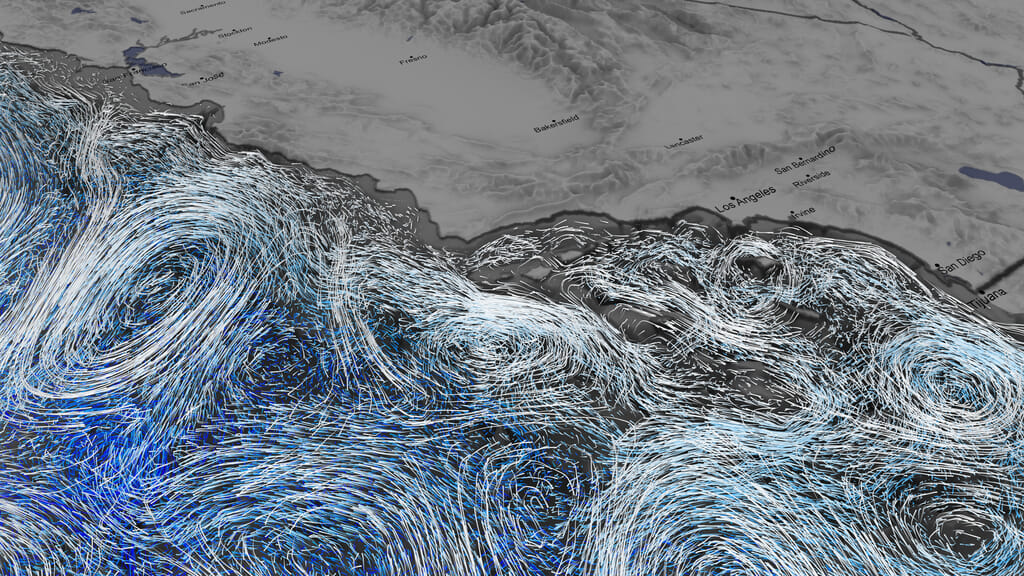
Like all sea level change, thermal expansion varies across the oceans – some regions are more affected than others. Currents and winds move this newly warmed and expansive water around, and that warmer water influences the strengths and patterns of ocean currents. Instruments like the Argo floats from Scripps Institution of Oceanography in San Diego collect temperature and other data on the ocean waters.
Sea level rise isn’t consistent across the globe. Some coastal areas see triple the average rate of rise while others don’t observe any changes, or can even see a drop in sea level. Ocean currents, the upwelling of cold water from the deep ocean, winds, movements of heat and freshwater, and Earth’s gravitational pull all play a role in moving water masses around. When water melts from Greenland, for example, the drop in mass decreases the gravitational pull from the ice sheet, causing water to slosh toward the shores of South America. Warmer waters can speed up currents, and even tilt the surface of the ocean – changes that will be measured by the upcoming Surface Water and Ocean Topography satellite mission, developed by NASA and international partners.
Naturally occurring ocean climate cycles can also play a role in temporarily masking or enhancing the effects of climate change on sea level rise. During most of the time that satellites have been measuring global sea surface height, sea level rise along the West Coast of the United States has been lower than the global average due to extended cool phases of the Pacific Decadal Oscillation (PDO), a long-term cyclical pattern of climate variability in the Pacific Ocean that affects ocean and atmospheric conditions. The cool PDO phase pushed warm water away from the U.S. West Coast, suppressing sea level rise. But around 2010-2011, the PDO shifted to its warm phase, and scientists are now observing faster-than-average sea level rise for the region, which is expected to continue for at least the next five years and potentially much longer.
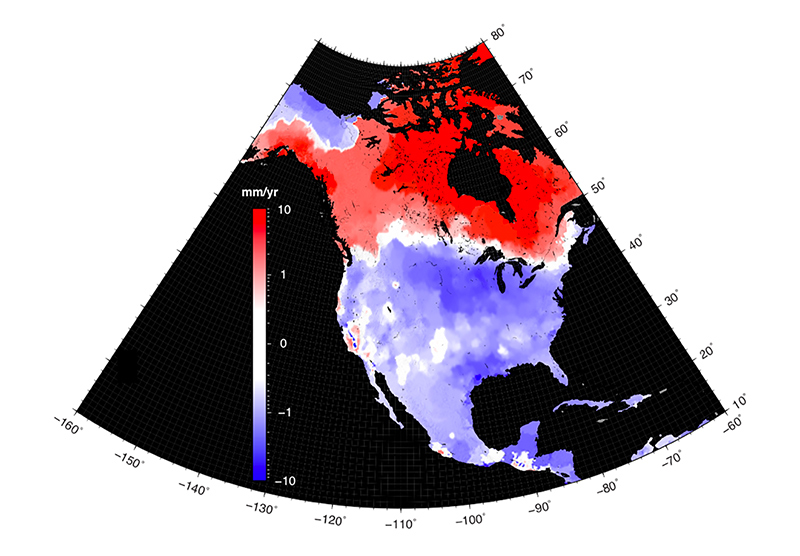
It’s not only water processes that play a role in global sea level rise – ground movements can play a significant role as well. On a continental scale, Earth’s crust is still recovering from the last ice age. 20,000 years ago, Canada, the northeast United States, Scandinavia and other regions were weighed down by ice sheets. As the ice sheets melted, and the weight on the continents eased, the land surface slowly rebounded. That rebounding process is still occurring and can even cause other places to drop – for example, Norfolk, Virginia is sinking due to rebounding further north.
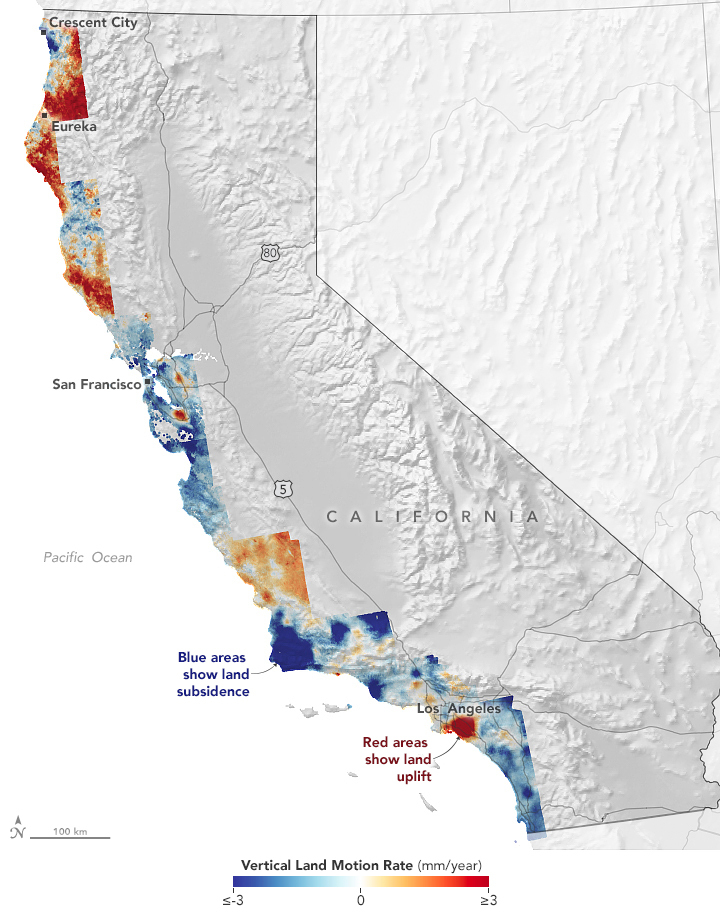
Rising sea levels can also be compounded by sinking land. The Mississippi River Delta, for example, is essentially drowning as sinking ground from resource extraction, sediment loading, and the weight of the built environment is combined with higher sea levels. NASA will be studying this case with a field campaign called Delta-X, designed to study how sediments are accumulating on the delta.
As scientists from a range of disciplines study the causes of sea level rise, their colleagues are also using advanced climate, ocean, and ice computer models to predict what sea level rise will look like in the future. A NASA-led study brought together scientists from across the globe to determine how meltwater from ice sheets will impact sea level rise by 2100. Other recent work has examined how ice loss in one region impacts cities around the globe, and how glaciers in High Mountain Asia will respond in the coming century due to a warming climate. The future of sea level rise is a fast-moving global problem, so scientists need the most comprehensive and accurate models possible.
NASA’s Sea Level Change team is tasked with coming up with its own predictions for sea level rise on multiple time horizons, from decadal to centennial time scales, said lead Vinogradova Shiffer – a challenging task, given all the contributing and complicating factors. But the team is designed to approach the problem from all angles.
“We’ve assembled a team of leading experts in the field, covering all the ground related to sea level rise, and we’re excited about finding the best answer to these questions,” she said. “You can’t not do it together."


