Suggested Searches

3 Min Read

April’s Night Sky Notes: Catch the Waves!

A side-by-side comparison of a Spitzer infrared image of Herbig-Haro 49/50 (left) versus a Webb infrared image of the same object. The Spitzer image show the Herbig-Haro object as a conical feature, tornado-like in appearance, appearing from the upper left to the lower right in shades of blue, green, and yellow. The background is punctuated with white small galaxies. A round nebulosity with a blue core and reddish halo appears at the tip of the cone. The Webb view, dominated with shades of orange-red colors in the conical feature, reveals a detailed spiral galaxy with a concentrated blue center that fades outwards to blend in with red spiral arms.  The black background speckled with some white stars and smaller, fainter, and more detailed white galaxies.
This side-by-side comparison shows a Spitzer Space Telescope Infrared Array Camera image of HH 49/50 (left) versus a Webb image of the same object (right) using the NIRCam (Near-infrared Camera) instrument and MIRI (Mid-infrared Instrument). The Webb image shows intricate details of the heated gas and dust as the protostellar jet slams into the material. Webb also resolves the “fuzzy” object located at the tip of the outflow into a distant spiral galaxy. The Spitzer image shows 3.6-micron light in blue, the 4.5-micron in green, and the 8.0-micron in red (IRAC1, IRAC2, IRAC4). In the Webb image, blue represents light at 2.0-microns (F200W), cyan represents light at 3.3-microns (F335M), green is 4.4-microns (F444W), orange is 4.7-microns (F470N), and red is 7.7-microns (F770W).
Credits: NASA, ESA, CSA, STScI, NASA-JPL, SSC

by Kat Troche of the Astronomical Society of the Pacific

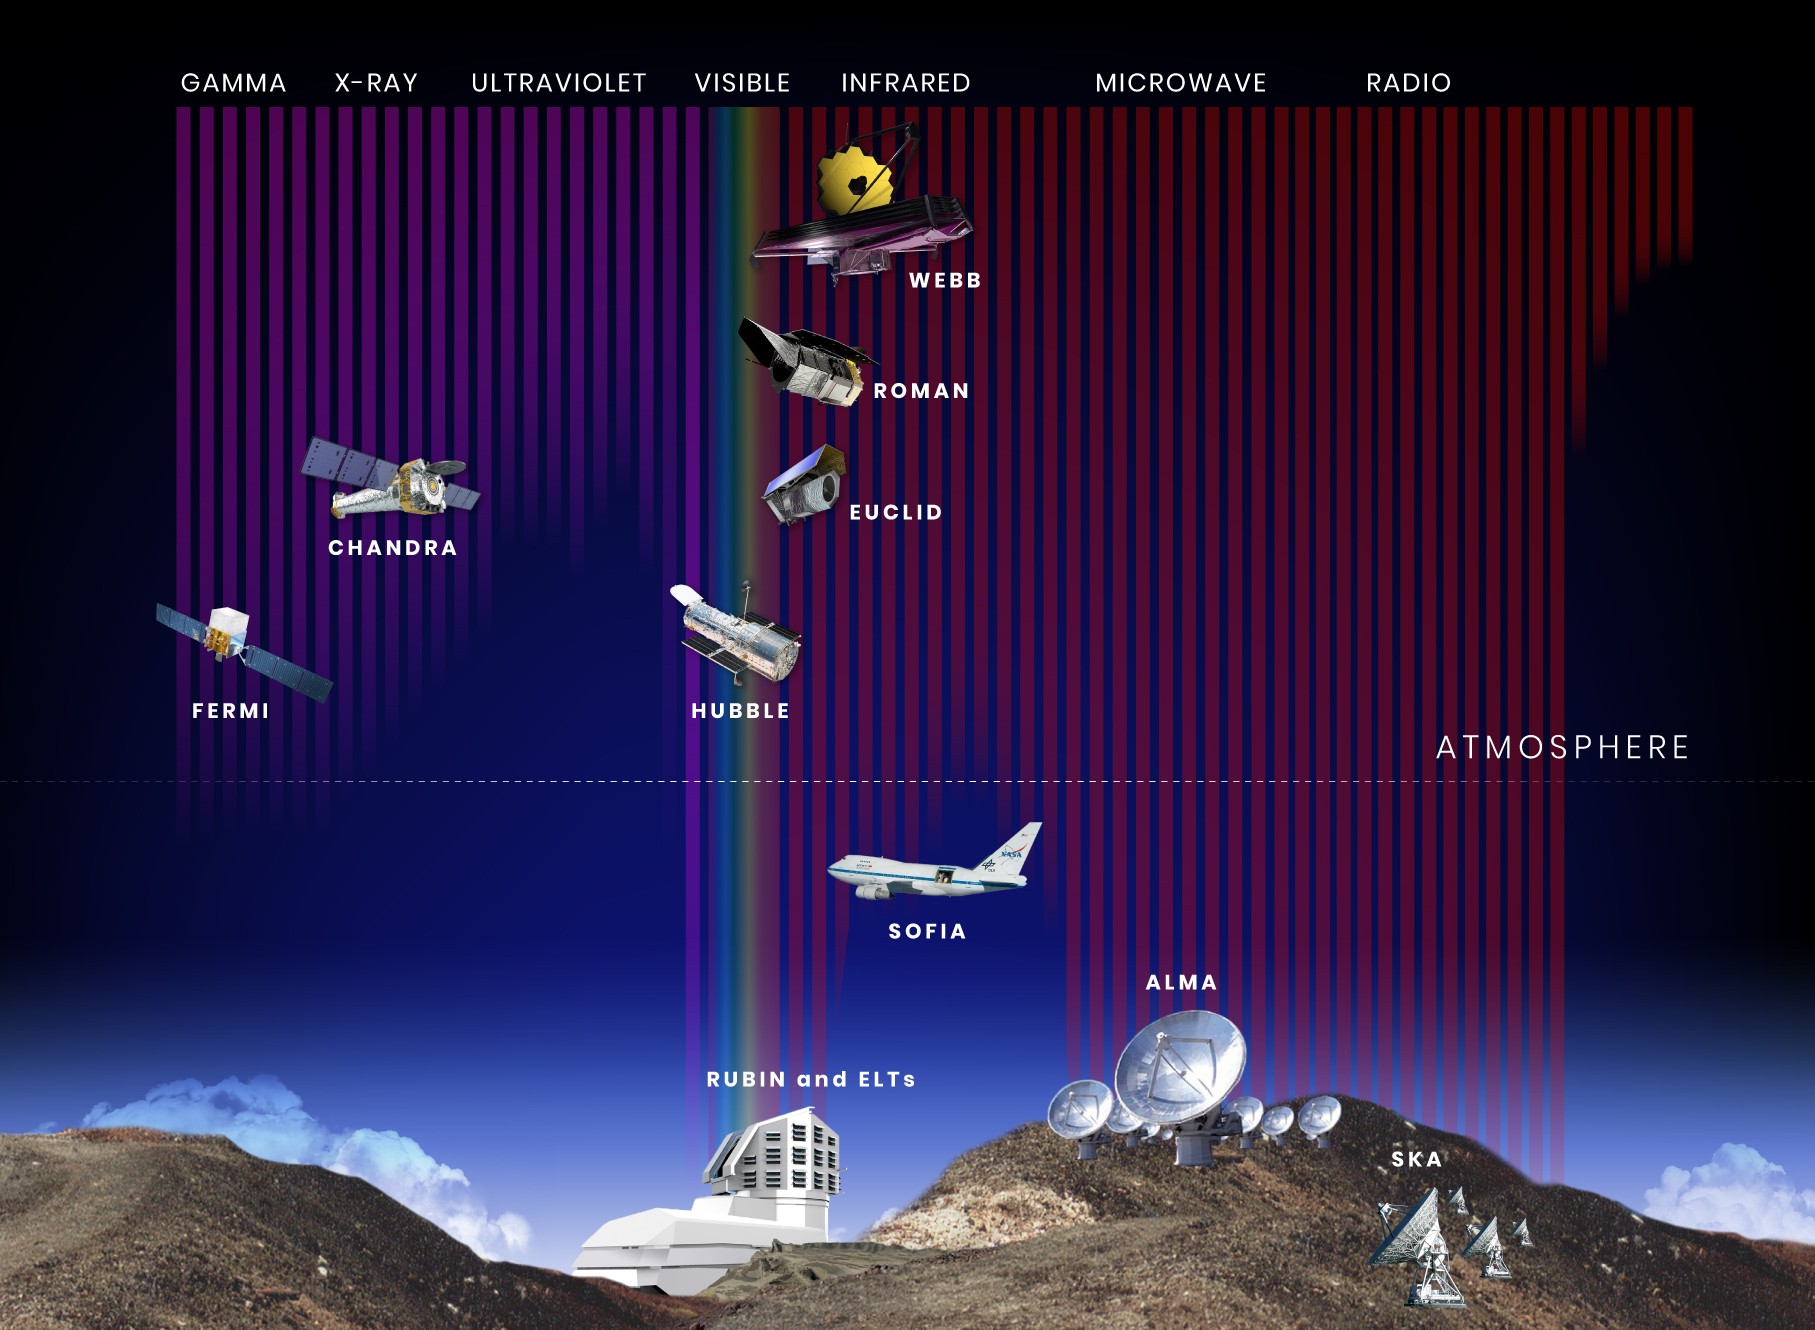
The Electromagnetic Spectrum

If you’ve ever heard the term “radio waves,” used a microwave or a television remote, or had an X-ray, you have experienced a broad range of the electromagnetic spectrum! But what is the electromagnetic spectrum? According to Merriam-Webster, this spectrum is “the entire range of wavelengths or frequencies of electromagnetic radiation extending from gamma rays to the longest radio waves and including visible light.” But what does that mean? Scientists think of the entire electromagnetic spectrum as many types of light, only some that we can see with our eyes. We can detect others with our bodies, like infrared light, which we feel as heat, and ultraviolet light, which can give us sunburns. Astronomers have created many detectors that can "see" in the full spectrum of wavelengths. 

Illustration of mountains, clouds, sky, and space, with ten  observatories arranged vertically by altitude and horizontally by wavelength range: Fermi: space-based, gamma. Chandra: space-based, X-ray. Hubble: space-based, visible. Rubin and E L T’s: ground-based, visible to infrared. Euclid, Roman, and Webb: space-based, infrared. Sofia: airplane, infrared. ALMA: ground-based, microwave. SKA: ground-based, radio.
Planets, stars, galaxies, and other objects in space give off a wide range of visible and invisible forms of light. Because different forms of light have different characteristics, no single observatory can detect all wavelengths. Astronomers typically rely on data from multiple ground- and space-based telescopes to fully understand the objects and phenomena they are studying. This illustration shows the wavelength sensitivity of a number of current and future space- and ground-based observatories, along with their position relative to the ground and to Earth’s atmosphere. The wavelength bands are arranged from shortest (gamma rays) to longest (radio waves). The vertical color bars show the relative penetration of each band of light through Earth’s atmosphere.
NASA, STScI

Telescope Types

While multiple types of telescopes operate across the electromagnetic spectrum, here are some of the largest, based on the wavelength they primarily work in:

  • Radio: probably the most famous radio telescope observatory would be the Very Large Array (VLA) in Socorro County, New Mexico. This set of 25-meter radio telescopes was featured in the 1997 movie Contact. Astronomers use these telescopes to observe protoplanetary disks and black holes. Another famous set of radio telescopes would be the Atacama Large Millimeter Array (ALMA) located in the Atacama Desert in Chile. ALMA was one of eight radio observatories that helped produce the first image of supermassive black holes at the center of M87 and Sagittarius A* at the center of our galaxy. Radio telescopes have also been used to study the microwave portion of the electromagnetic spectrum.
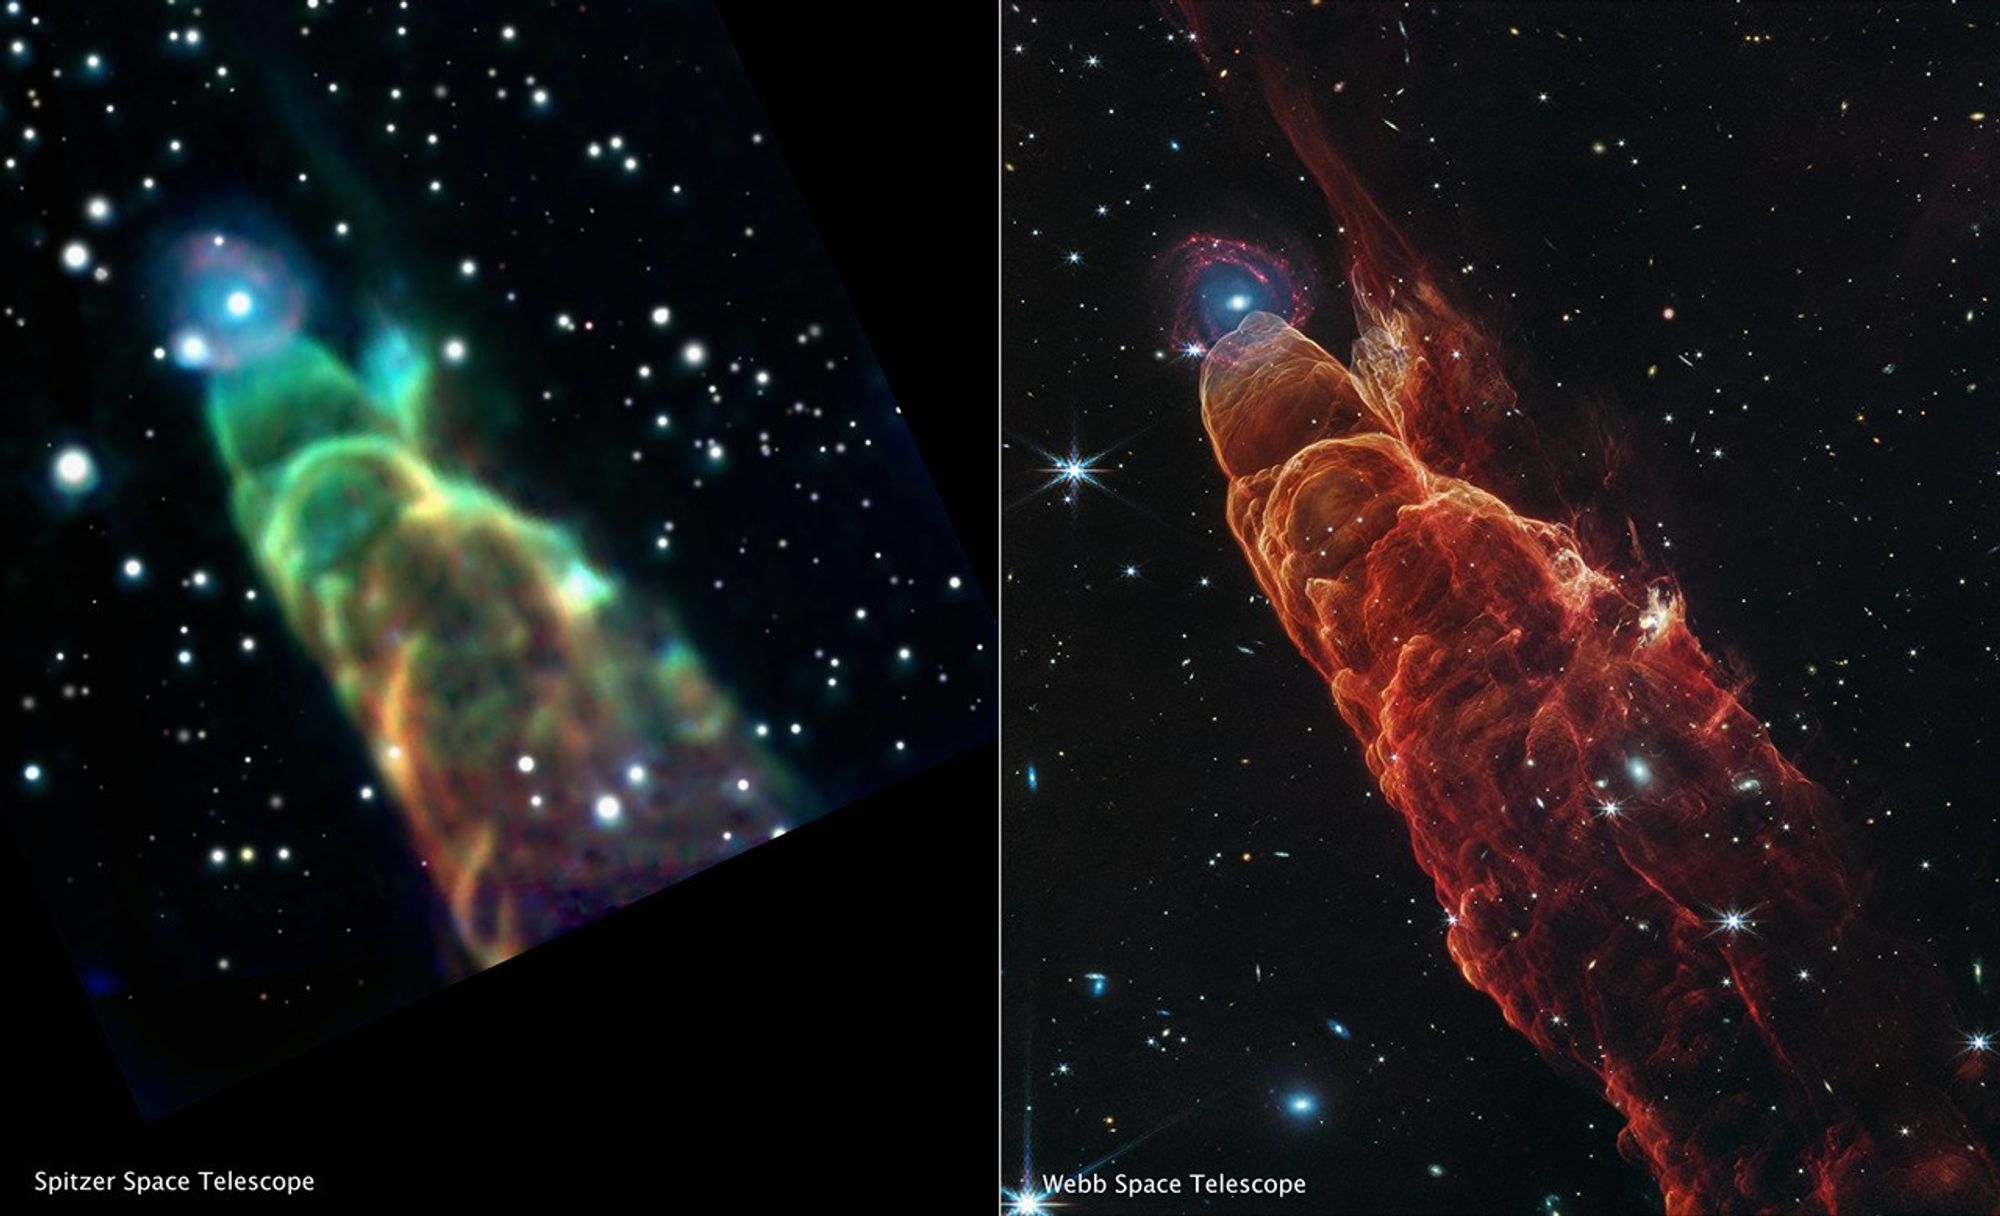
  • Infrared: The James Webb Space Telescope (JWST) operates in the infrared, allowing astronomers to see some of the earliest galaxies formed nearly 300 million years after the Big Bang. Infrared light allows astronomers to study galaxies and nebulae, which dense dust clouds would otherwise obscure. An excellent example is the Pillars of Creation located in the Eagle Nebula. With the side-by-side image comparison below, you can see the differences between what JWST and the Hubble Space Telescope (HST) were able to capture with their respective instruments.
Comparison of Pillars of Creation. Hubble’s visible-light view, left, shows darker pillars rising from the bottom to the top, ending in three points. Webb’s near-infrared image, right, shows the pillars, but they are semi-opaque and rusty red-colored.
NASA's Hubble Space Telescope made the Pillars of Creation famous with its first image in 1995, but revisited the scene in 2014 to reveal a sharper, wider view in visible light, shown above at left. A new, near-infrared-light view from NASA’s James Webb Space Telescope, at right, helps us peer through more of the dust in this star-forming region. The thick, dusty brown pillars are no longer as opaque and many more red stars that are still forming come into view.
Credits: NASA, ESA, CSA, STScI; Joseph DePasquale (STScI), Anton M. Koekemoer (STScI), Alyssa Pagan (STScI).
  • Visible: While it does have some near-infrared and ultraviolet capabilities, the Hubble Space Telescope (HST) has primarily operated in the visible light spectrum for the last 35 years. With over 1.6 million observations made, HST has played an integral role in how we view the universe. Review Hubble’s Highlights here.
Compass and Scale Image for Crab Nebula
The Crab Nebula, located in the Taurus constellation, is the result of a bright supernova explosion in the year 1054, 6,500 light-years from Earth.
Credit: X-ray: NASA/CXC/SAO; Optical: NASA/STScI; Infrared: NASA/JPL/Caltech; Radio: NSF/NRAO/VLA; Ultraviolet: ESA/XMM-Newton
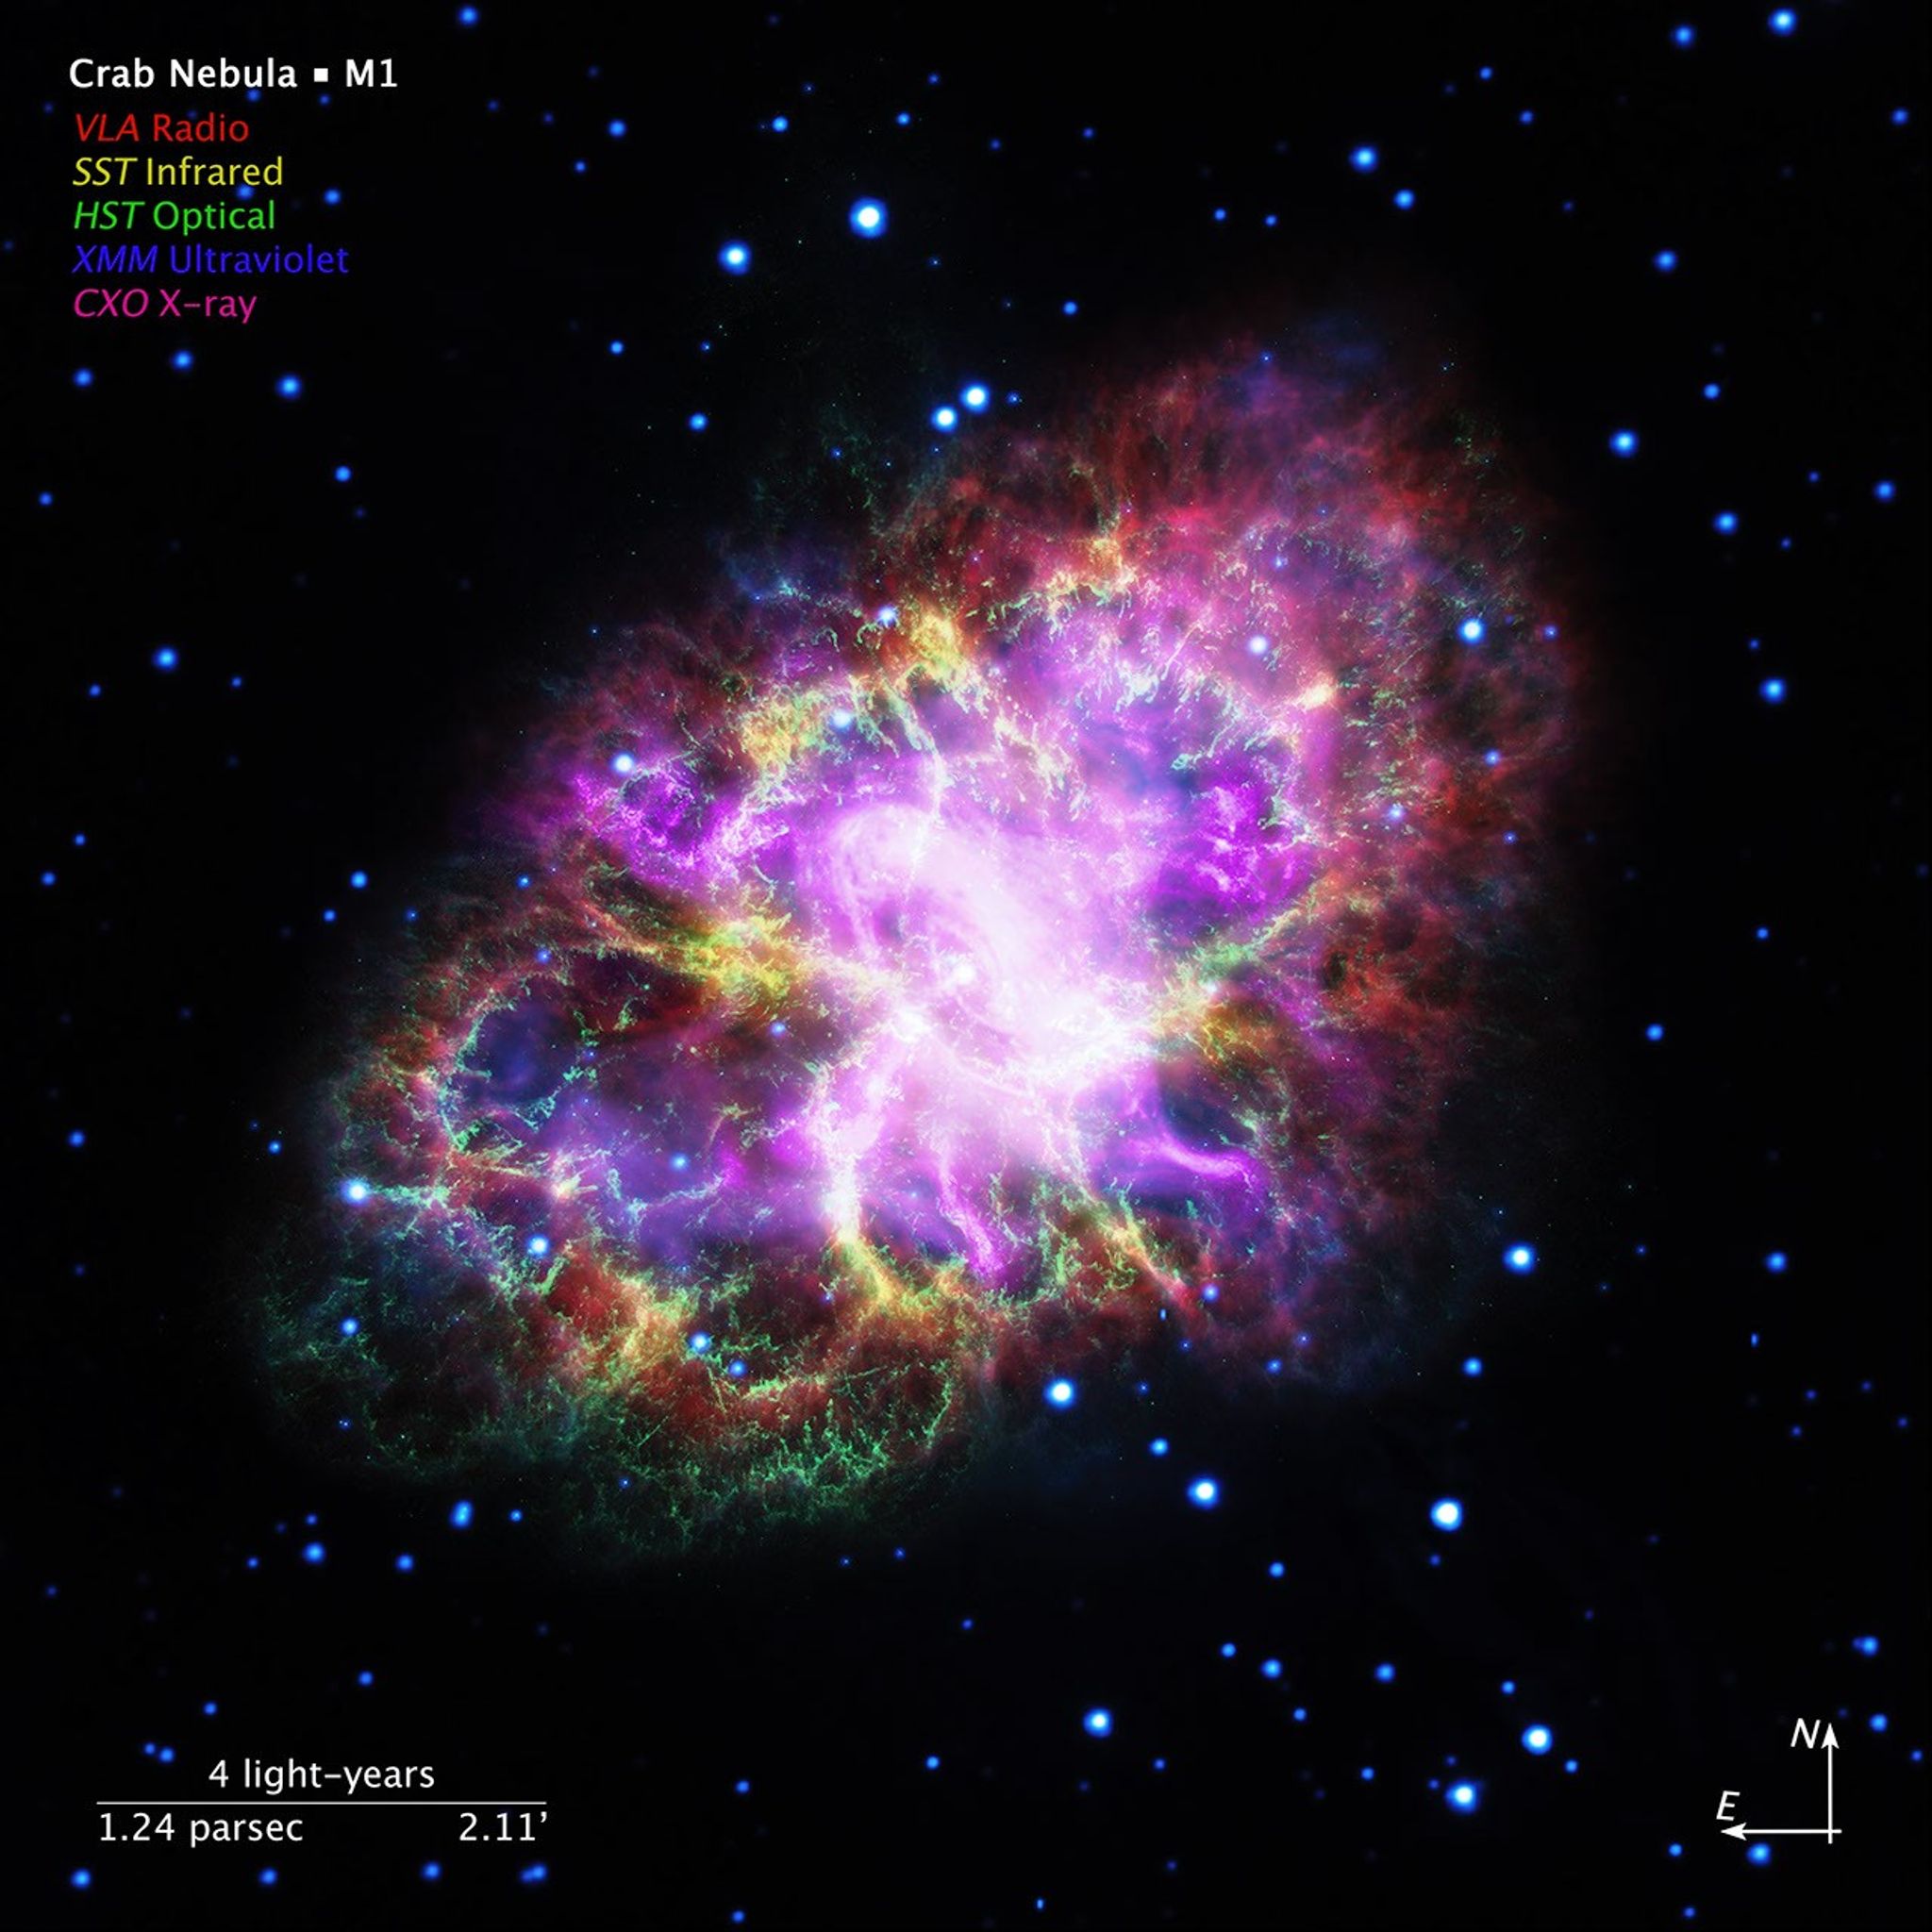
  • X-ray: Chandra X-ray Observatory was designed to detect emissions from the hottest parts of our universe, like exploding stars. X-rays help us better understand the composition of deep space objects, highlighting areas unseen by visible light and infrared telescopes. This image of the Crab Nebula combines data from five different telescopes: The VLA (radio) in red; Spitzer Space Telescope (infrared) in yellow; Hubble Space Telescope (visible) in green; XMM-Newton (ultraviolet) in blue; and Chandra X-ray Observatory (X-ray) in purple. You can view the breakdown of this multiwavelength image here.

Try This At Home

Even though we can’t see these other wavelengths with our eyes, learn how to create multiwavelength images with the Cosmic Coloring Compositor activity and explore how astronomers use representational color to show light that our eyes cannot see with our Clues to the Cosmos activity.