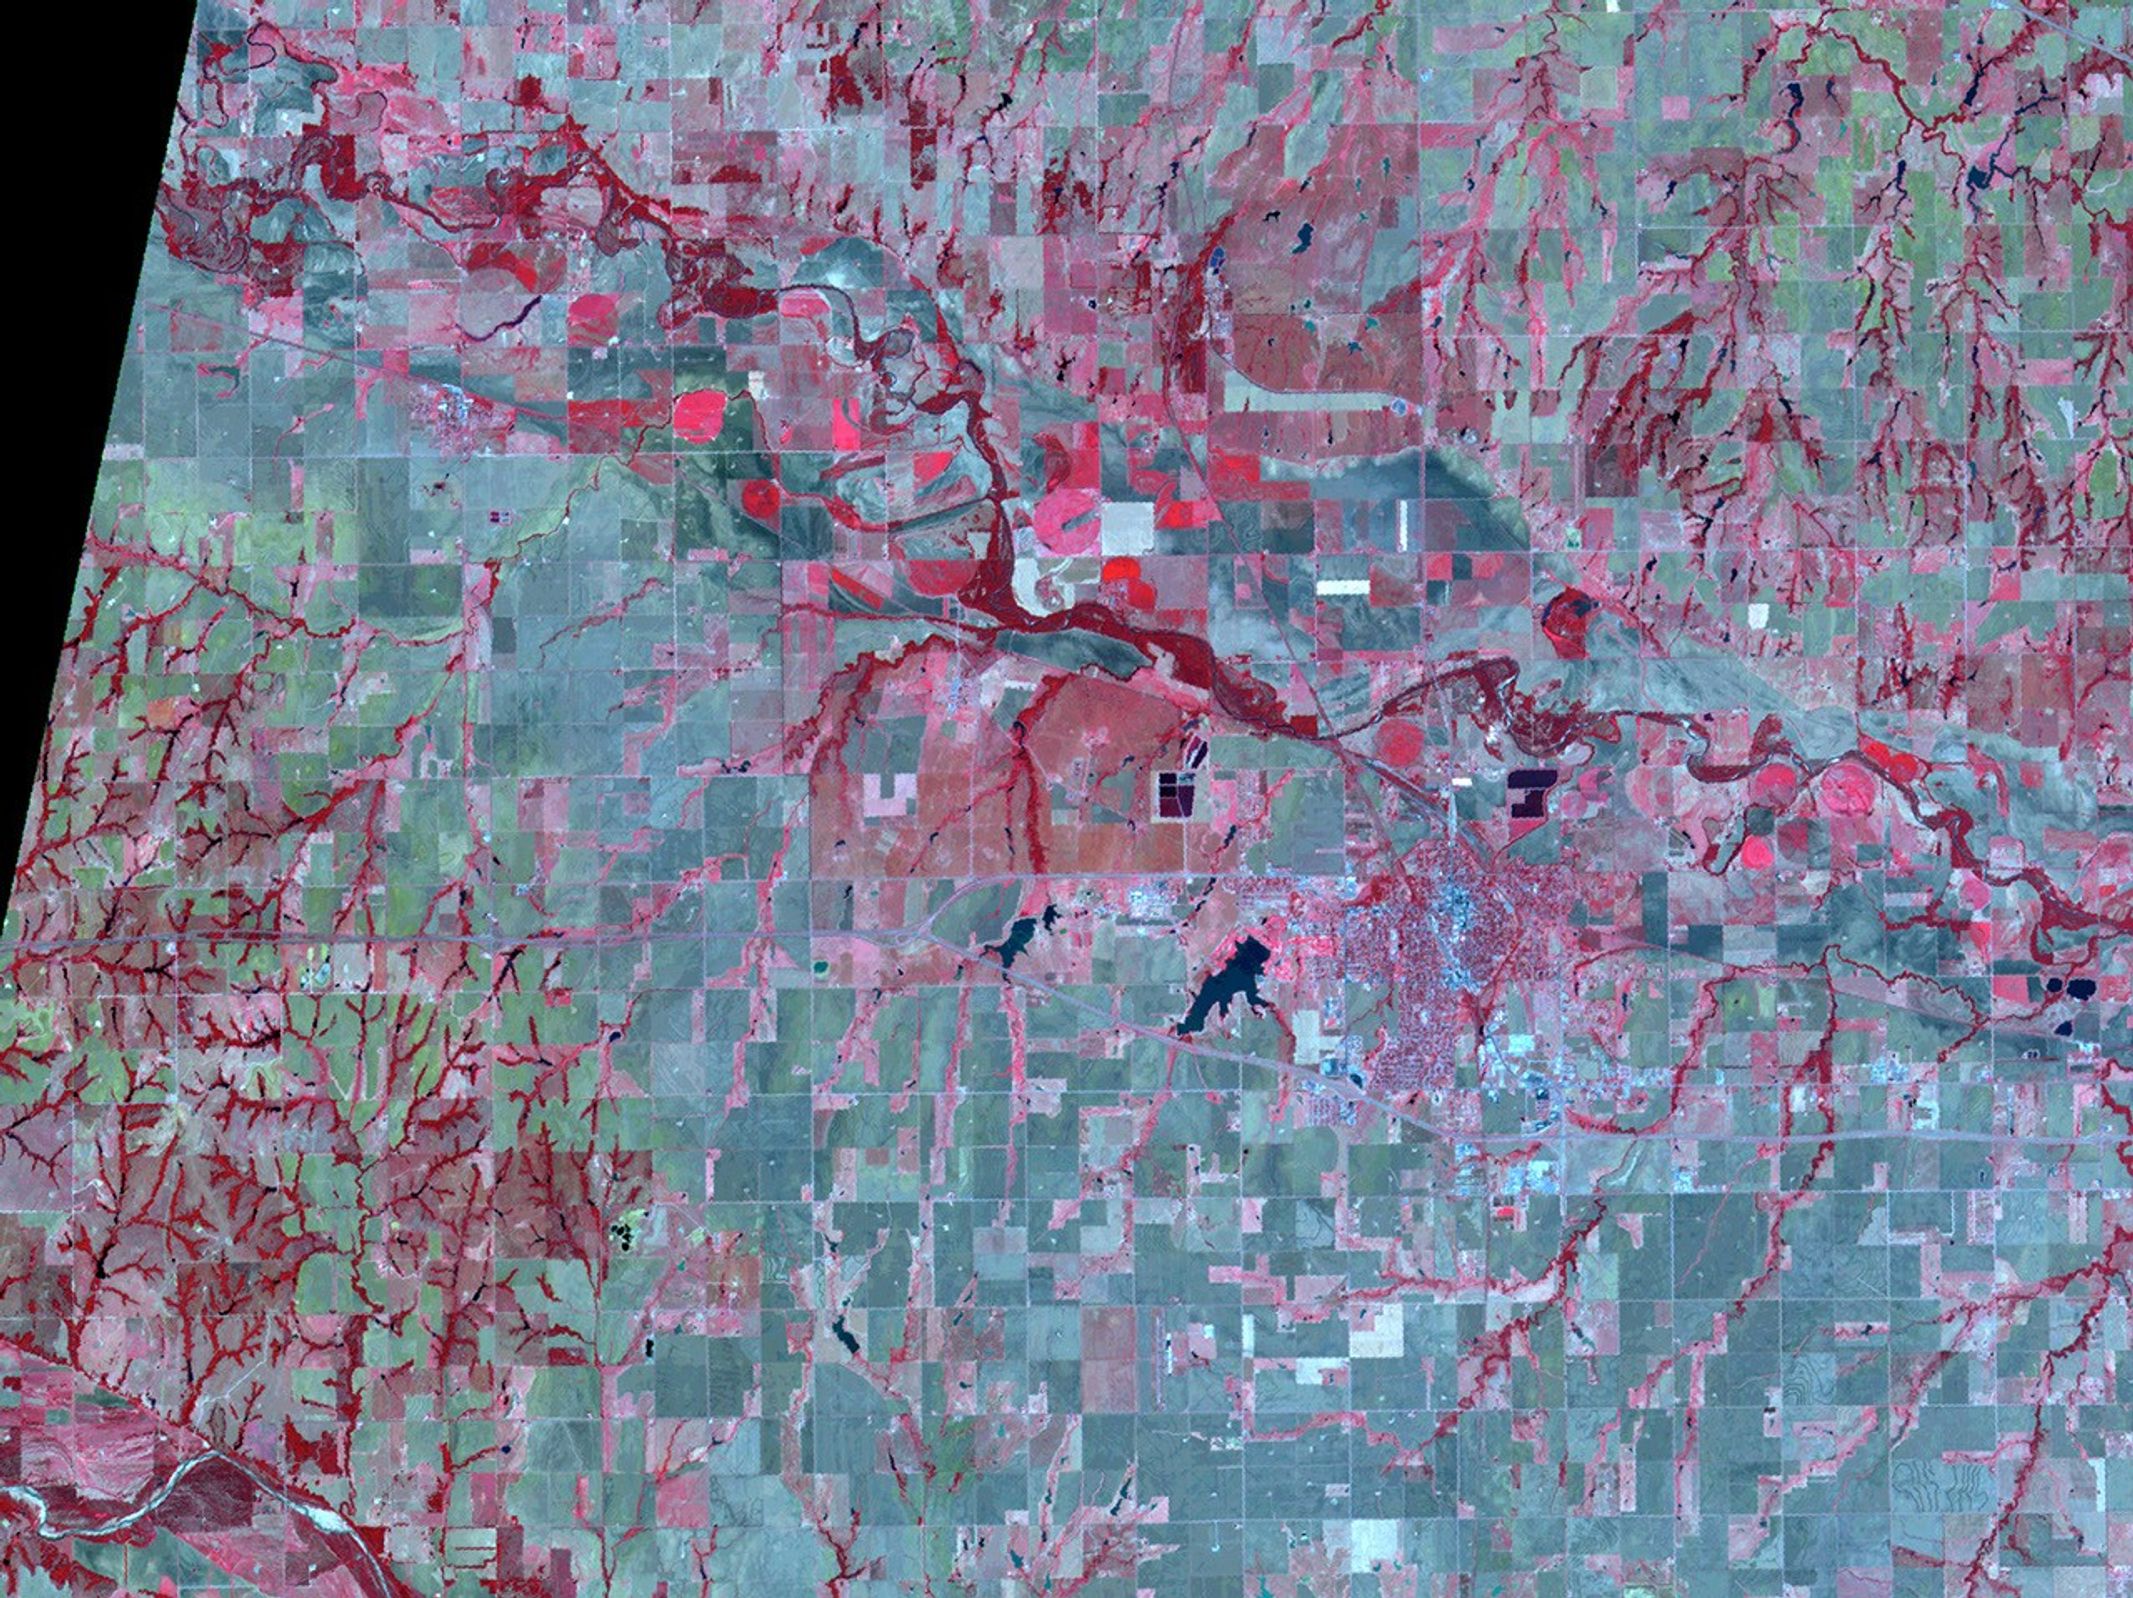


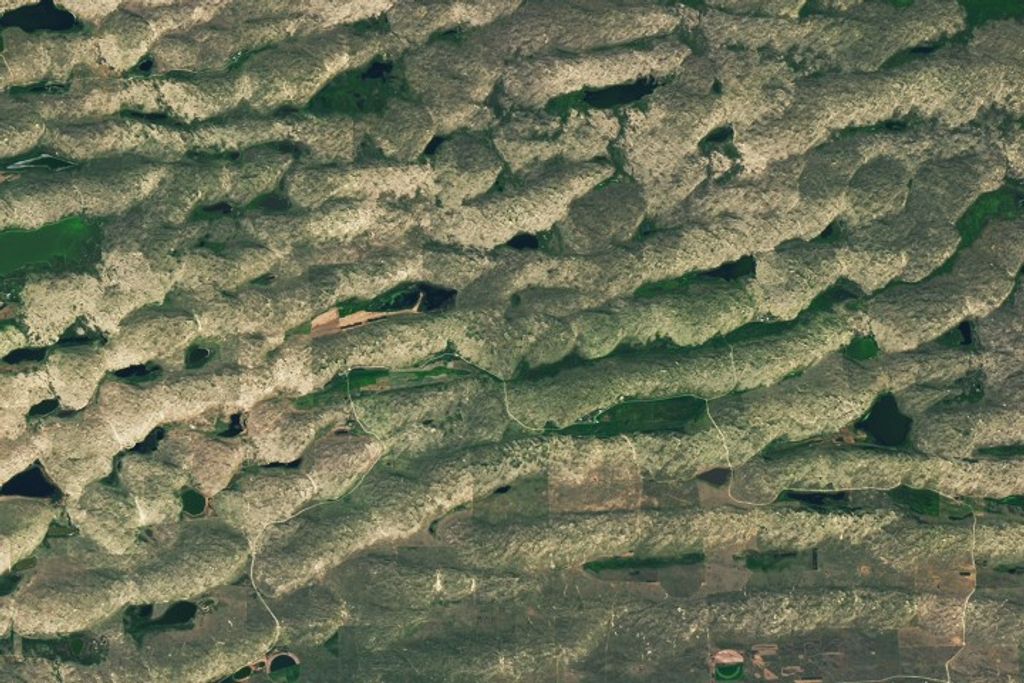


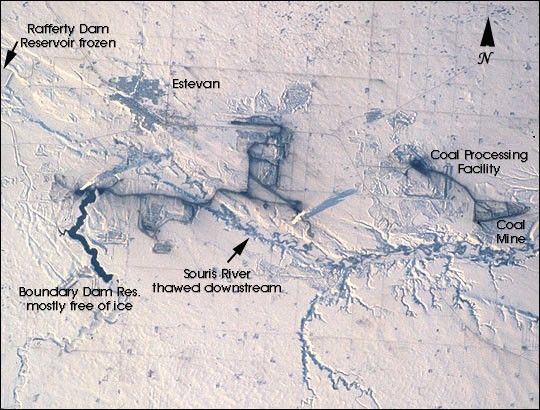

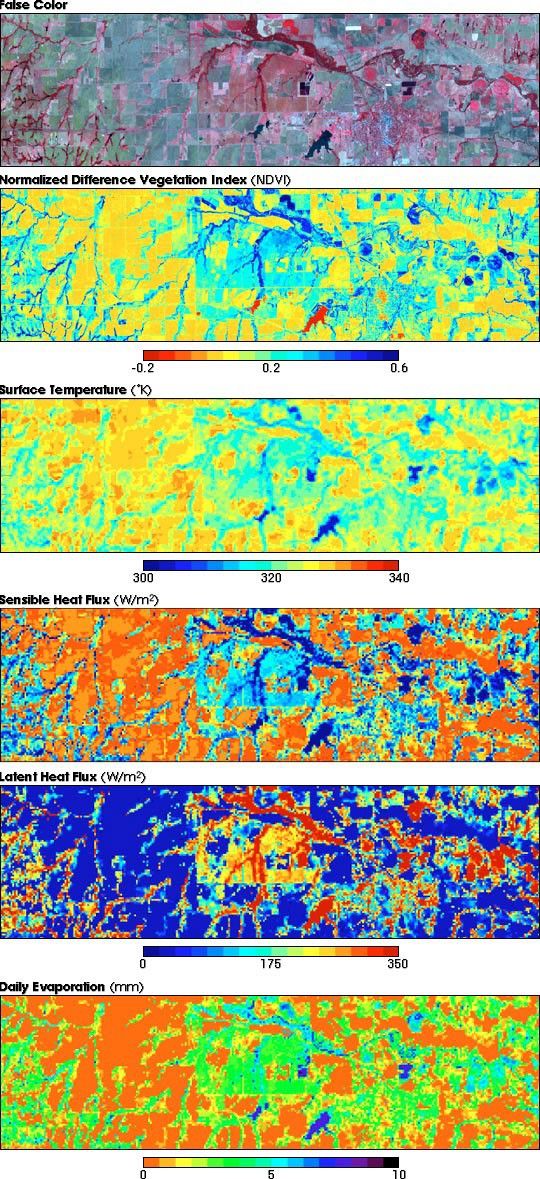
On September 4, 2000, the Advanced Spaceborne Thermal Emission andReflection Radiometer (ASTER) acquired these multi-spectral data overthe U.S. Department of Agriculture's Grazing Lands Research Laboratorynear El Reno, Oklahoma. This series of false-color composite imagesdemonstrates some of the many remote-sensing measurements thatscientists can make with ASTER's high-resolution (up to 15 square metersper pixel), multi-spectral data.
In the top image, bright red colors indicate greenvegetation, which at this time of year only includes irrigated lands andriparian zones. Gray-green colors represent harvested winter wheatfields. Dendritic drainage patterns are clearly depicted in the lowerleft and upper right portions of the scene. ASTER's three visible andnear-infrared bands were used to make this image.
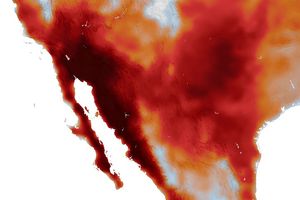
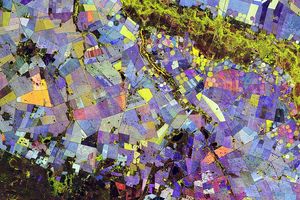
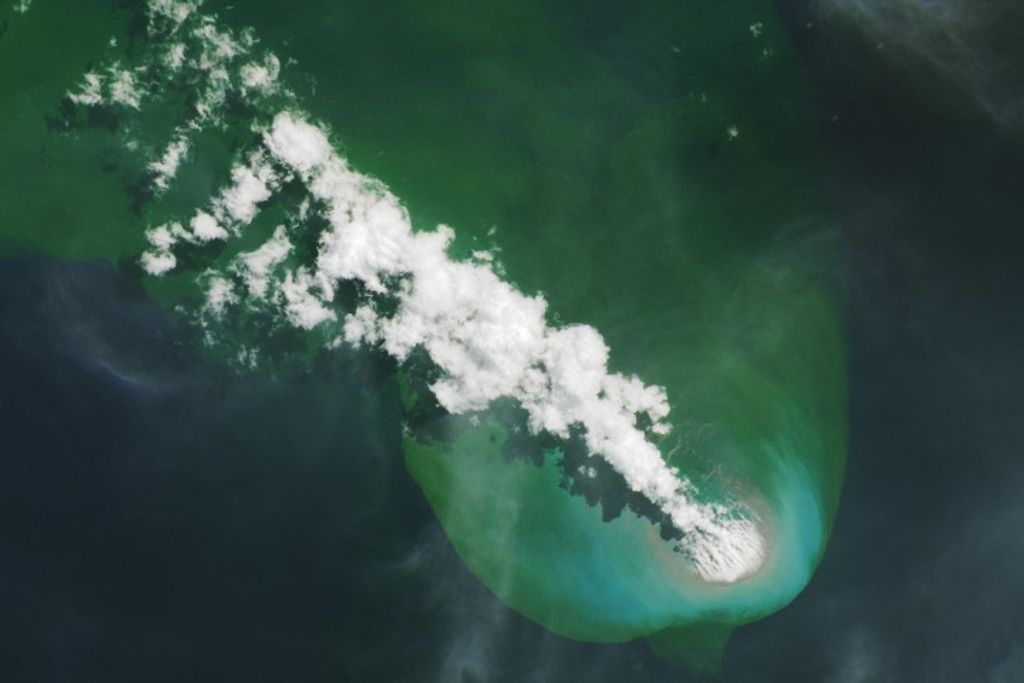
The second two images show that there is a strongcorrelation between the abundance of green vegetation (referred to asNormalized Difference Vegetation Index, or NDVI) and land surfacetemperature. Vegetated areas have NDVI values of greater than 0.3 (blueand green pixels) and are relatively cool (315-320 Kelvin). Bare soilsurfaces have NDVI values close to zero (orange and yellow) and arerelatively hot (325-330 Kelvin). Water bodies have a very low NDVI of-0.2 (red) and cool temperatures of about 300-305 Kelvin (blue).
The fourth and fifth images represent components of the surface energybalance over the region at 11:30 a.m. local time. Surface energybalance shows the relationship between incoming solar energy, energyabsorbed by the surface, and energy reflected or emitted from thesurface back up into the overlying atmosphere. These images provideinsights into the complex processes of direct radiation, conduction, andconvection that are important for scientists in studies of bothweather patterns and the water cycle. The fourth image shows sensibleheat and the fifth image shows latent heat, which represents energyflowing from the Earth's surface into the atmospheric boundary layer.Sensible heat is energy flow due to temperature gradients, while latentheat is energy flow due to evapotranspiration. The ASTER Team derivessensible and latent heat by combining measurements of surfacetemperature and vegetation abundance (NDVI) with surface meteorologicalmeasurements. Together, they show that heat flow from bare fields isdominated by sensible heat, while heat flow from vegetated areas andwater bodies is dominated by latent heat.
The latent heat flux measurements derived from ASTER data can beconverted into rates of evaporation, shown in the sixth image, and istherefore a direct measure of water lost to the atmosphere. Beforethermal infrared satelllite imagery became available, spatial changes inevaporation could not be measured. But until the recent launch ofASTER, the ability to accurately measure surface temperatures at highresolutions from space did not exist. Reliable surface temperatures areessential to monitoring evapotranspiration (the sum total of waterevaporated and transpired by plants into the atmosphere). At 90-meterresolution, scientists can use ASTER's thermal infrared detectors toaccurately measure surface temperatures over a wide range of landsurfaces. This capability will greatly improve our knowledge ofpatterns of evapotranspiration and of vegetation health.
ASTER's measurement capabilities may also prove useful for precisionfarmers.
References & Resources
Images courtesy Andrew French, ASTER Science Team