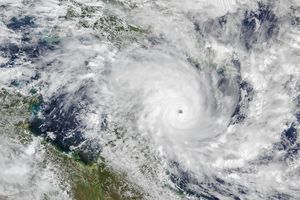


Tropical Cyclone Fritz first formed into a tropical cyclone on 10 February 2004 in theCoral Sea east of Queensland, Australia. The storm then came ashore on themorning of the 11th (LST) as a minimal cyclone along the northeastcoastline of Queensland just north of Cape Melville. Most of the rainfall with Fritz was awayfrom the center near Weipa to the north and Cairns to the south. Thesystem weakened into a tropical depression over land and continuedmoving westward cutting across the Cape York Peninsula before re-emerging over the waters of the Gulf of Carpentaria. It then re-intensified back into a Category 1 cyclone on the 12th. Fritz'scirculation, however, was too disrupted over land to have time to gettoo well organized and thus allow for significant strengthening.However, it did manage to reach Category 2 status with peak wind gustsexceeding 125 kph (75 mph) before crossing Mornington Island in thesouthern Gulf of Carpentaria. Fritz then made landfall again on thefar northwest coast of Queensland.
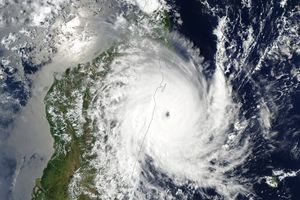
The Tropical Rainfall Measuring Mission (TRMM) satellite captured theseunique images of Cyclone Fritz while it was in the southern Gulf ofCarpentaria. The images were taken at 14:18 UTC on 11 February 2004(12:18 am Australian EST 12 February 2004). At the time, Fritz wascategorized as a Category 1 cyclone by the Brisbane Tropical CycloneWarning Centre with peak wind gusts of less then 125 kph (75 mph). Thefirst image shows the horizontal distribution of rain rates as seen bythe TRMM satellite. Rain rates in the center swath are from the TRMMPrecipitation Radar (PR), the first precipitation radar in space, whilerain rates in the outer swath are from the TRMM Microwave Imager (TMI).The rain rates are overlaid on infrared (IR) data from the TRMM VisibleInfrared Scanner (VIRS). Fritz is shown to have a poorly organizedcirculation with no discernable eyewall. At this time only small,isolated areas of heavy rainfall are present (dark red spots). Tropicalcyclones need the heat that is released when water vapor condenses intothe cloud droplets that form the precipitation to drive the storm. Thisprocess is most efficient when the storm is well-organized and theheating takes place near the center. The second image shows a verticalcross section looking towards the west through the northern part ofstorm from the TRMM PR. It shows areas of heavy rainfall (darker reds)associated with rainbands away from the center of circulation.
TRMM is a joint mission between NASA and the Japanese space agency JAXA.
References & Resources
Images produced by Hal Pierce (SSAI/NASA GSFC) and caption by Steve Lang (SSAI/NASA GSFC).