![Request for Information – Potential [Placeholder for Prize]](https://assets.science.nasa.gov/dynamicimage/assets/science/missions/a-step/FFR_Earth_Background_20251120%20.png?w=1024)


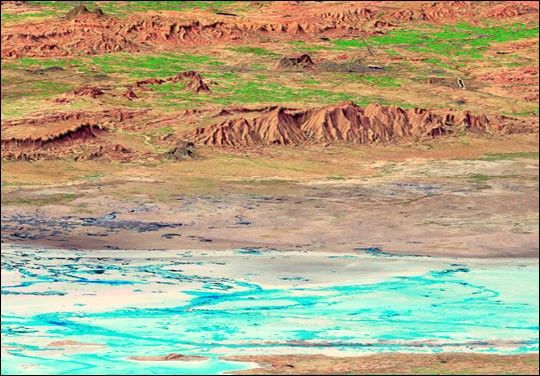
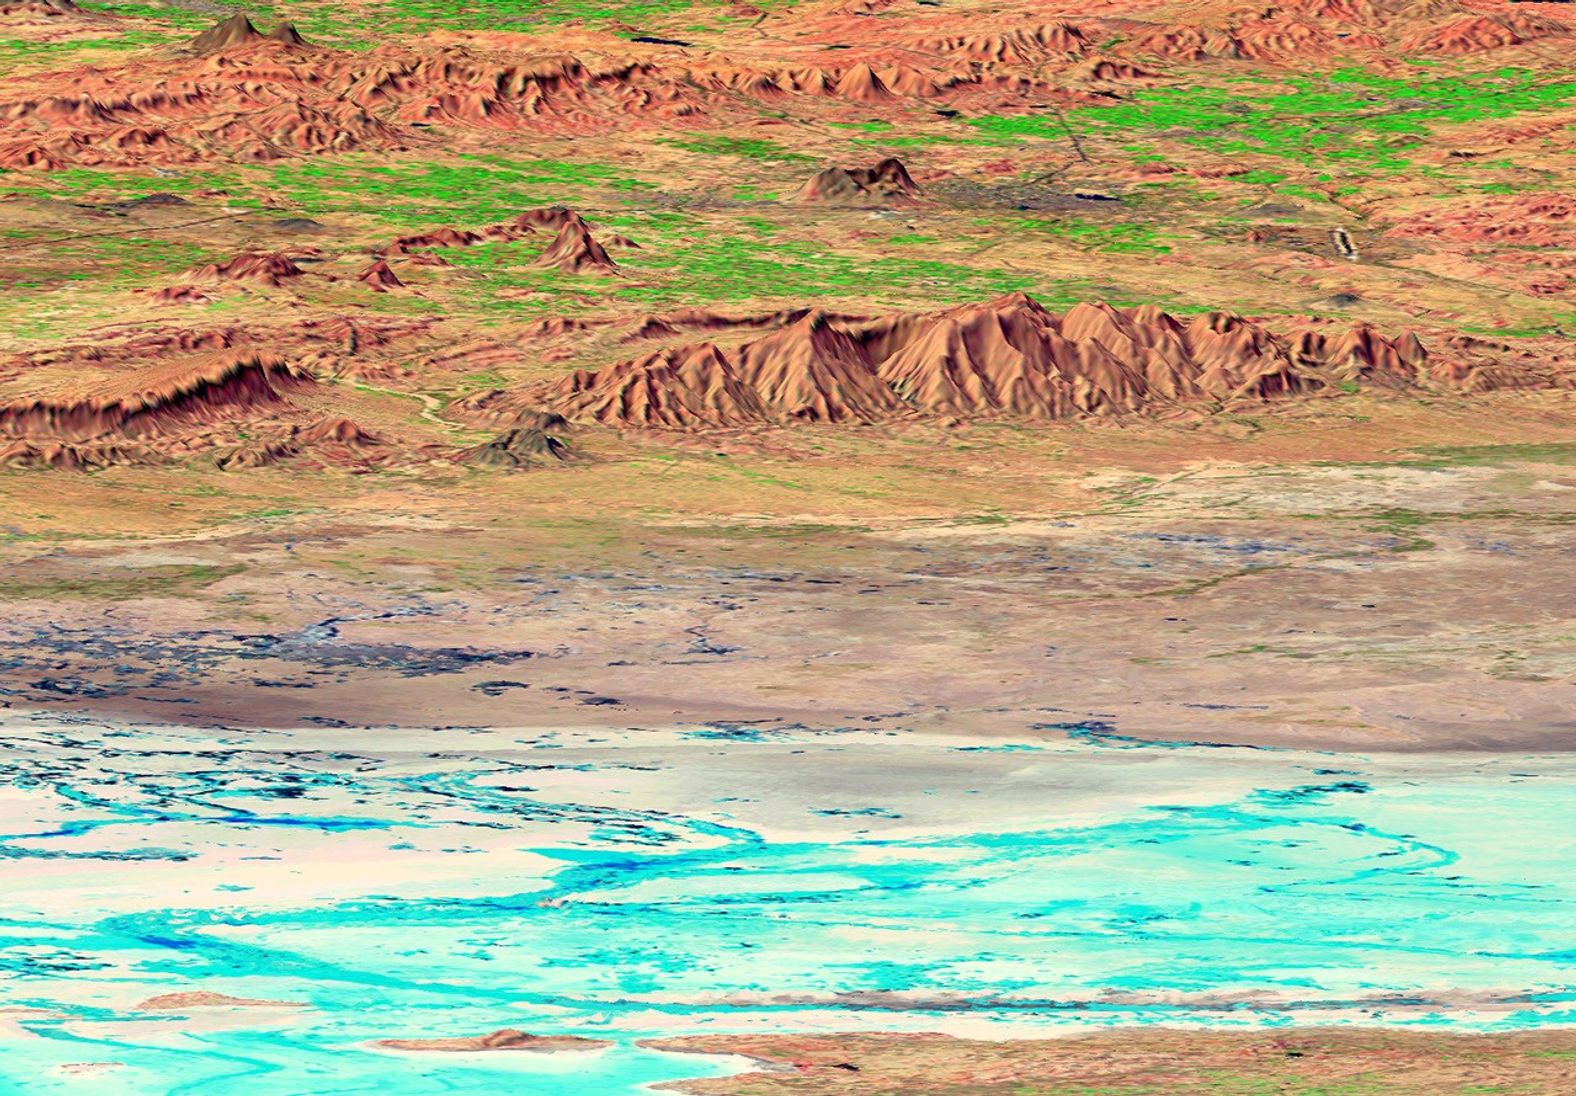
The earthquake that struck western India on January 26, 2001, was thecountry's strongest in the past 50 years. This perspective view showsthe area of the earthquake's epicenter in the lower left corner. Thesouthern Rann of Kachchh appears in the foreground. The Rann is an areaof low-lying salt flats that shows up with various shades of white andblue in this false-color Landsat image. The gray area on the middle ofthe image is called the Banni plains.
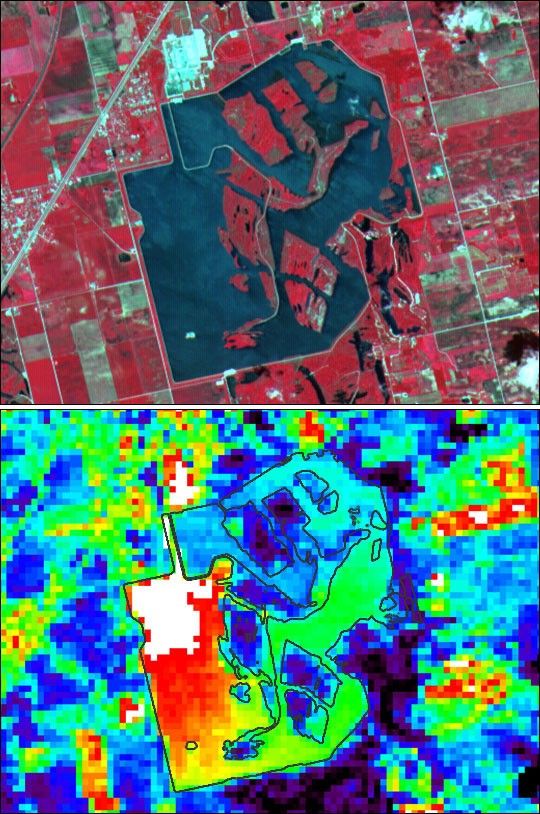
The darker blue spots and curving lines in the Rann and the Banniplains are features that appeared after the January earthquake. Theirtrue colors are shades of white and gray, but the infrared data used inthe image gives them a blue or turquoise color. These features are theeffects of liquefaction of wet soil, sand and mud layers caused by theshaking of the earthquake. The liquefaction beneath the surface causeswater to be squeezed out at the surface forming mud volcanoes, sandblows and temporary springs. Some of the residents of this dry area werehopeful that they could use the water, but they found that the water wastoo salty in almost every place where it came to the surface.
The city of Bhuj, India, appears as a gray area in the upper right ofthe image. Bhuj and many other towns and cities nearby were almostcompletely destroyed by the January 2001 earthquake. This magnitude 7.7earthquake was the deadliest in the history of India with some 20,000fatalities and over a million homes damaged or destroyed. The city ofBhuj was the historical capital of the Kachchh region. Highways andrivers appear as dark lines. Vegetation appears bright green in thisfalse-color Landsat image.
The city of Anjar is in the dark gray area near the upper left of theimage. Previously damaged by a magnitude 6.1 earthquake in 1956 thatkilled 152 people, Anjar suffered again in the larger 2001 earthquake.The red hills in the center of the image are the Has and Karo Hills,which reach up to 300 m (900 feet) elevation. Geologists are studyingthe folded red sandstone layers that form these hills to determine ifthey are related to the fault that broke in the 2001 earthquake.
This three-dimensional perspective view was generated usingtopographic data from the Shuttle Radar Topography Mission (SRTM) and anenhanced false-color Landsat 7 satellite image. Colors are from Landsatbands 5, 4, and 2 as red, green and blue, respectively. Topographicexpression is exaggerated 5X.
Size: scale varies in this perspective image
Location: 23.5 deg. North lat., 69.9 deg. East lon.
Orientation: looking Southwest
Image Data: Landsat Bands 5, 4, 3 as red, green, blue respectively
Original Data Resolution: SRTM 30 meters (99 feet), Landsat 30 meters
Date Acquired: four days in February, 2000 (SRTM), February 9, 2001 (Landsat)
References & Resources
Image Courtesy NASA/JPL/NIMA