


![Request for Information – Potential [Placeholder for Prize]](https://assets.science.nasa.gov/dynamicimage/assets/science/psd/solar/2023/09/s/solarsystem_0.jpg?w=1024)


February 24-March 21, 2019
Devastation in Mozambique
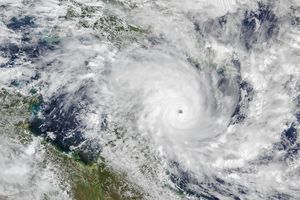
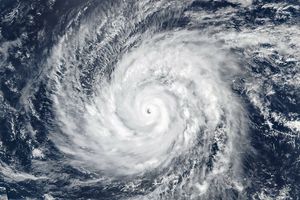
Tropical cyclones carry three major threats: winds, storm surge, and rainfall-triggered floods. All three landed devastating blows on Mozambique when Tropical Cyclone Idai came ashore on March 15, 2019, after taking a sharp turn in the Mozambique Channel a few days earlier.
The storm raked coastal cities and towns in Central Mozambique with winds of 175 kilometers (110 miles) per hour—strong enough to topple trees and tear the roofs from homes. But as is usually the case with tropical cyclones, water proved to be the most destructive. Idai made landfall around the time of high tide, so the storm pushed a tremendous wall of water ashore—a surge of up to 6 meters (20 feet) in some areas. The water swamped a large tract of low-lying land along the Pungwe River. Meanwhile, as the large, slow-moving storm moved inland, it dumped extremely heavy rain on much of Mozambique’s Manica and Sofala provinces.
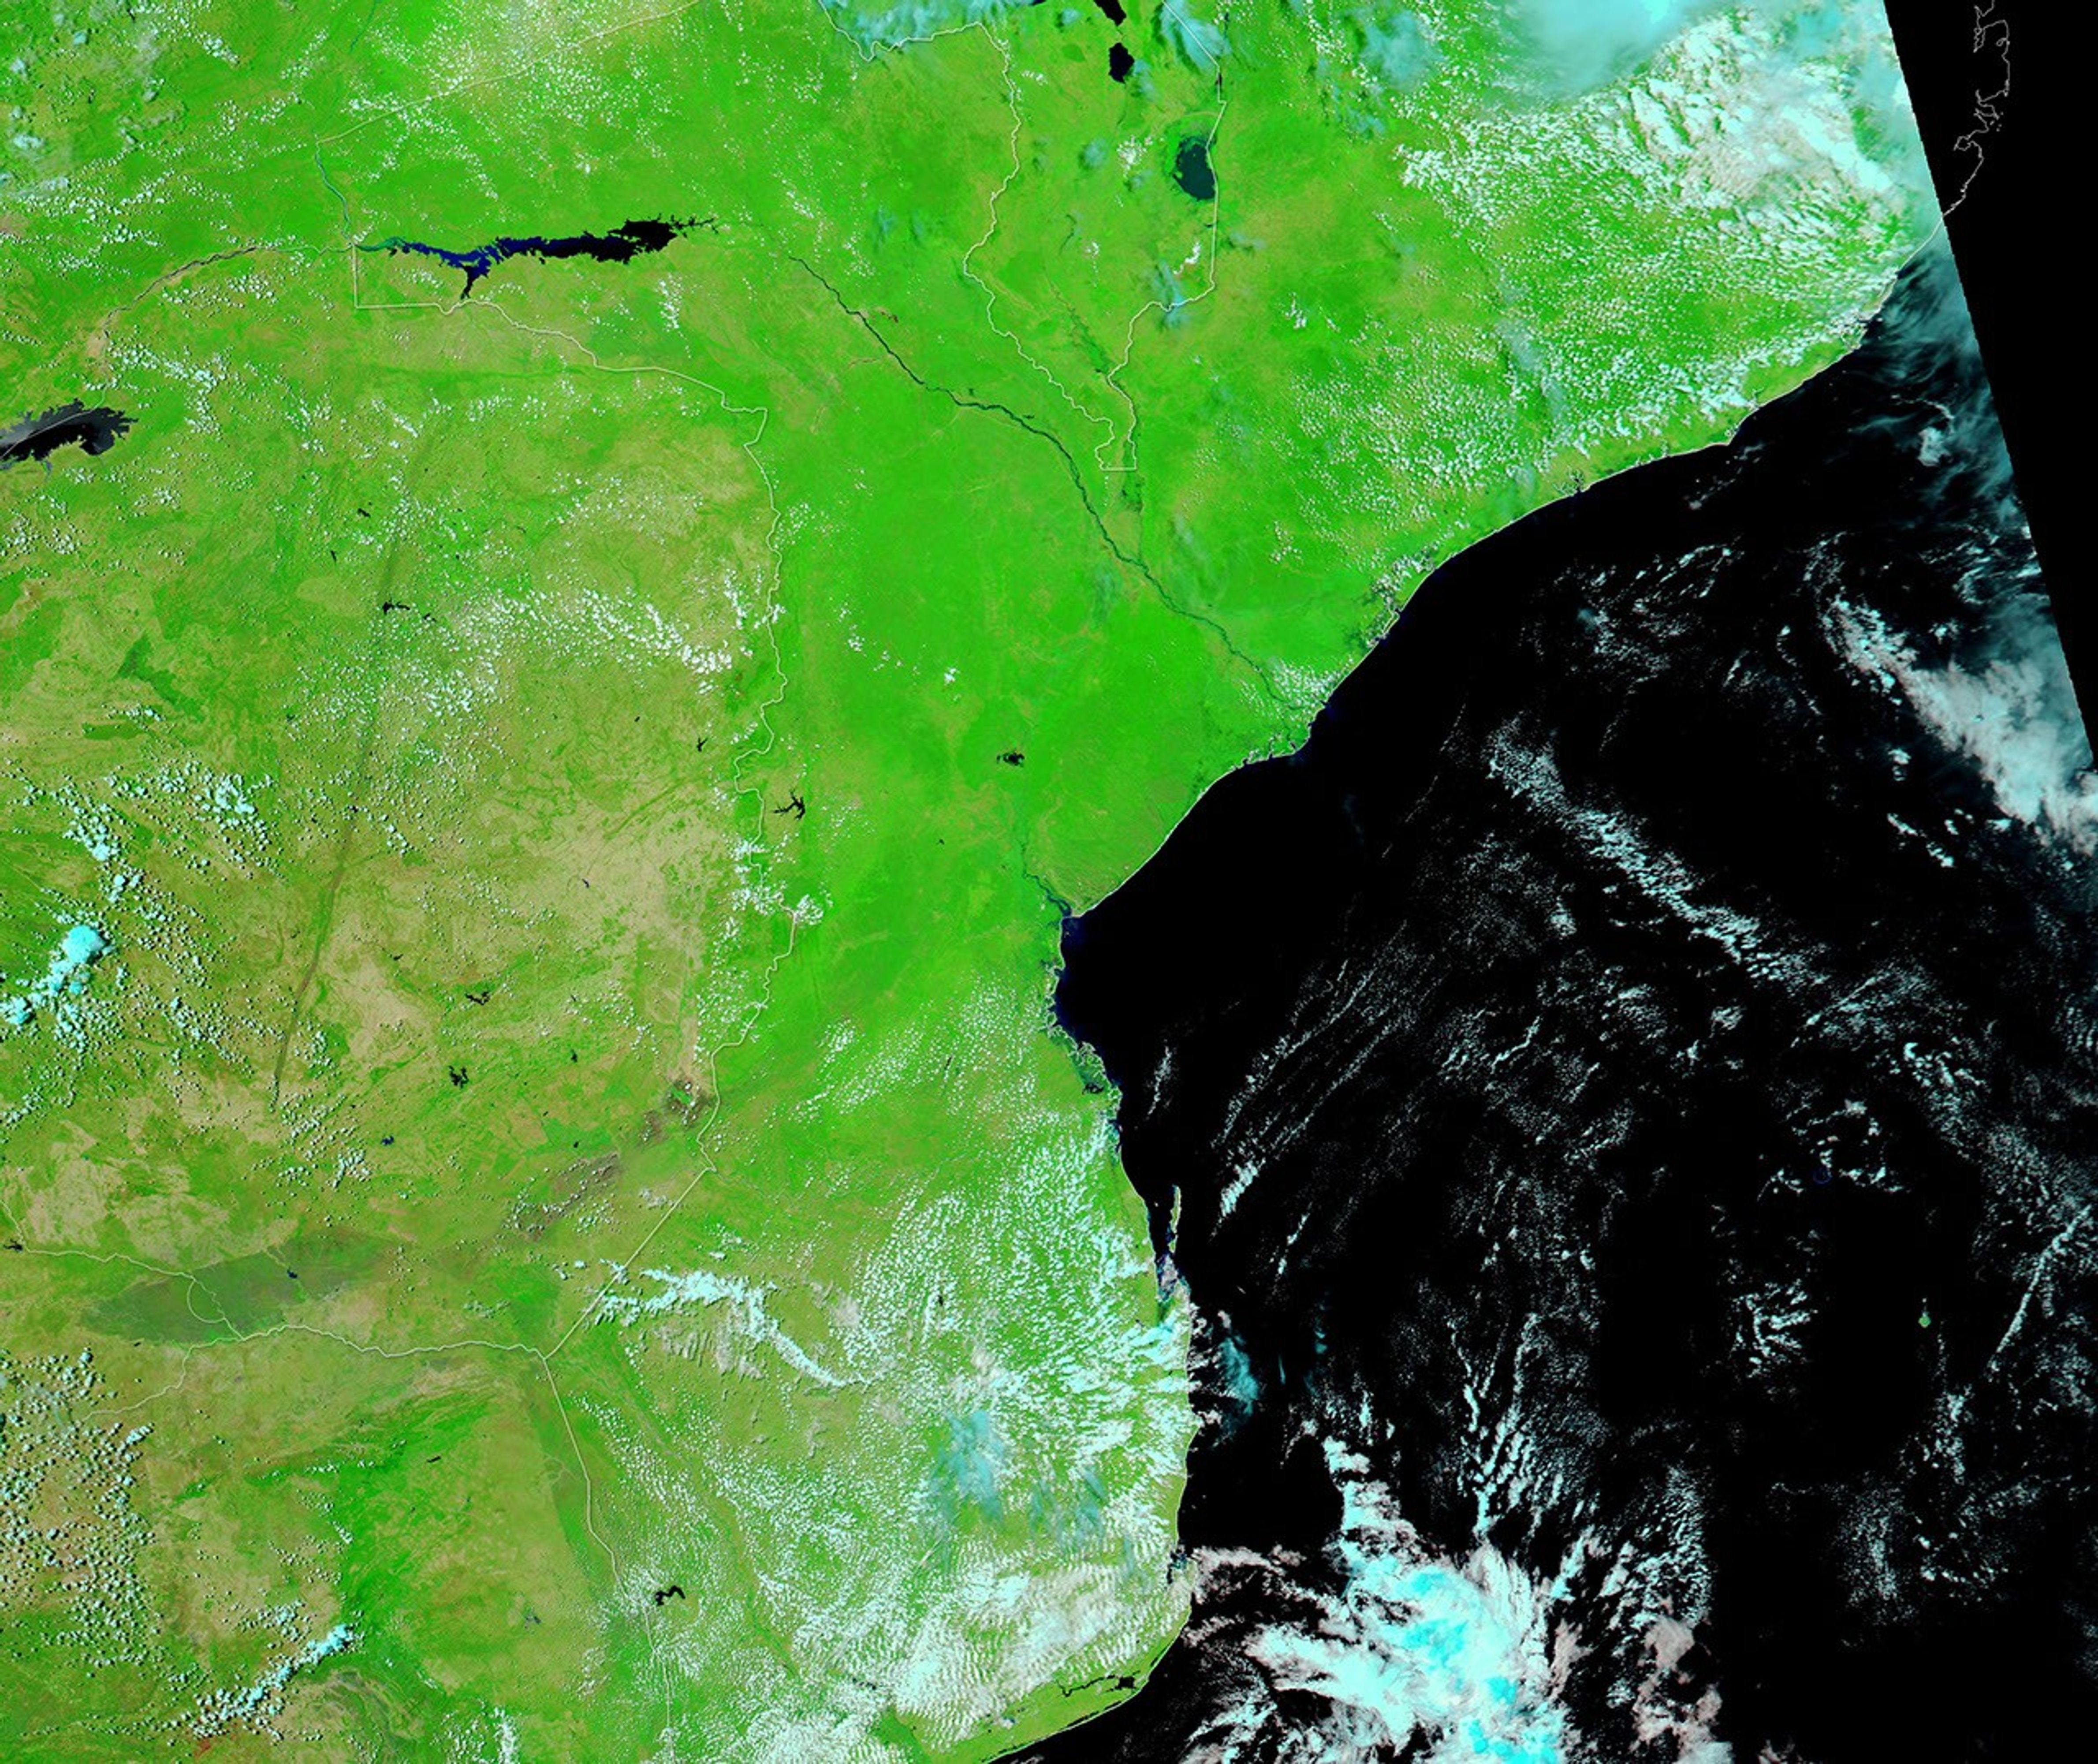
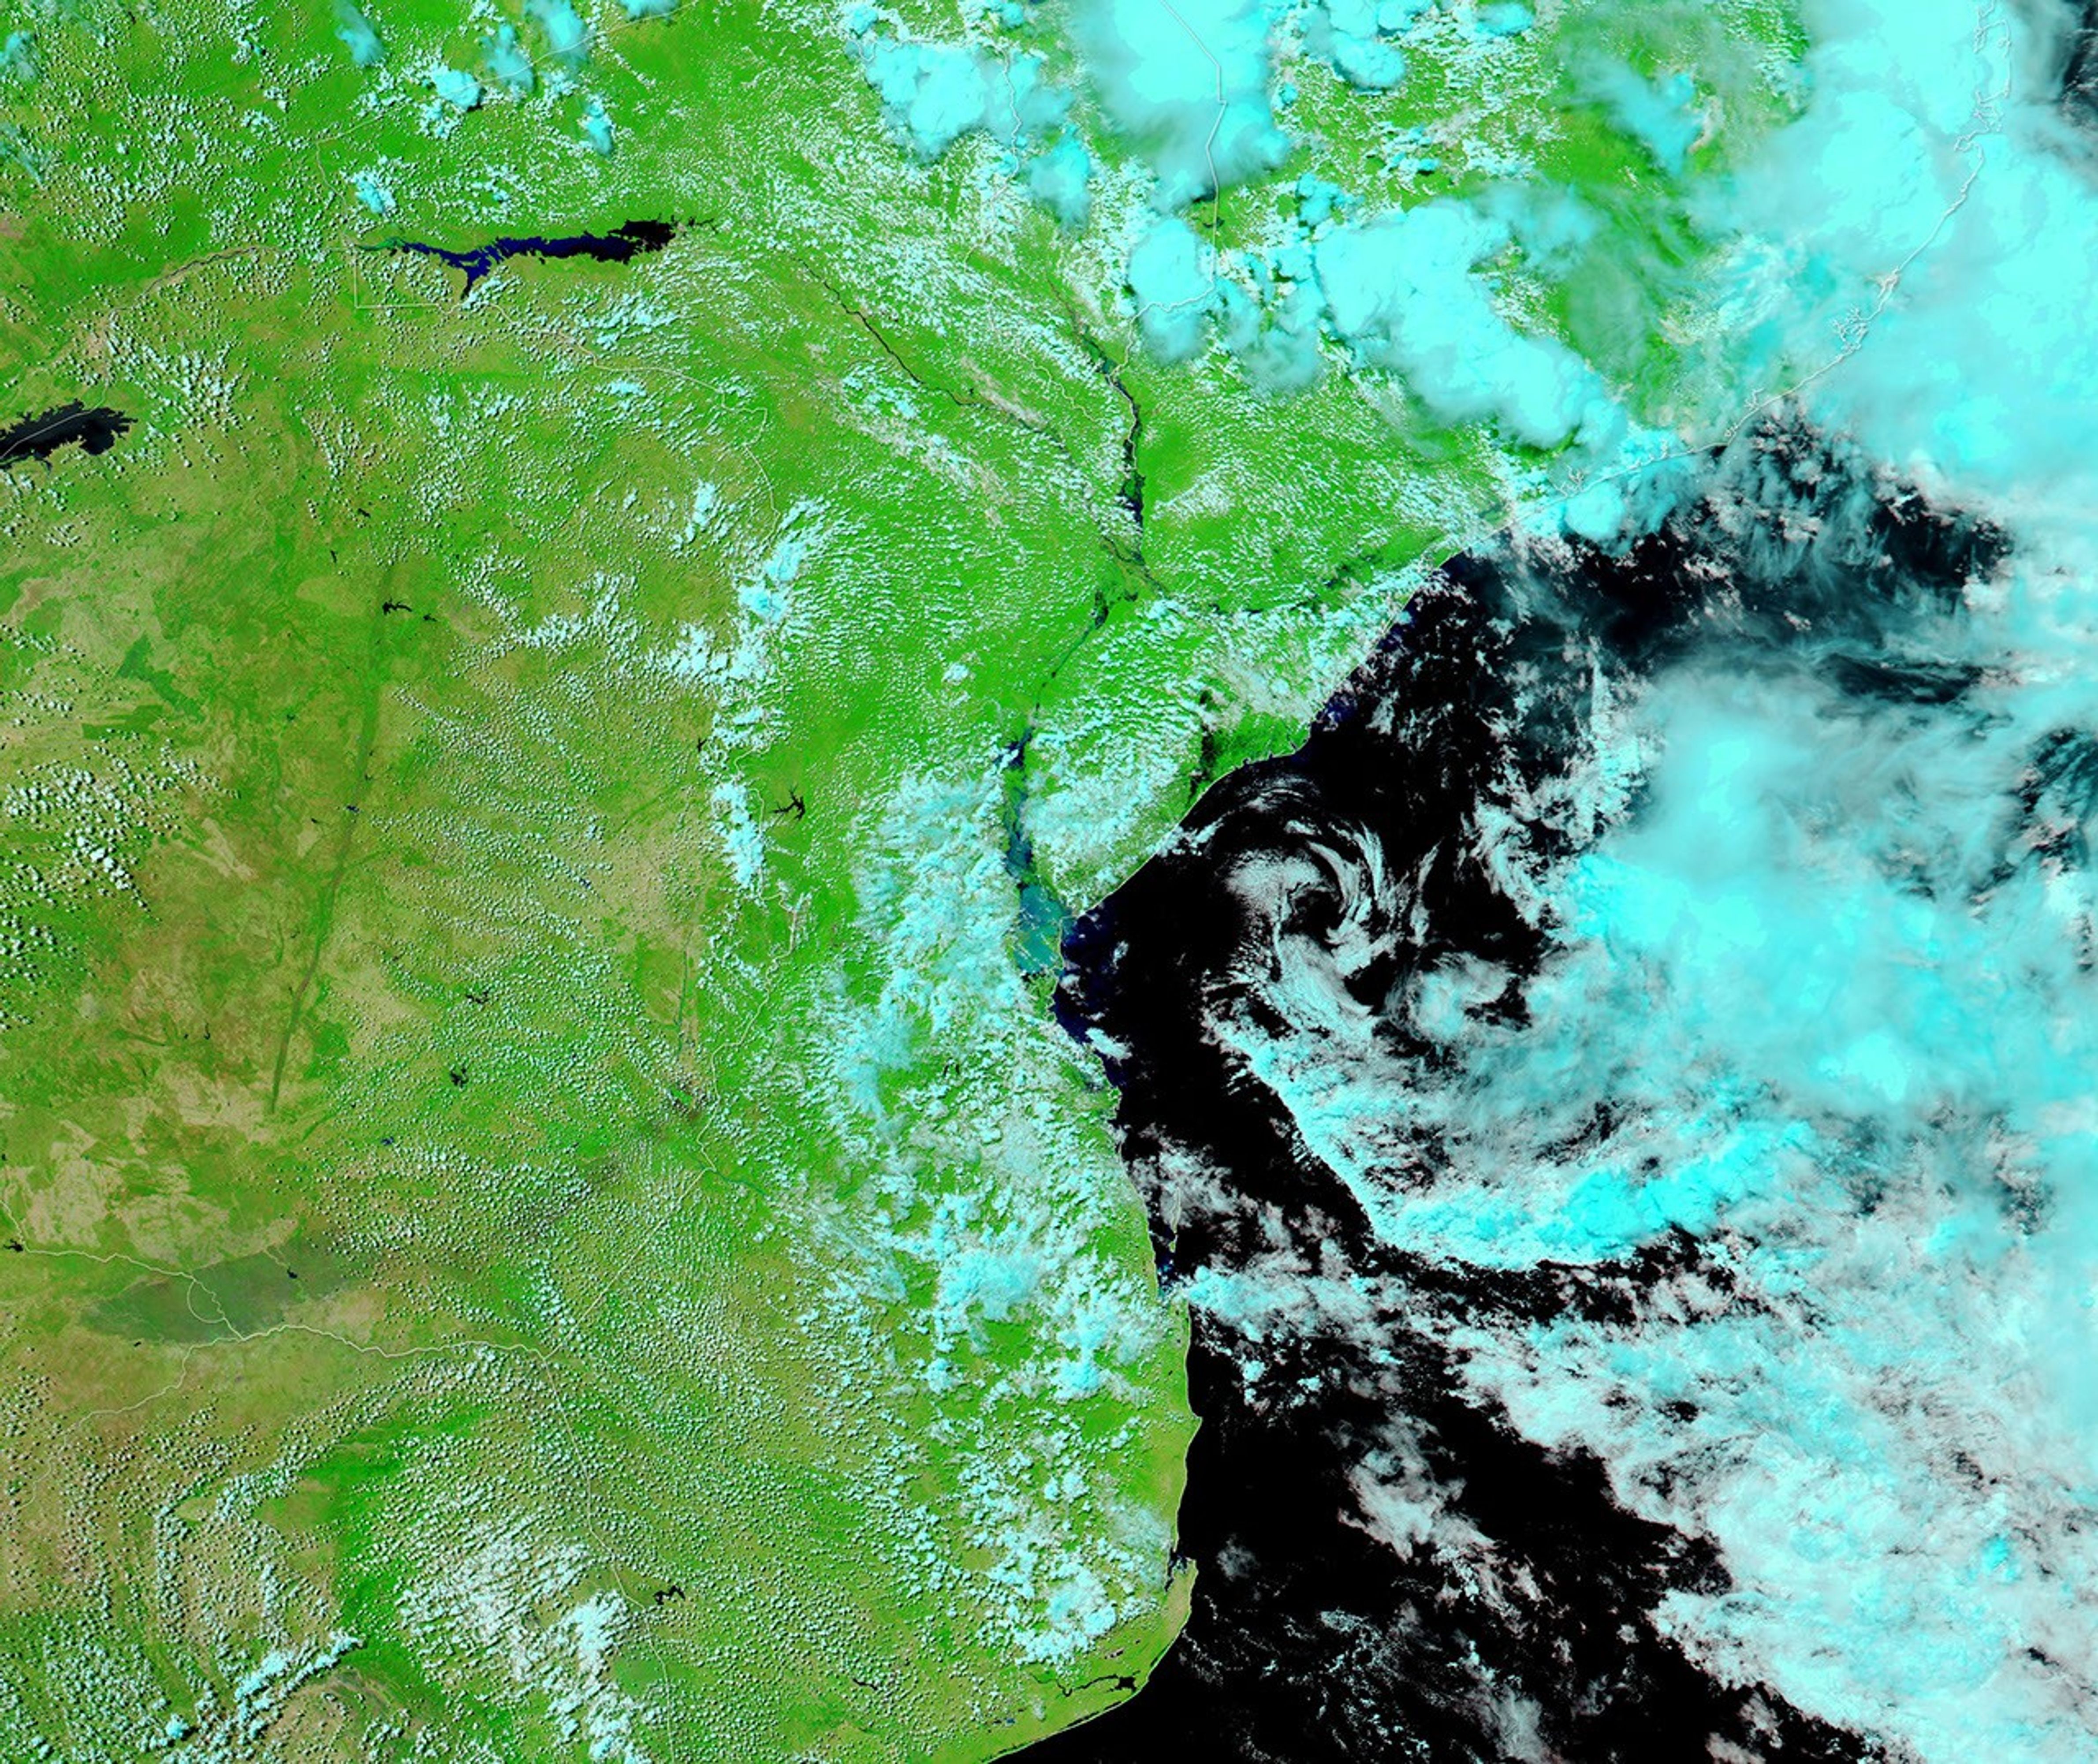
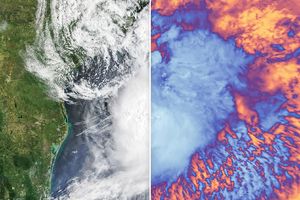
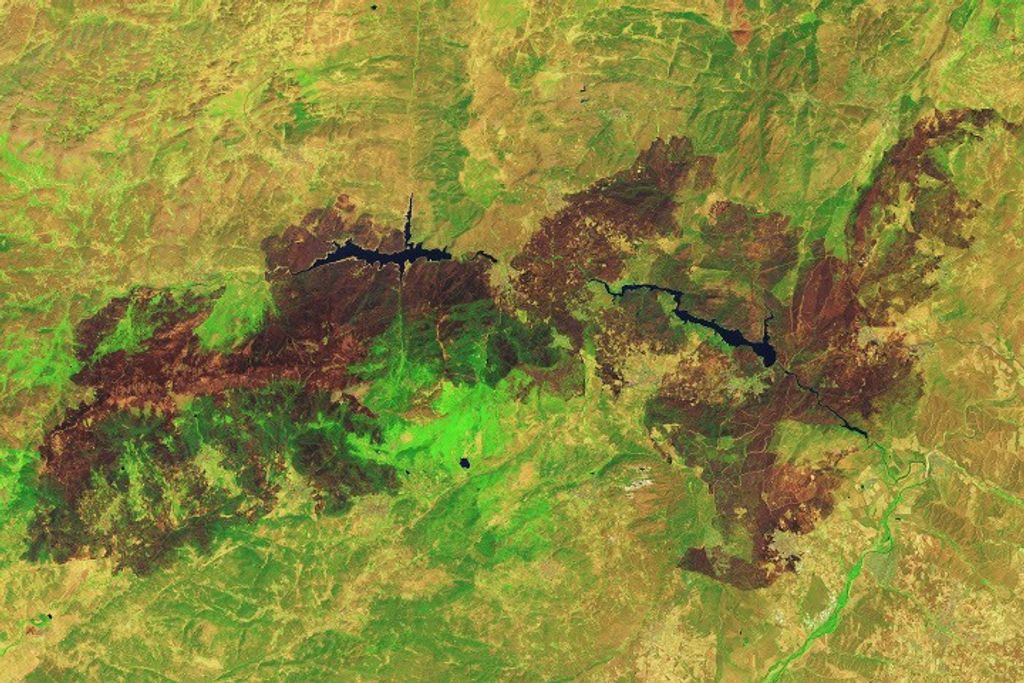
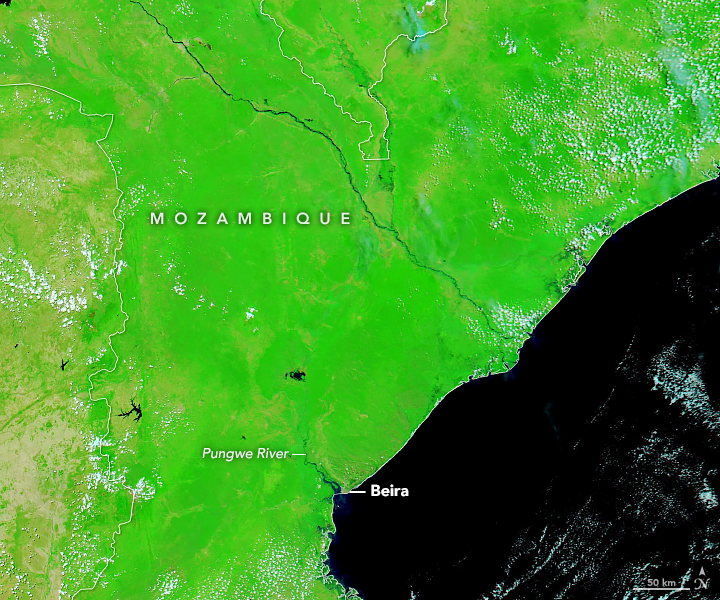
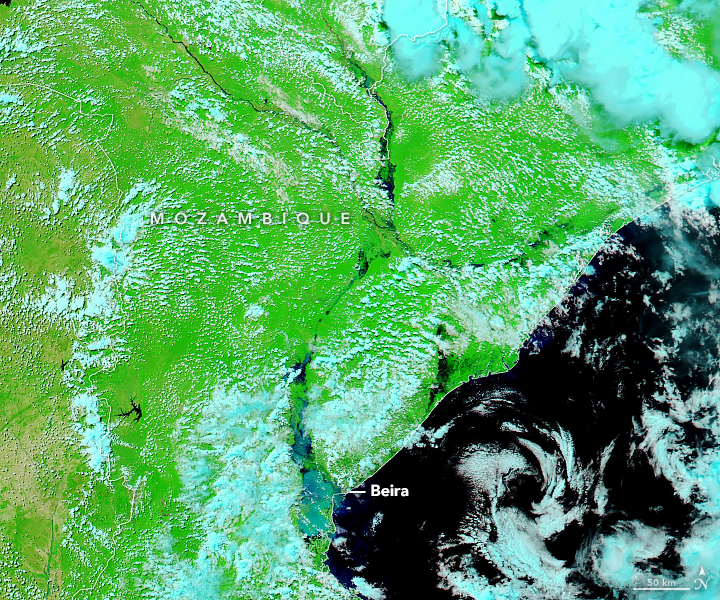
The Moderate Resolution Imaging Spectroradiometer (MODIS) on NASA’s Aqua satellite captured a false-color image (top of the page) of the flooding on March 21, 2019—the first relatively clear NASA satellite view since Idai hit. The other image shows the same area on February 24, 2019.
The storm surge and rains combined to turn the Pungwe Basin into an inland sea. Entire communities south of the Pungwe River appeared to be under water. Farther north, the Zambezi River remained swollen because Idai essentially hit the area twice; heavy rain fell earlier in March from the tropical disturbance that later became Idai. One estimate, based on Sentinel-1 data acquired on March 19, indicated that water covered roughly 2,165 square kilometers (835 square miles) of eastern Africa, an area half the size of Rhode Island.
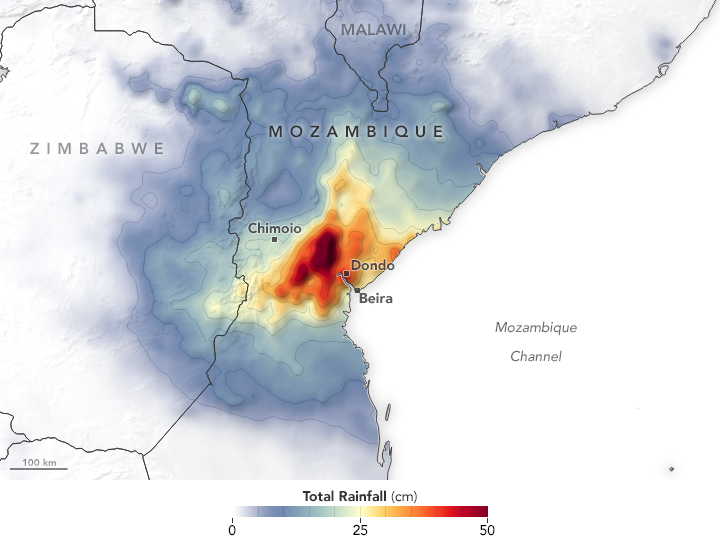
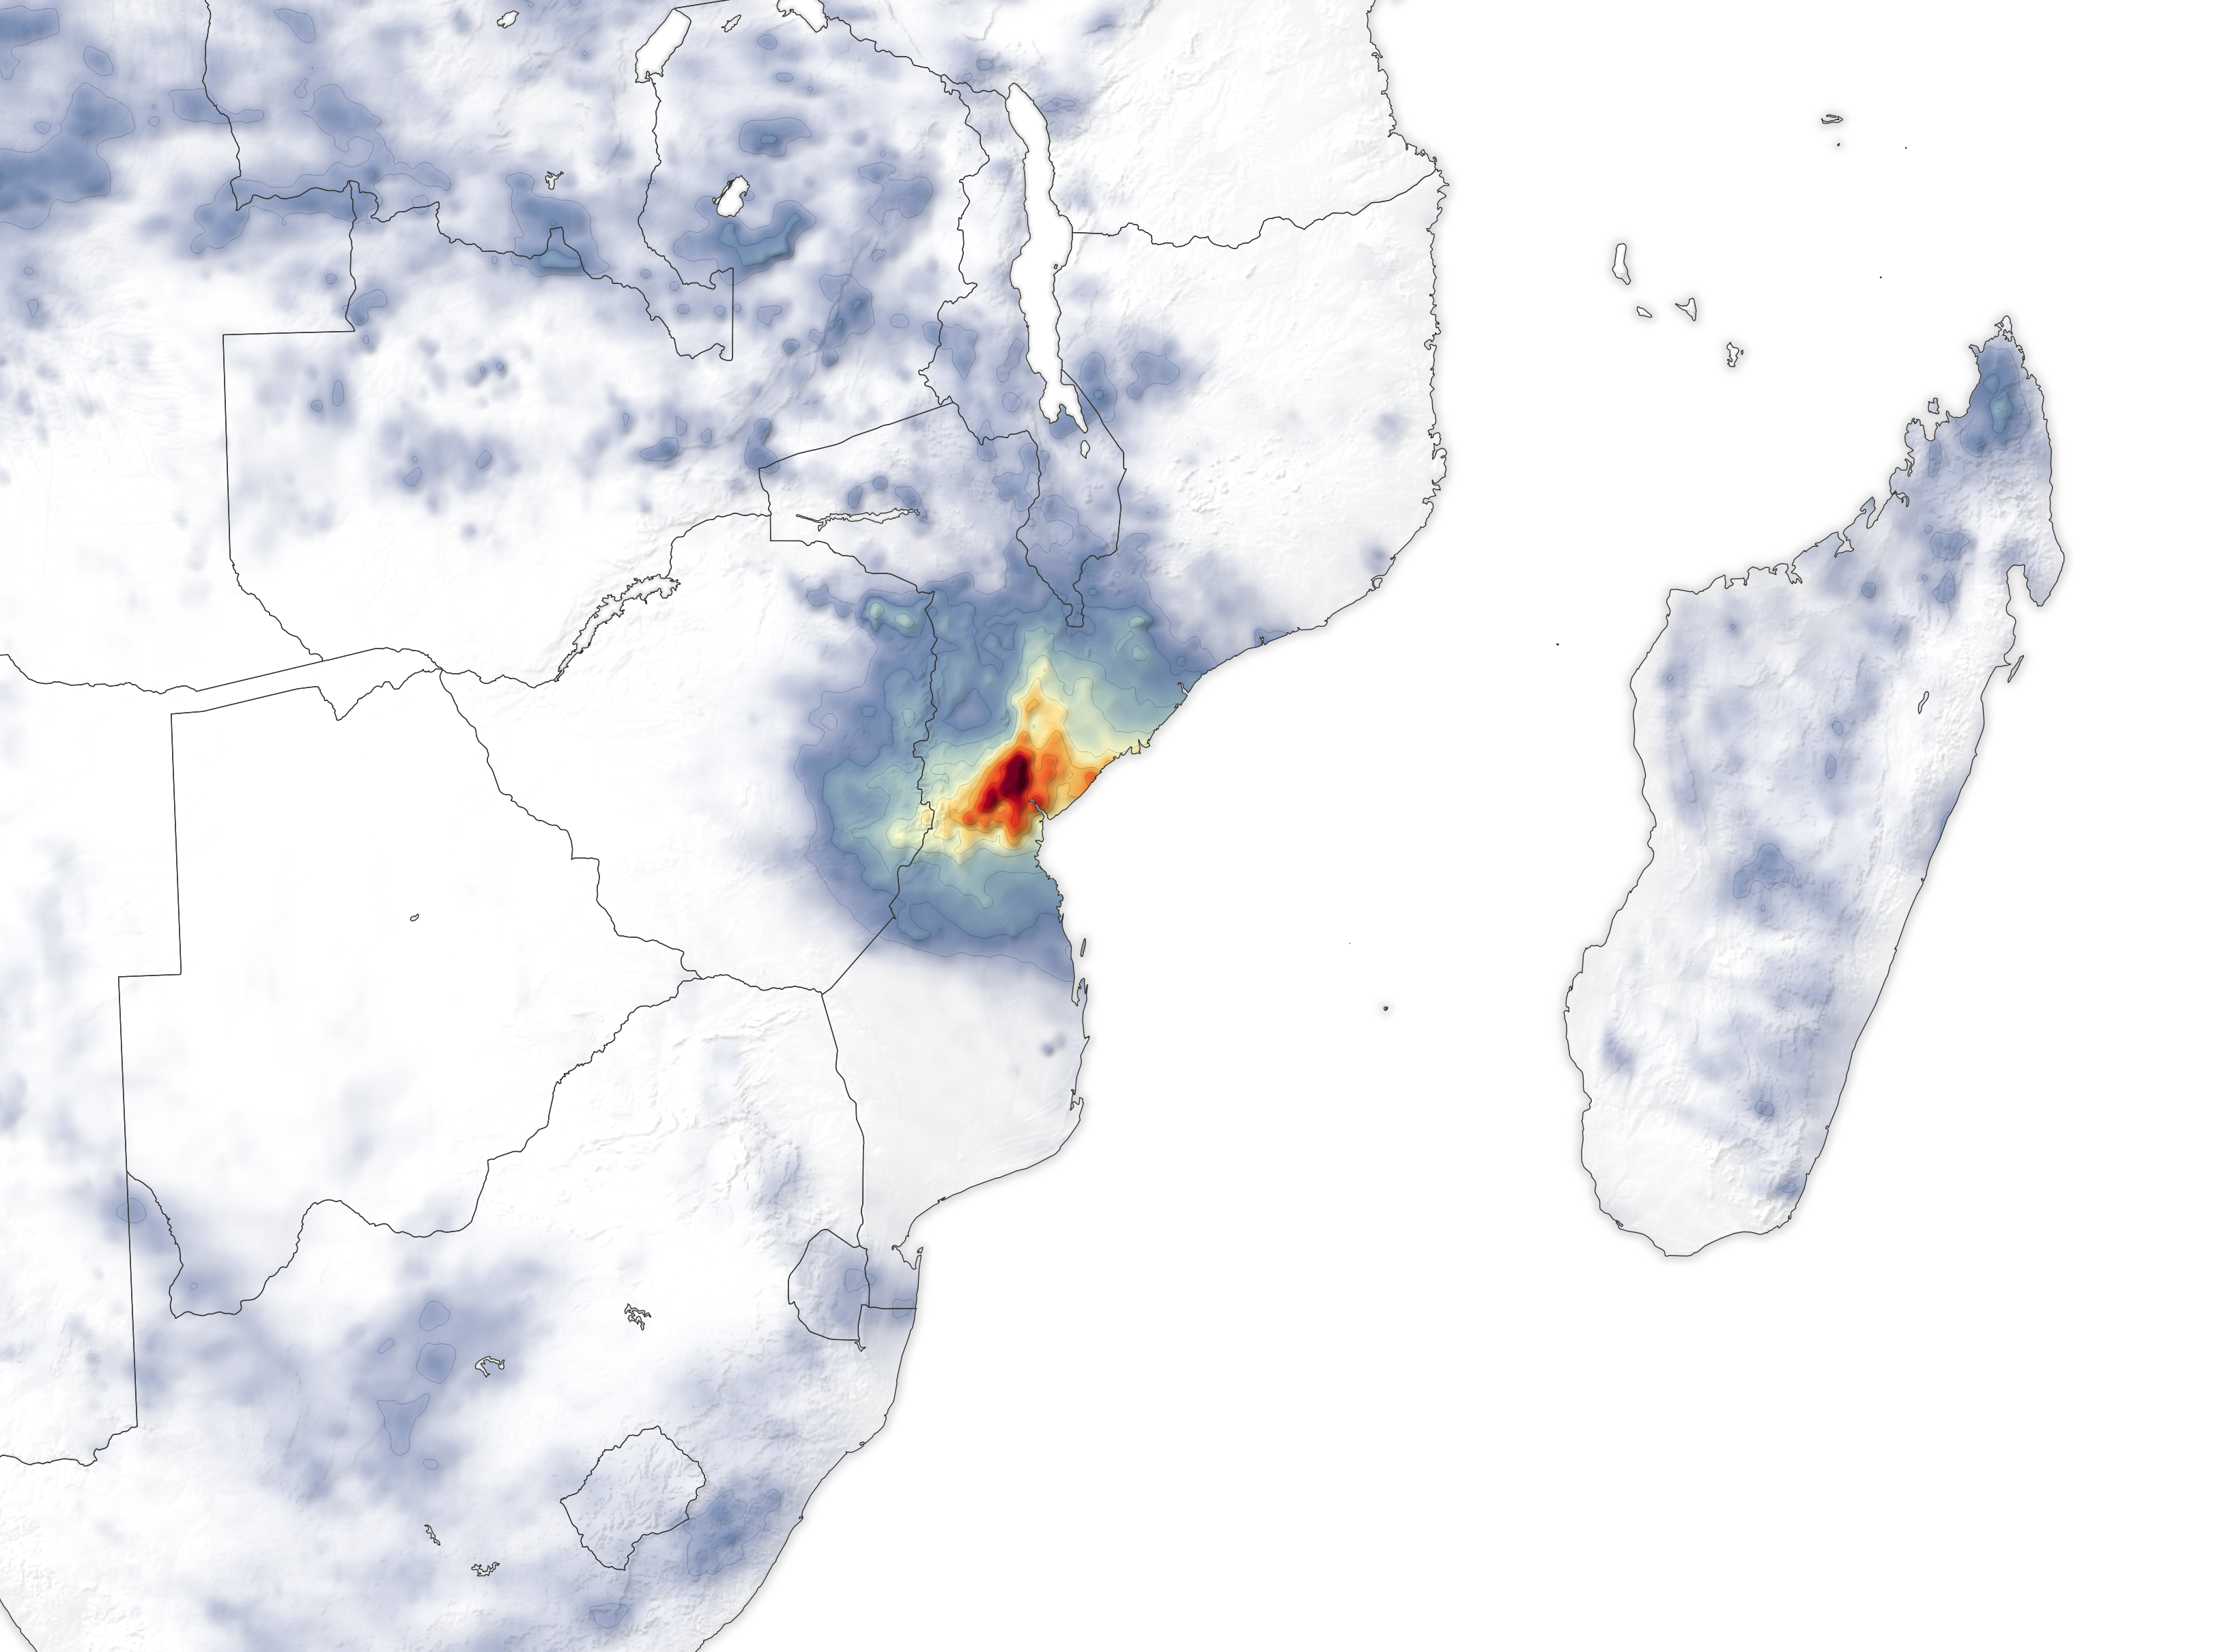
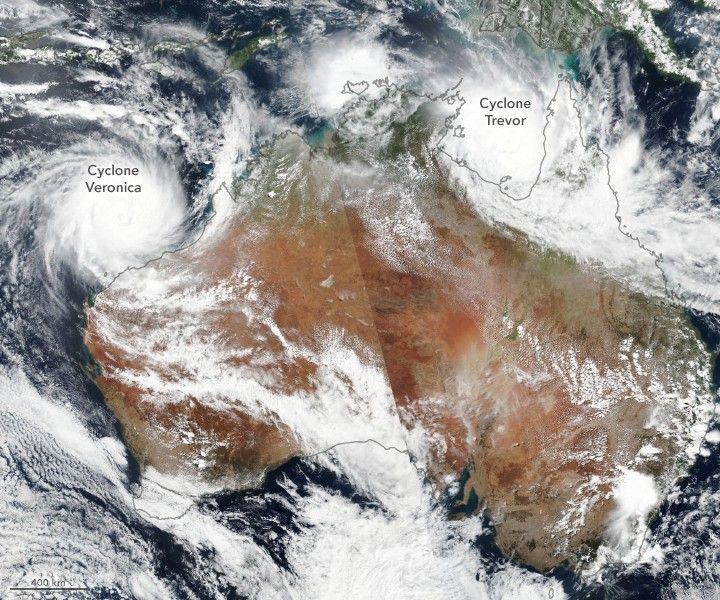
The map above shows rainfall accumulation from March 13 to March 20, 2019. Many areas received as much as 50 centimeters (20 inches) of rain. These data are remotely-sensed estimates that come from the Integrated Multi-Satellite Retrievals (IMERG), a product of the Global Precipitation Measurement (GPM) mission. Local rainfall amounts can be significantly higher when measured from the ground.
While the full scope of the damage remains unknown, preliminary estimates suggest that hundreds of people have been killed, thousands have been injured, and hundreds of thousands displaced. Tens of thousands of homes were damaged or destroyed. According to one report, the city of Beira alone had 100,000 people stranded and in need of rescue. About 400,000 people—three-quarters of the city’s population—have lost their homes, according to news reports.
While the worst of the floodwaters have begun to subside, observers expect this catastrophe will continue to unfold for several weeks and months. Rain continues to fall in many areas, and some places remain inaccessible because of flooding and damaged infrastructure, making it difficult for rescuers to provide help. In many areas, clean water is scarce, and unsanitary conditions have increased the risk of disease. With vast tracts of wheat and other crops destroyed by floodwaters, food shortages could become a problem in the coming weeks and months.
References & Resources
- European Space Agency (2019, March 20) Copernicus Sentinel-1 Maps Floods in Wake of Idai. Accessed March 21, 2019.
- Flood Observatory (2019) 2019-Malawi-4725. Accessed March 21, 2019.
- Floodlist (2019, March 19) Mozambique and Zimbabwe &;mdash Tropical Cyclone Idai Causes Death and Destruction. Accessed March 21, 2019.
- Reliefweb (2019, March 21) Tropical Cyclone Idai Maps. Accessed March 21, 2019.
- The Guardian (2019, March 21) Cyclone Idai: satellite images show extent of flooding around Beira . Accessed March 21, 2019.
- Weather Underground (2019, March 20) Africaâs Hurricane Katrina: Tropical Cyclone Idai Causes an Extreme Catastrophe. Accessed March 21, 2019.
- United Nations (2019, March 21) Idai disaster: Stranded victims still need rescue from heavy rains as UN scales up response. Accessed March 21, 2019.
NASA Earth Observatory images by Lauren Dauphin and Joshua Stevens, using MODIS data from NASA EOSDIS/LANCE and GIBS/Worldview, and iMERG data from the Global Precipitation Mission (GPM) at NASA/GSFC. Story by Adam Voiland.