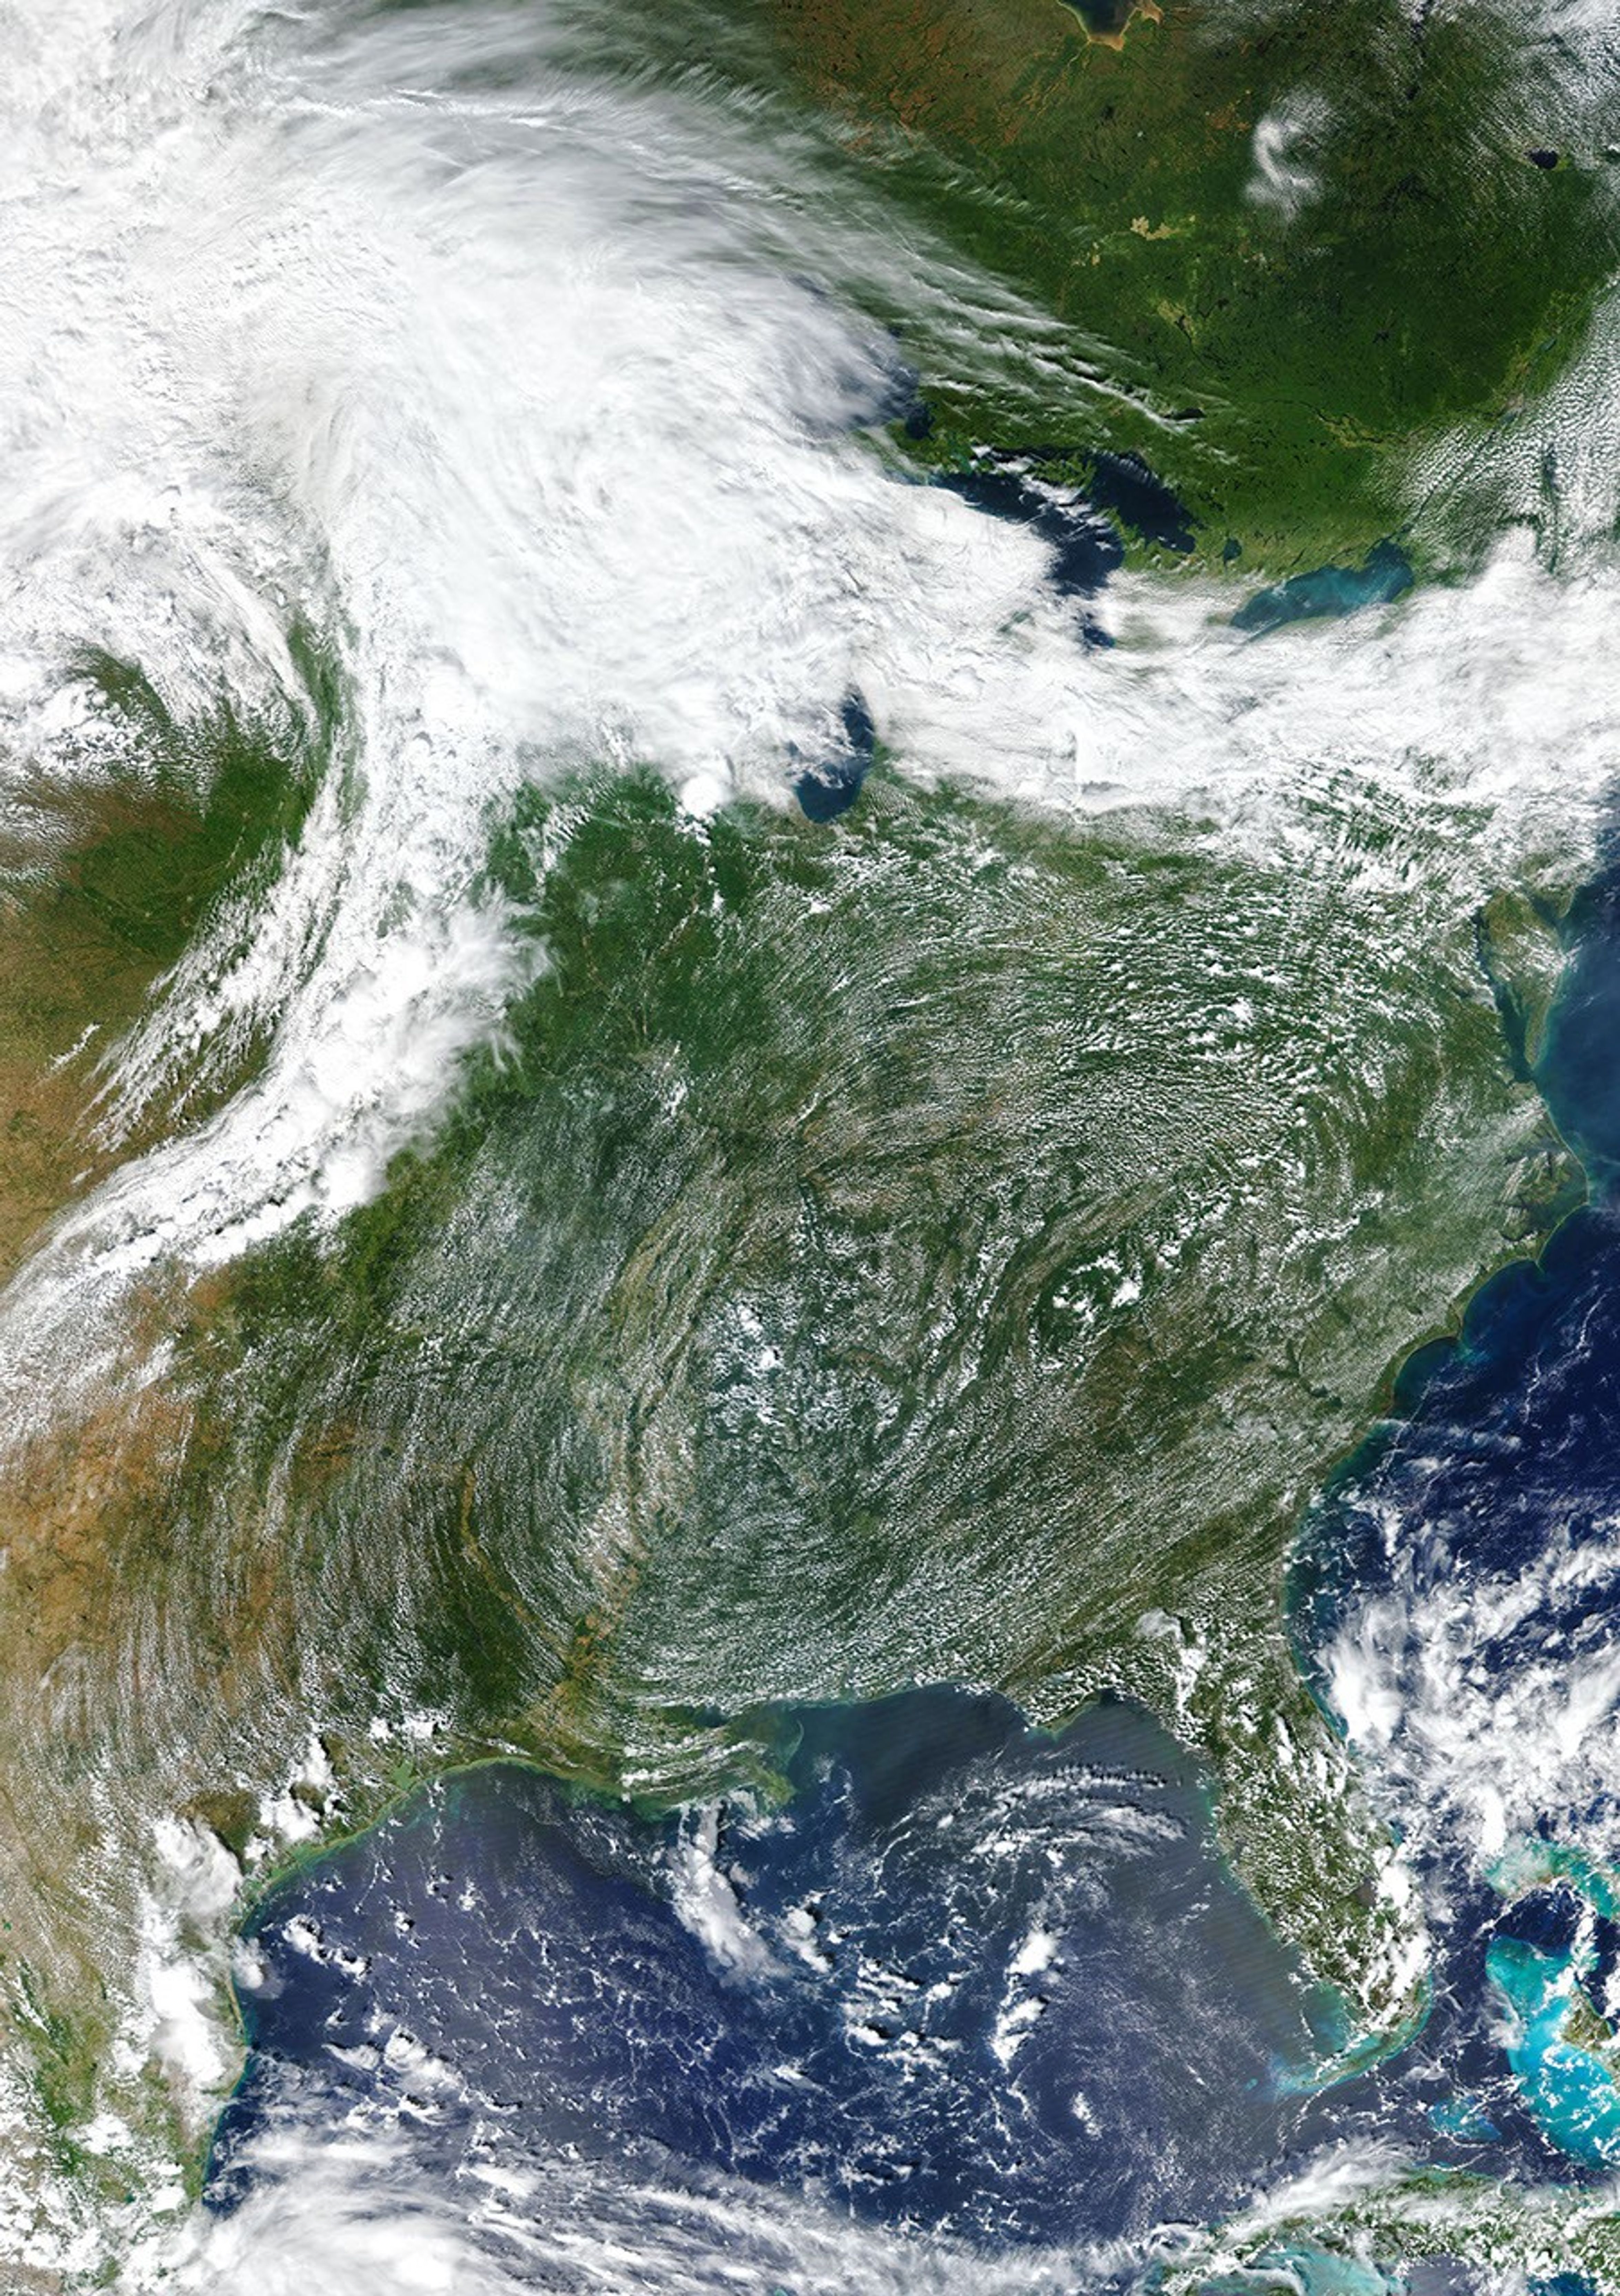


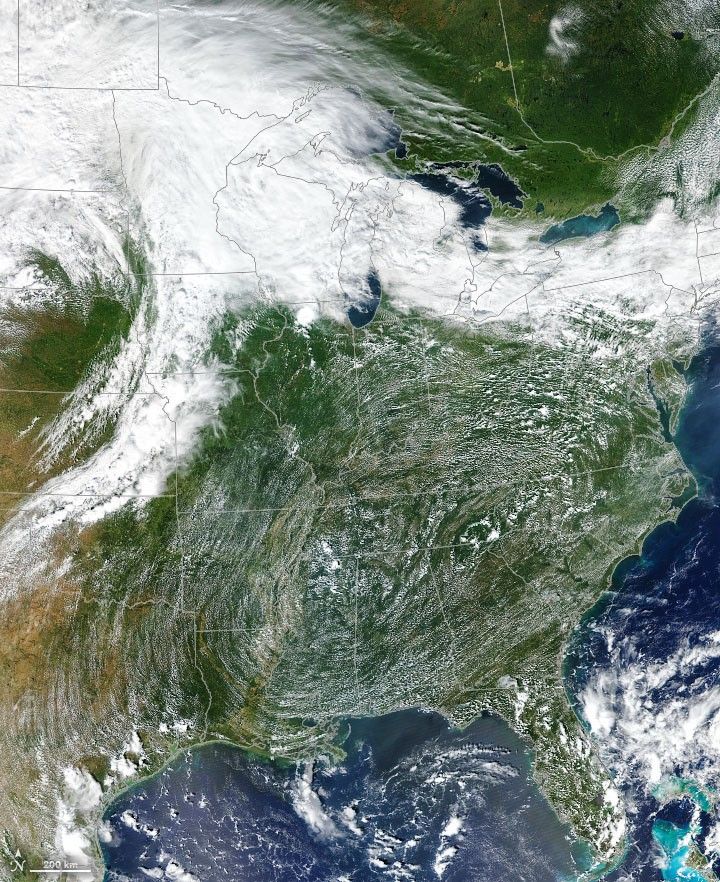
It is not every day that a textbook high-pressure system, cold front, and warm front all reveal themselves on the same natural-color satellite image. But that is exactly what NASA research meteorologist Galina Wind recently noticed over the Eastern United States as she was browsing old satellite imagery.
The image above is a mosaic based on data collected by the Moderate Resolution Imaging Spectroradiometer (MODIS) on NASA’s Aqua satellite and the Visible Infrared Imaging Radiometer Suite (VIIRS) on Suomi NPP on September 12, 2019. In the Southeast, thin rows of cumulus clouds trace the location of the high, with the center of circulation near Mississippi. High pressure systems typically have cool, descending air flow in their centers and winds that move in a clockwise direction in the Northern Hemisphere.
On weather maps, the center of a high is generally marked with a blue H. “But in natural-color satellite images, you usually see clear skies because the downward movement of the air is strong enough to prevent any convective clouds from rising up as the Sun heats the surface,” explained Wind. “In this case, the descending air was weak enough that some fair-weather cumulus clouds were able to bubble up anyway.”
The cold front, marked with blue triangles on a weather map, is visible here as a curving line of clouds with intense convection running through Minnesota, Iowa, Missouri, Kansas, and Oklahoma. While highs generally lead to sunny, calm conditions, cold fronts often produce turbulent, unsettled skies.
“If you have ever seen a snowplow going at full speed, you will have a sense of how cold fronts work,” said Wind. “Cold air is heavier than warm air, so it literally shoves warm air up in front and over it.” As the displaced, warmer air rises and cools, water vapor condenses, yielding clouds, rain, and often thunderstorms.
The video above, based on imagery from the Advanced Baseline Imager (ABI) on GOES 16 (GOES-East), shows how the weather system developed between 7 a.m. and 3 p.m. on September 12. The images were taken at 5 minute intervals.
As storm clouds bubbled up around the cold front, clouds swirled in a counter-clockwise direction around an area of low-pressure centered on South Dakota. East of the cold front, notice how the winds circulating around the high-pressure area flowed in the opposite direction. Though clouds in the high were generally small, look for the larger, deeper clouds that developed as air was forced upward by the Appalachian Mountains.
“Conditions can become quite fierce along cold fronts,” said Wind, noting that false-color imagery of the cold front does a particularly good job of highlighting the deep convection and thunderstorms that developed along it. The pink coloration in the false-color view of the cold front shows clouds that have grown tall enough for water droplets to turn into ice particles. (This story has more information about interpreting false-color images.)
The warm front, normally shown with red half circles on a weather map, is marked here by the wide band of clouds through Minnesota, Wisconsin, and Michigan. “Warm front events are much calmer. They are basically just layers and layers of clouds,” said Wind. “Sometimes warm fronts can produce drizzle, but they generally come and go as gently as a lamb.”
However, the leading wave of clouds that precedes a warm front can often indicate that more serious weather may be on the way. “If it is a clear, sunny day and you suddenly notice the arrival of large numbers of thin, feathery cirrus clouds, that is a clue that the weather could be changing soon,” said Wind.
References & Resources
- AccuWeather What are high pressure systems and how do they contribute to our weather? Accessed March 4, 2020.
- Climate & Weather Characterstics of world weather and climate. Accessed March 4, 2020.
- National Geographic Front. Accessed March 4, 2020.
- Met Office High and Low Pressure. Accessed March 4, 2020.
- SciJinks How to Read a Weather Map. Accessed March 4, 2020.
- UCAR The Highs and Lows of Air Pressure. Accessed March 4, 2020.
- UCAR What is a Front? Accessed March 4, 2020.
NASA Earth Observatory images by Joshua Stevens, using GOES-16 data from the NOAA-NASA GOES-R Mission, and MODIS and VIIRS data from NASA EOSDIS/LANCE and GIBS/Worldview and the Suomi National Polar-orbiting Partnership. Story by Adam Voiland.