


![Request for Information – Potential [Placeholder for Prize]](https://assets.science.nasa.gov/dynamicimage/assets/science/psd/solar/2023/09/s/solarsystem_0.jpg?w=1024)


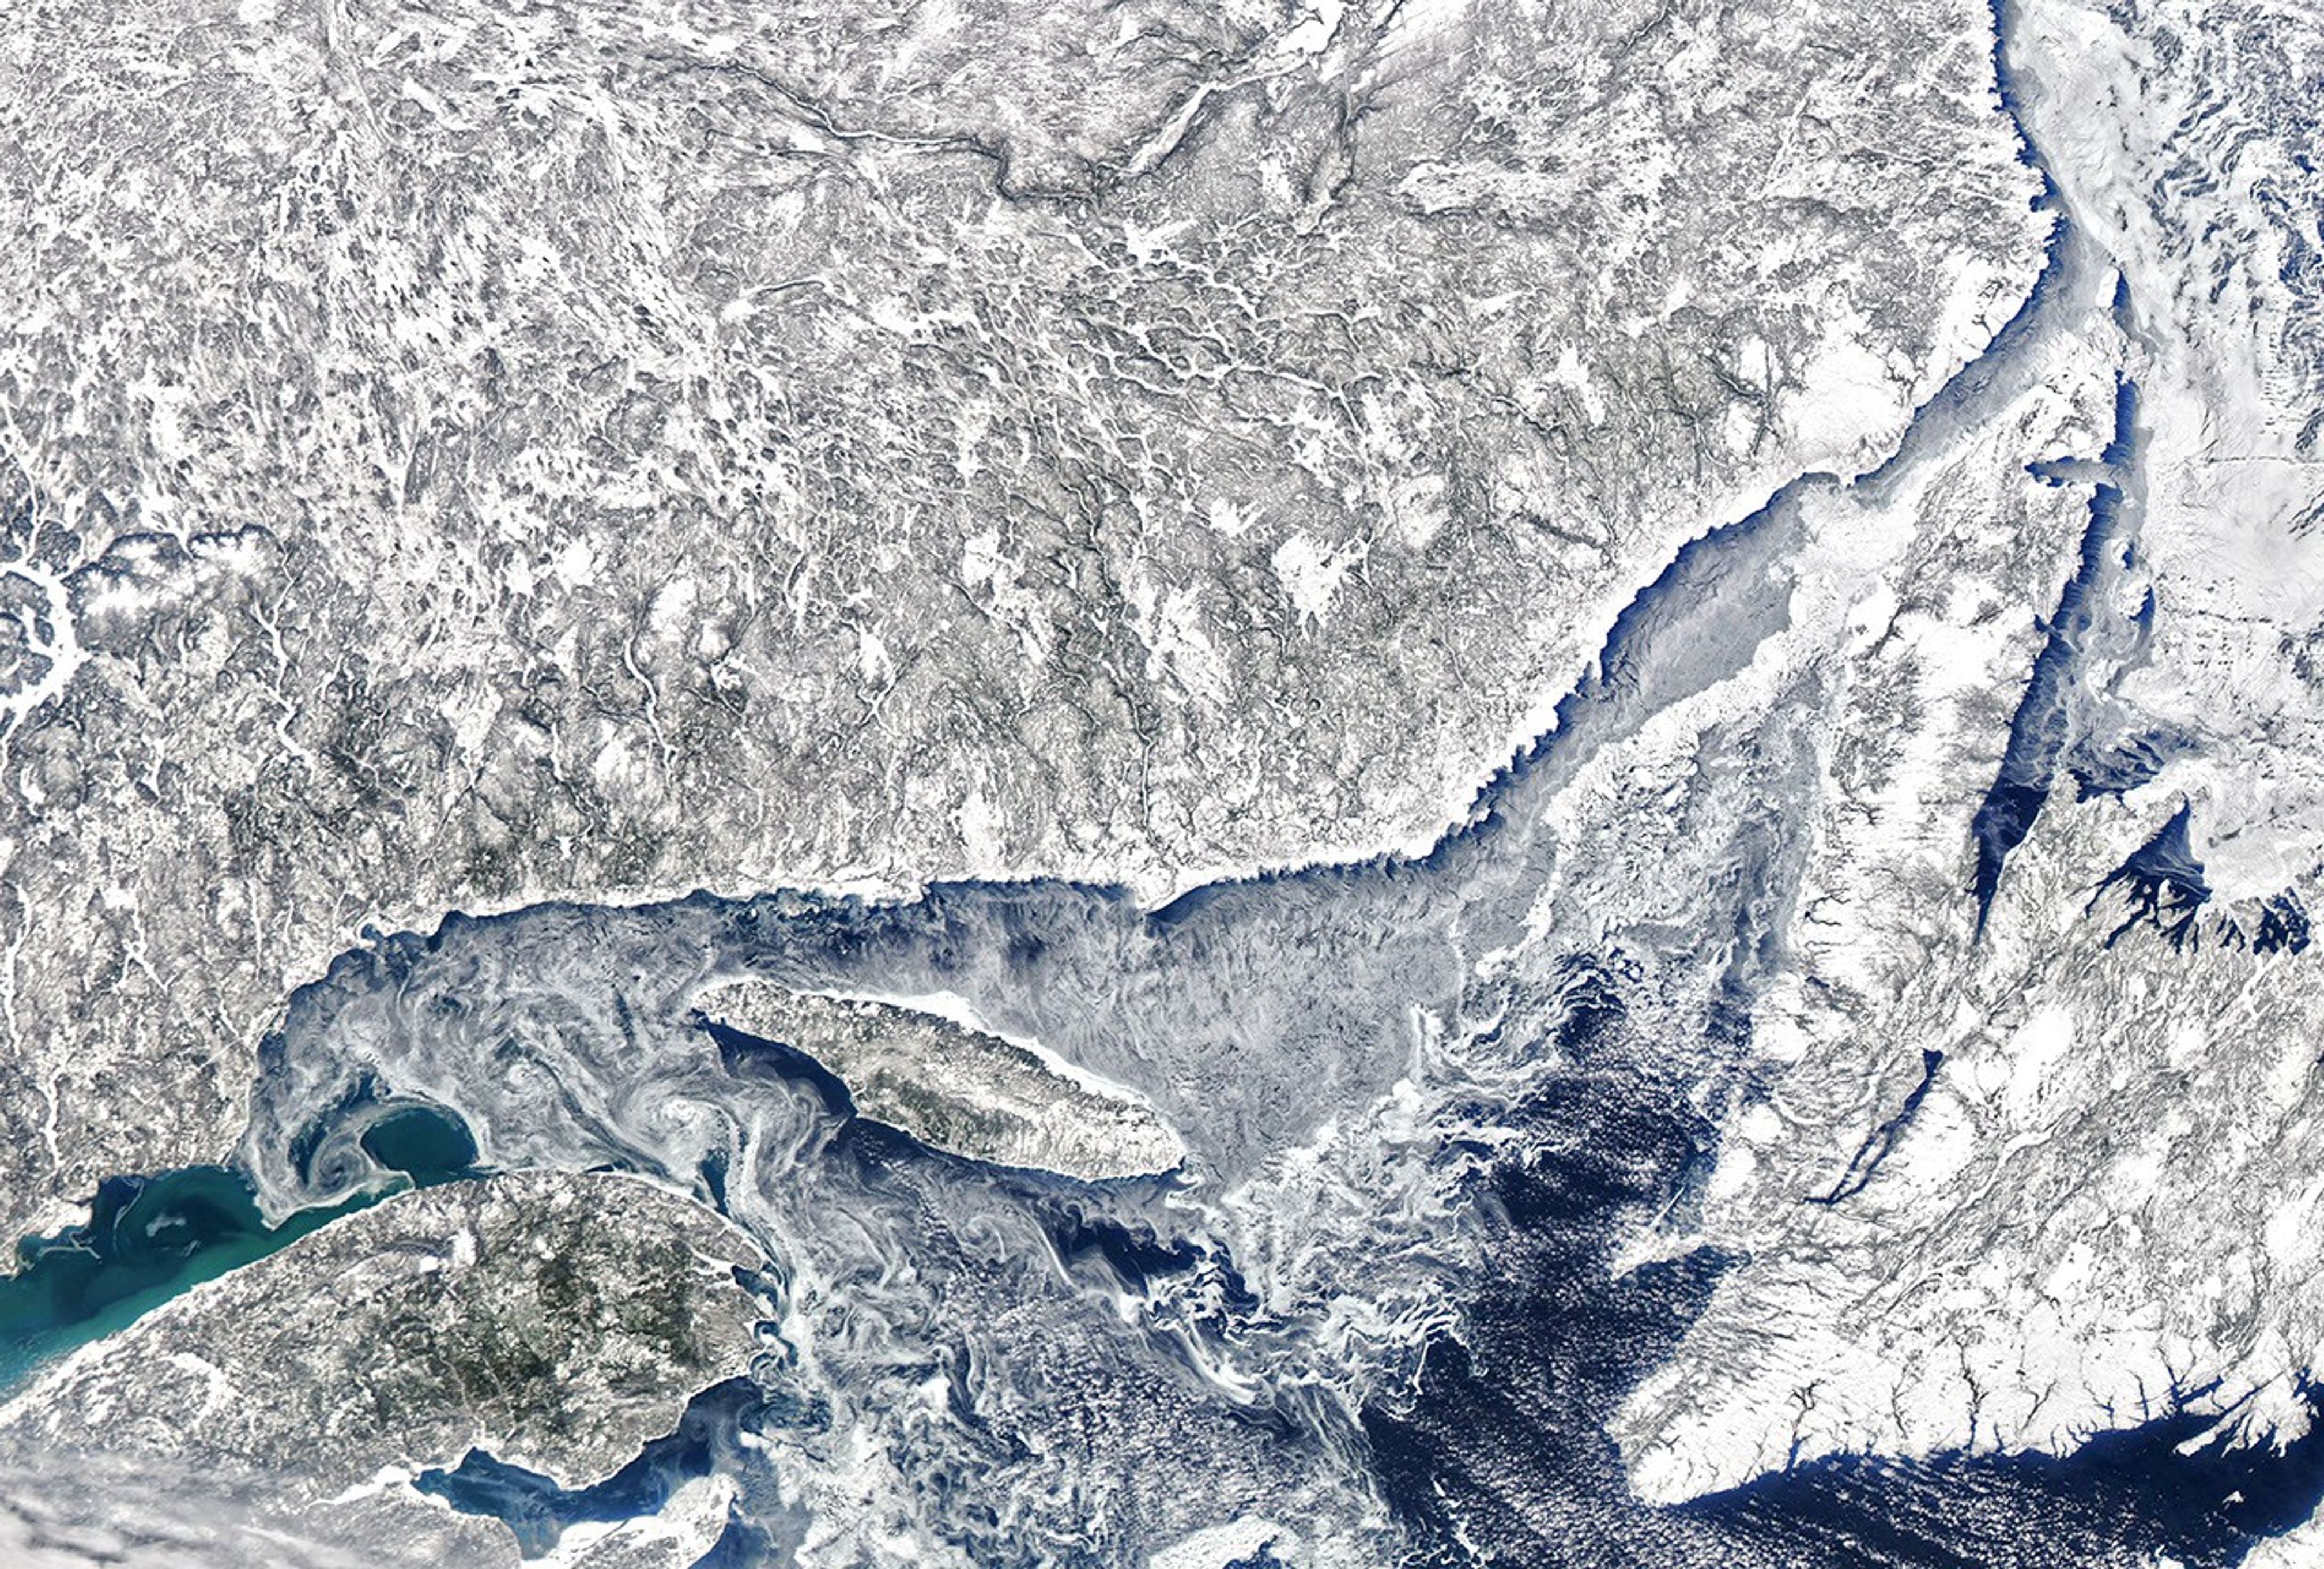
The planet’s oceans are constantly in motion, but the movement is not always easy to see from space. Sometimes colorful sediment and phytoplankton act as tracers, detailing the path of currents and eddies. In colder months, the swirling patterns are sometimes traced by sea ice.
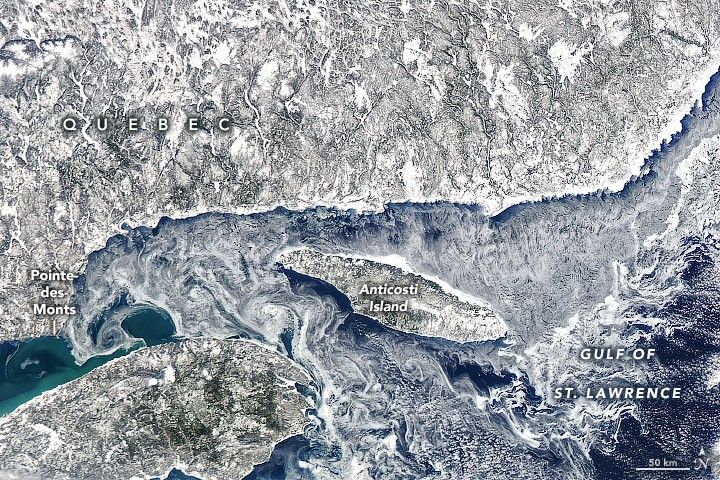
On March 9, 2020, the Moderate Resolution Imaging Spectroradiometer (MODIS) on NASA’s Aqua satellite acquired this image of sea ice and eddies in the northwestern Gulf of St. Lawrence. The ice was thin enough at the time to be moved around by winds and currents, forming delicate patterns around Anticosti Island in Quebec, Canada.
You can see the motion in the video below, which spans most of the daylight hours on March 9. The video uses imagery from the Advanced Baseline Imager (ABI) on GOES 16 (GOES-East). GOES satellites are operated by the National Oceanic and Atmospheric Administration (NOAA); NASA helps develop and launch them.
March is typically the time of year when the cap of Arctic sea ice stops growing and begins to melt. But Arctic sea ice can be highly variable depending on where you look, which is why scientists describe sea ice conditions by region. The largest of those regions is the central Arctic Ocean. But the waters around the periphery—the seas, bays, and the Gulf of St. Lawrence—also account for a portion of Arctic sea ice.
Some of the ice in the gulf originates in the Arctic Ocean and is carried by winds and currents into Baffin Bay and the Gulf of St. Lawrence. But plenty of the ice forms locally, and amounts can rise or fall from day to day depending on the weather. The government of Canada issues ice forecasts for the region, and noted on March 13 that areas of new ice and gray ice were expected from Pointe-des-Monts to Anticosti Island. These young, thin ice types are quite malleable and at the mercy of currents, winds, and tides.
References & Resources
- Defense Mapping Agency, Hydrographic/Topographic Center (2000, December 31) Sailing Directions (enroute).: Nova Scotia and the Saint Lawrence..
- Facebook: NOAA Satellite and Information Service (2018, March 9) GOES East sees ice eddies in the Labrador Sea. Accessed March 13, 2020.
- Government of Canada (2020, March 13) Ice Forecasts for the Gulf of St. Lawrence. Accessed March 13, 2020.
- NASA Earth Observatory (2016, September 19) Water Swirls, Gulf of St. Lawrence.
- NASA MODIS (2020, February 28) Sea Ice in the Gulf of St. Lawrence. Accessed March 13, 2020.
- NASA MODIS (2019, July 20) Gulf of St. Lawrence. Accessed March 13, 2020.
- NOAA Regional Sea Ice. Accessed March 13, 2020.
- Urrego-Blanco, J. and Sheng, J. (204) Formation and distribution of sea ice in the Gulf of St. Lawrence: A process-oriented study using a coupled ocean-ice model. JGR Oceans, 119 (10), 7099â7122.
NASA Earth Observatory images by Joshua Stevens, using GOES-16 data from the NOAA-NASA GOES-R Mission, and MODIS data from NASA EOSDIS/LANCE and GIBS/Worldview. Text by Kathryn Hansen.