


- July 12-19, 2005 (3.8 MB)
- July 12-19, 2005 (3.45 MB)
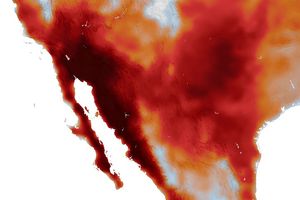
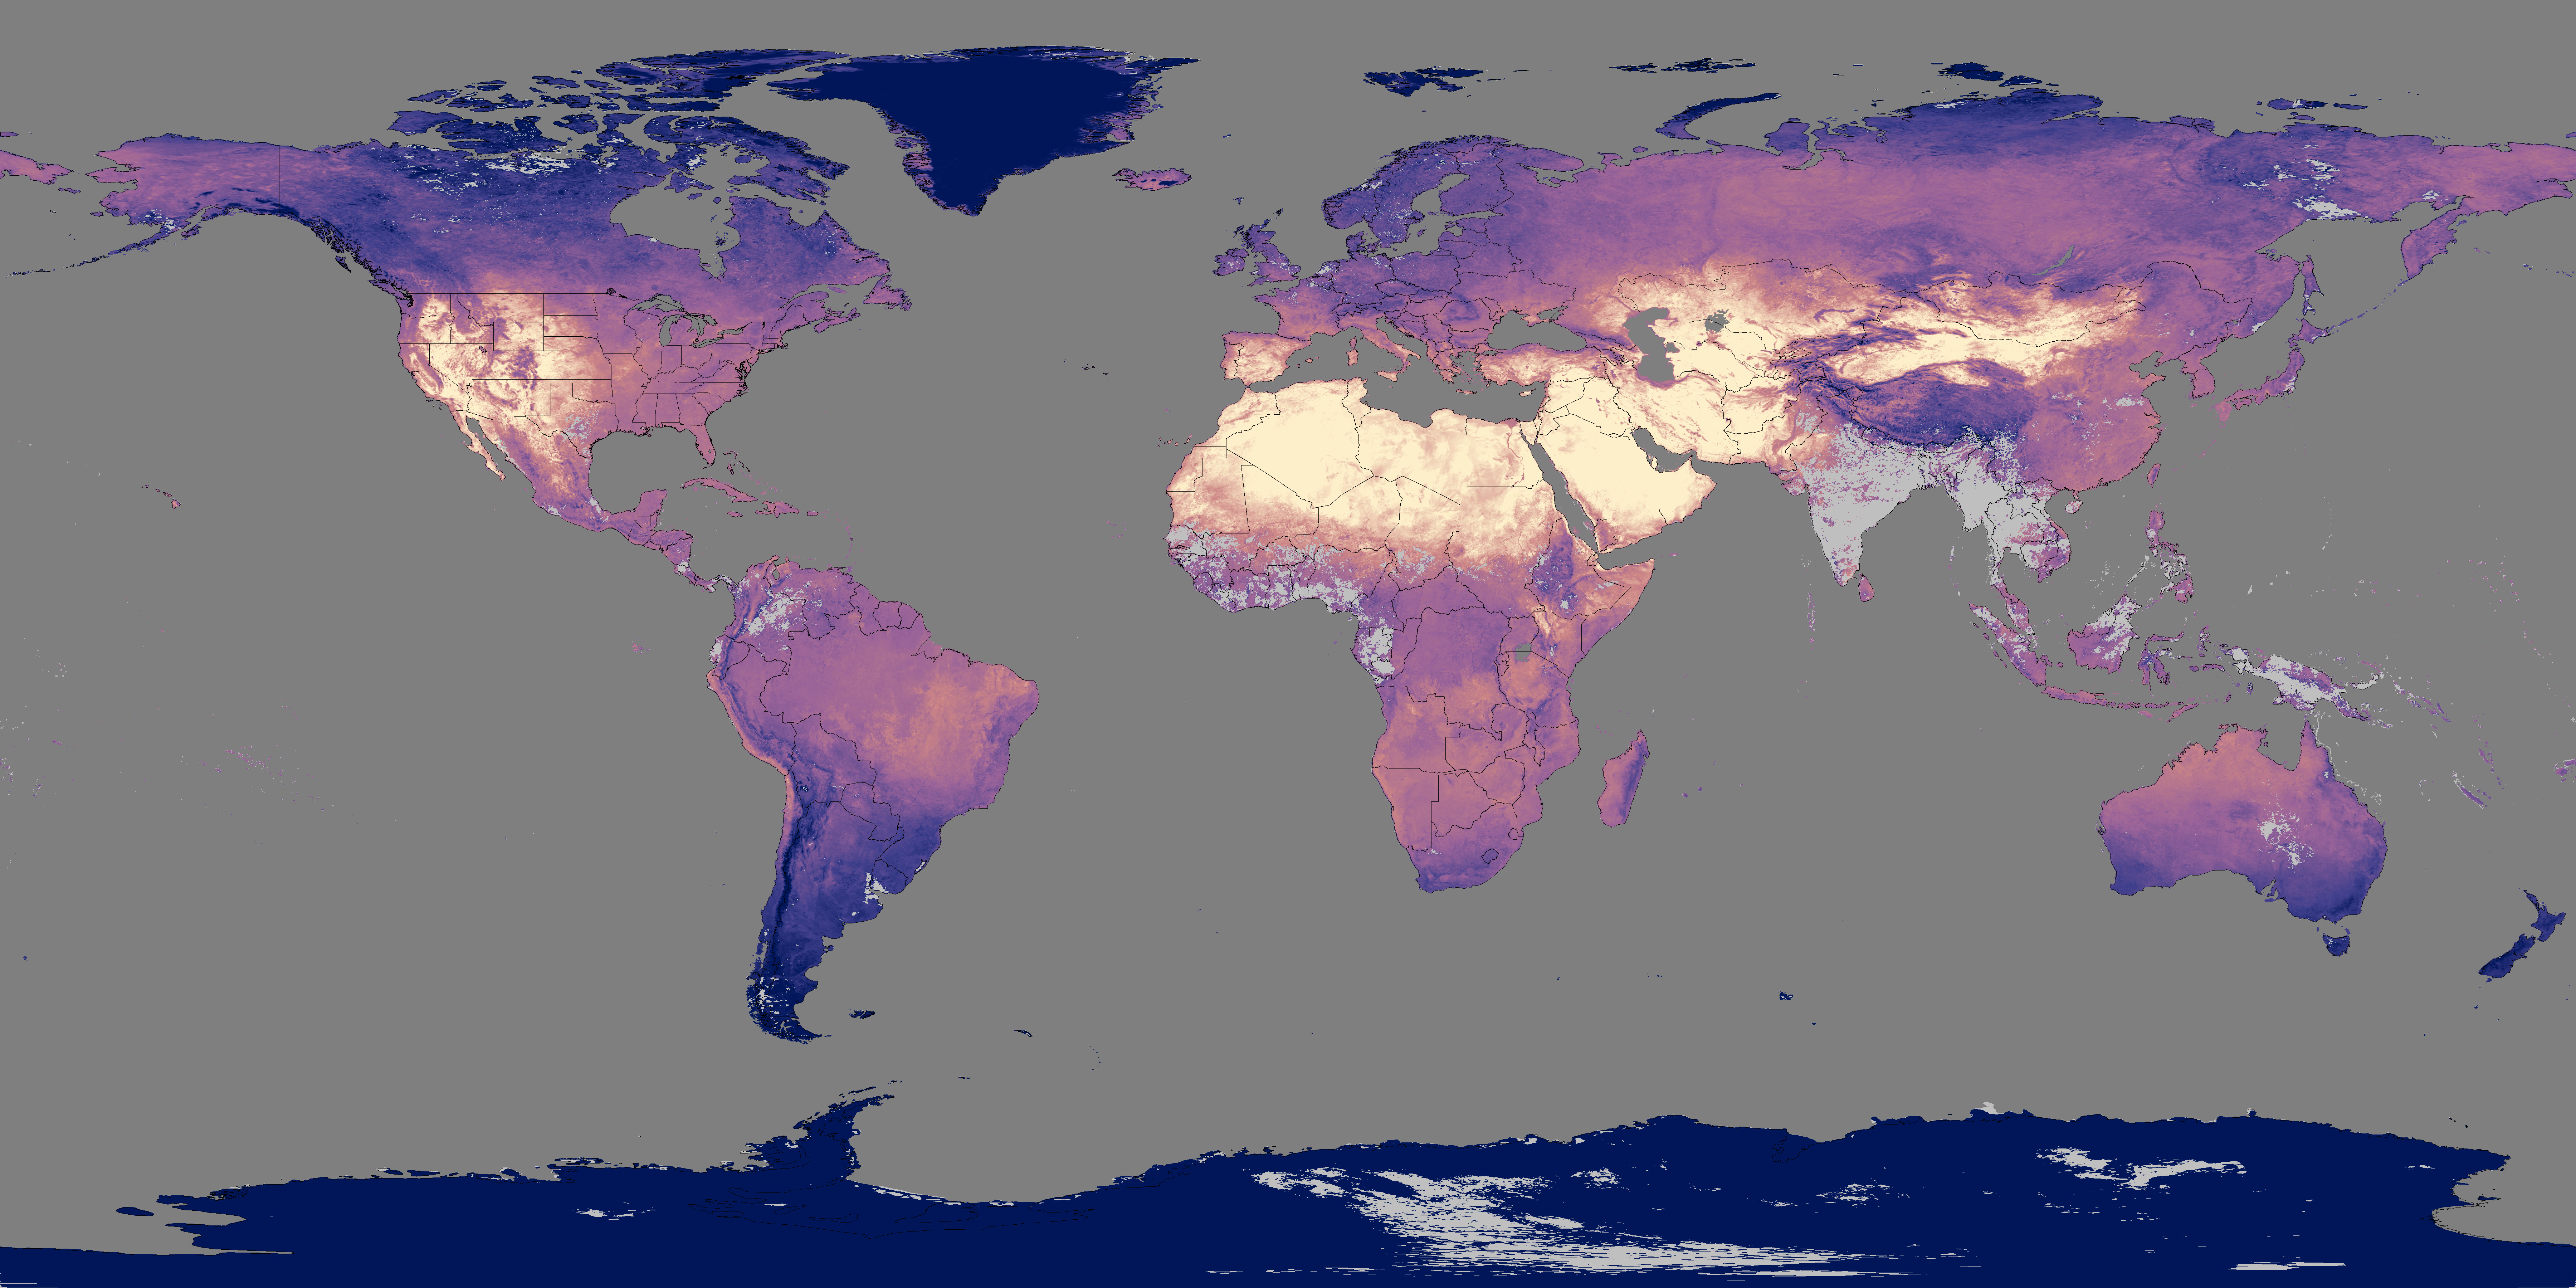
Sweltering temperatures dominated weather maps across the United States in July 2005 as a heat wave rolled over the country. Between July 12 and July 19, the heat sat over the southwest, where Arizona, California, Nevada, and New Mexico all experienced days of above-normal temperatures. By the following week, the heat had spread to the Midwest and East.
These surface temperature images track the heat wave as it moved across the United States. Between July 12 and July 19, the yellow that represents warm temperatures covered the Southwest. The East was a cooler purple with regions of even cooler blue. By the following week, top, the Eastern seaboard had warmed, with orange tones creeping in among the purple. The cool blue is gone entirely. A warm streak also extends from Texas diagonally northeast to the southwestern tip of Lake Michigan where Chicago is located. The Southwest, meanwhile, had cooled. Both of these surface temperature images were created with data collected by the Moderate Resolution Imaging Spectroradiometer (MODIS) on NASA’s Terra satellite.
References & Resources
NASA image created by Jesse Allen, Earth Observatory, using data provided courtesy of Dr. Z. Wan, MODIS Land Science Team.


