


July 2011 brought excessively hot weather to much of the United States, stressing electric power grids, exacerbating droughts, and causing dozens of heat-related deaths. Nearly 200 million Americans already know this without a map; the National Climatic Data Center (NCDC) estimates that at least that many people have been affected by the heat wave.
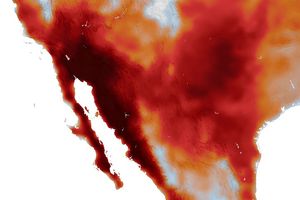
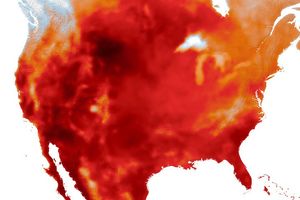
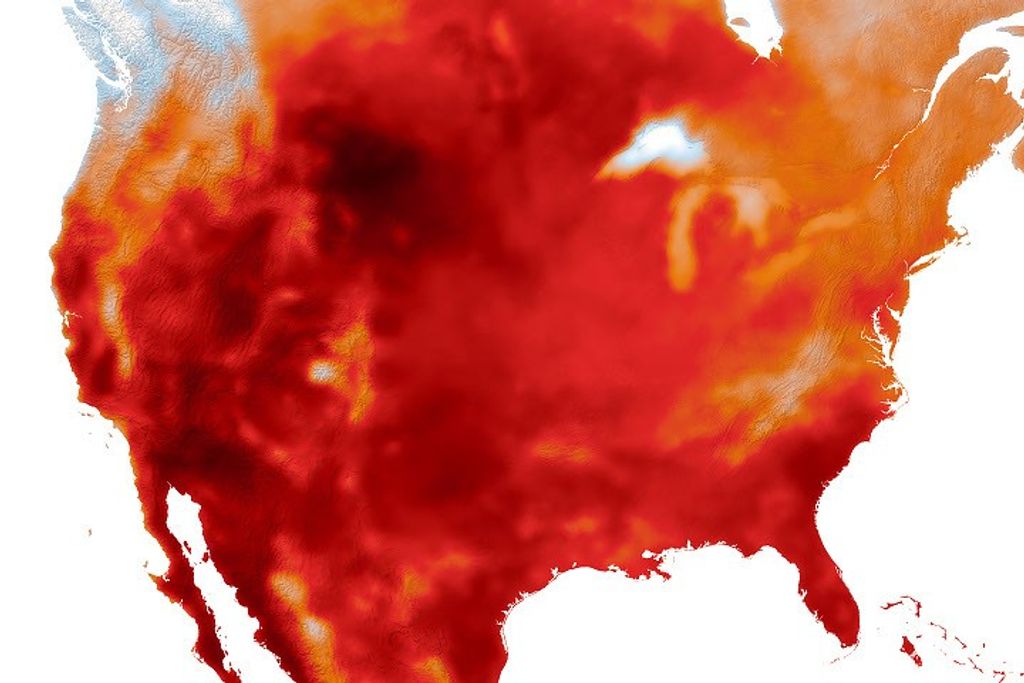
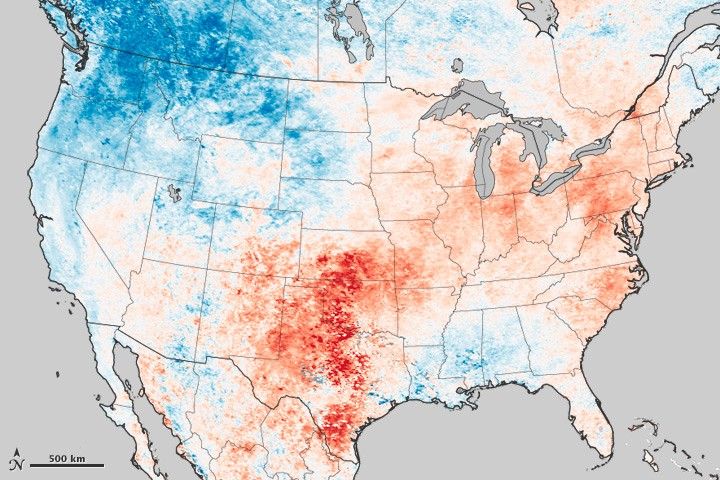
The map above shows land surface temperature anomalies for July 20 to 27, 2011, the height of the heat wave in much of the southern, midwestern, and eastern regions. Rather than depicting absolute temperatures, the maps shows how much the average temperature for that one week differed from the long-term average for that week for that region. Temperature measurements were collected by the Moderate Resolution Imaging Spectroradiometer (MODIS) on NASA’s Terra satellite. Reds indicate temperatures that were warmer than average, and blues below average. Oceans, lakes, and areas with insufficient data (usually because of persistent clouds) appear in gray.
According to preliminary data from NCDC, 2,755 daily records were set across the country for daily high temperatures, including at least one in every state. At least 78 all-time record high temperatures were set or tied at various locations around the United States. The highest temperature was 117 degrees Fahrenheit (47 Celsius) on July 12 in Shamrock, Texas. By August 3, Dallas had experienced 34 consecutive days of temperatures above 100F (38C); Oklahoma City had crossed that threshold 41 times this year.
More compelling were the daily lows, with 6,171 records set for the highest minimum temperatures for July. In Ponca City, Oklahoma, the overnight low on July 26 was 91 degrees Fahrenheit (33C). The pattern of warmer nights fits with a longer trend noted in a recent NOAA report.
References & Resources
- Dallas Morning News (2011, August 4) ERCOT warns of ââ¬Ëhigh probability’ of rolling blackouts as heat wave strains power grid. Accessed August 5, 2011.
- LiveScience (2011, August 1) All 50 States See Record Highs in July. Accessed August 5, 2011.
- National Weather Service (2011) July 2011 - Oppressive Heat Locally and Across the Nation. Accessed August 5, 2011.
- NOAA (2011, July 22) Heat wave sweeps across the U.S. Accessed August 5, 2011.
- The Oklahoman (2011, August 3) Heat death toll rises to 13 in Oklahoma. Accessed August 5, 2011.
- The Washington Post (2011, July 31 ) July heat in Washington was unprecedented. Accessed August 5, 2011.
NASA Earth Observatory image created by Jesse Allen, using data obtained from the Land Processes Data Active Archive Cemter (LPDAAC) data pool.