


Over the past three decades, temperatures have risen faster in the Arctic than anywhere else in the world. Consequently, the growing season has gotten longer in the far northern latitudes, bringing major changes to plant communities in tundra and boreal (also known as taiga) ecosystems.
For decades, instruments on various NASA and NOAA satellites have continuously monitored vegetation from space. The Moderate Resolution Imaging Spectroradiometer (MODIS) and Advanced Very High Resolution Radiometer (AVHRR) instruments measure the intensity of visible and near-infrared light reflecting off of plant leaves. Scientists use that information to calculate the Normalized Difference Vegetation Index (NDVI), an indicator of photosynthetic activity, or the “greenness” of the landscape.
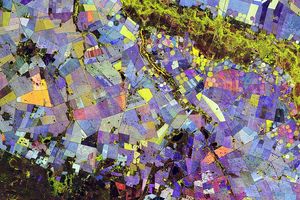
The maps above show NDVI trends between July 1982 and December 2011 for the northern portions of North America and Eurasia. Shades of green depict areas where plant productivity and abundance increased; shades of brown show where photosynthetic activity declined. There was no significant trend in areas that are white, and areas that are gray were not included in the study. An international team of university and NASA scientists published their analysis of the NDVI data in Nature Climate Change in March 2013.
The maps show a ring of greening in the treeless tundra ecosystems of the circumpolar Arctic—the northernmost parts of Canada, Russia, and Scandinavia. Tall shrubs and trees started to grow in areas that were previously dominated by tundra grasses. The researchers concluded that plant growth had increased by 7 to 10 percent overall.
However, boreal forests, particularly those in North America, showed a different response to warming. Many boreal forests greened, but the trend was not as strong as it was for tundra of the circumpolar Arctic. In North America, some boreal forests actually experienced “browning” (less photosynthetic activity) over the study period. Droughts, forest fire activity, animal and insect behavior, industrial pollution, and a number of other factors may have contributed to the browning.
“Satellite data identify areas in the boreal zone that are warmer and drier and other areas that are warmer and wetter,” explained co-author Ramakrishna Nemani of NASA’s Ames Research Center. “Only the warmer and wetter areas support more growth.”
“We found more plant growth in the boreal zone from 1982 to 1992 than from 1992 to 2011, because water limitations were encountered in the later two decades of our study,” added co-author Sangram Ganguly of the Bay Area Environmental Research Institute and NASA Ames.
Related Reading
- Earth Observatory (2002, August 20) The Migrating Boreal Forest. Accessed March 13, 2013.
References & Resources
- Boston University Climate and Vegetation Research Group Temperature and Vegetation Seasonality Diminishment over Northern Lands. Accessed March 13, 2013.
- Boston University (2013, March 10) Amplified greenhouse effect shaping North into South (pdf). Accessed March 13, 2013.
- NASA (2013, March 10) Amplified greenhouse effect shaping North into South. Accessed March 13, 2013.
- Xu, L. et al (2013, March 10) Temperature and vegetation seasonality diminishment over northern lands. Nature Climate Change, 3(3). Accessed March 13, 2013.
NASA Earth Observatory image by Robert Simmon, using MODIS and AVHRR data from the Boston University’s Climate and Vegetation Research Group. Caption by Adam Voiland with information from Kathryn Hansen.