


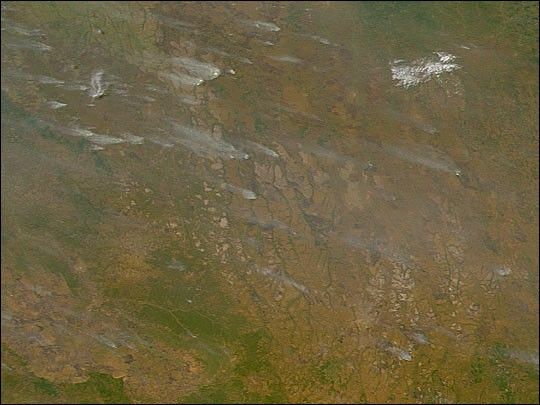


Vegetation indices are important tools in the monitoring,mapping, and resource management of the Earth's terrestrial vegetation.They are radiometric measures of the amount, structure, and condition ofvegetation which serve as useful indicators of seasonal and inter-annualvariations in vegetation. 16 days of Moderate Resolution Imaging Spectroradiometer(MODIS) images from the period from March 5 through March 20, 2000,were atmospherically corrected and then composited. The resultingcomposited reflectances in the first 4 bands of MODIS (blue, green, red,and near infrared) were then used as input into the computation of the NDVI and EVI.
The MODIS sensor offers many improvements for vegetation index products,including improved sensitivity to chlorophyll and less contamination byatmospheric water vapor through narrower bandwidths in the red and near infrared,respectively. In addition, the finer pixel size (250 meter red and nearinfrared bands) provides improved vegetation index monitoring and changedetction capability. The MODIS vegetation index products are produced atspatial resolutions of 250m, 500m, 1km and 0.25 degrees, and at temporal intervalsof 16 days and 1 month. They include twovegetation index formulations, the normalized difference vegetation index, NDVI, whichwill serve as a 'continuity' index to extend the Advanced Very High Resolutiuon RadiometerNDVI data record. An improved, or enhanced vegetation index (EVI) is also produced with thegoal of providing complementary information on the spatial andtemporal variations of vegetation, while minimizing much of the contamination problemspresent in the NDVI, such as those associated with canopy background andresidual aerosol influences. Whereas the NDVI is chlorophyllsensitive and responds mostly to red band variations, the EVI is more NIRsensitive and responsive to canopy structural variations, including leaf area index,canopy type, and canopy architecture.
To view vegetation data over time, go toVegetation in Data & Images.<!--
For more technical information about MODIS vegetation indices, visitthe University of Arizona MODIS VI page.-->
References & Resources
Images and text courtesy the Department of Soil, Water, and Environmental Sciences at the University of Arizona
None