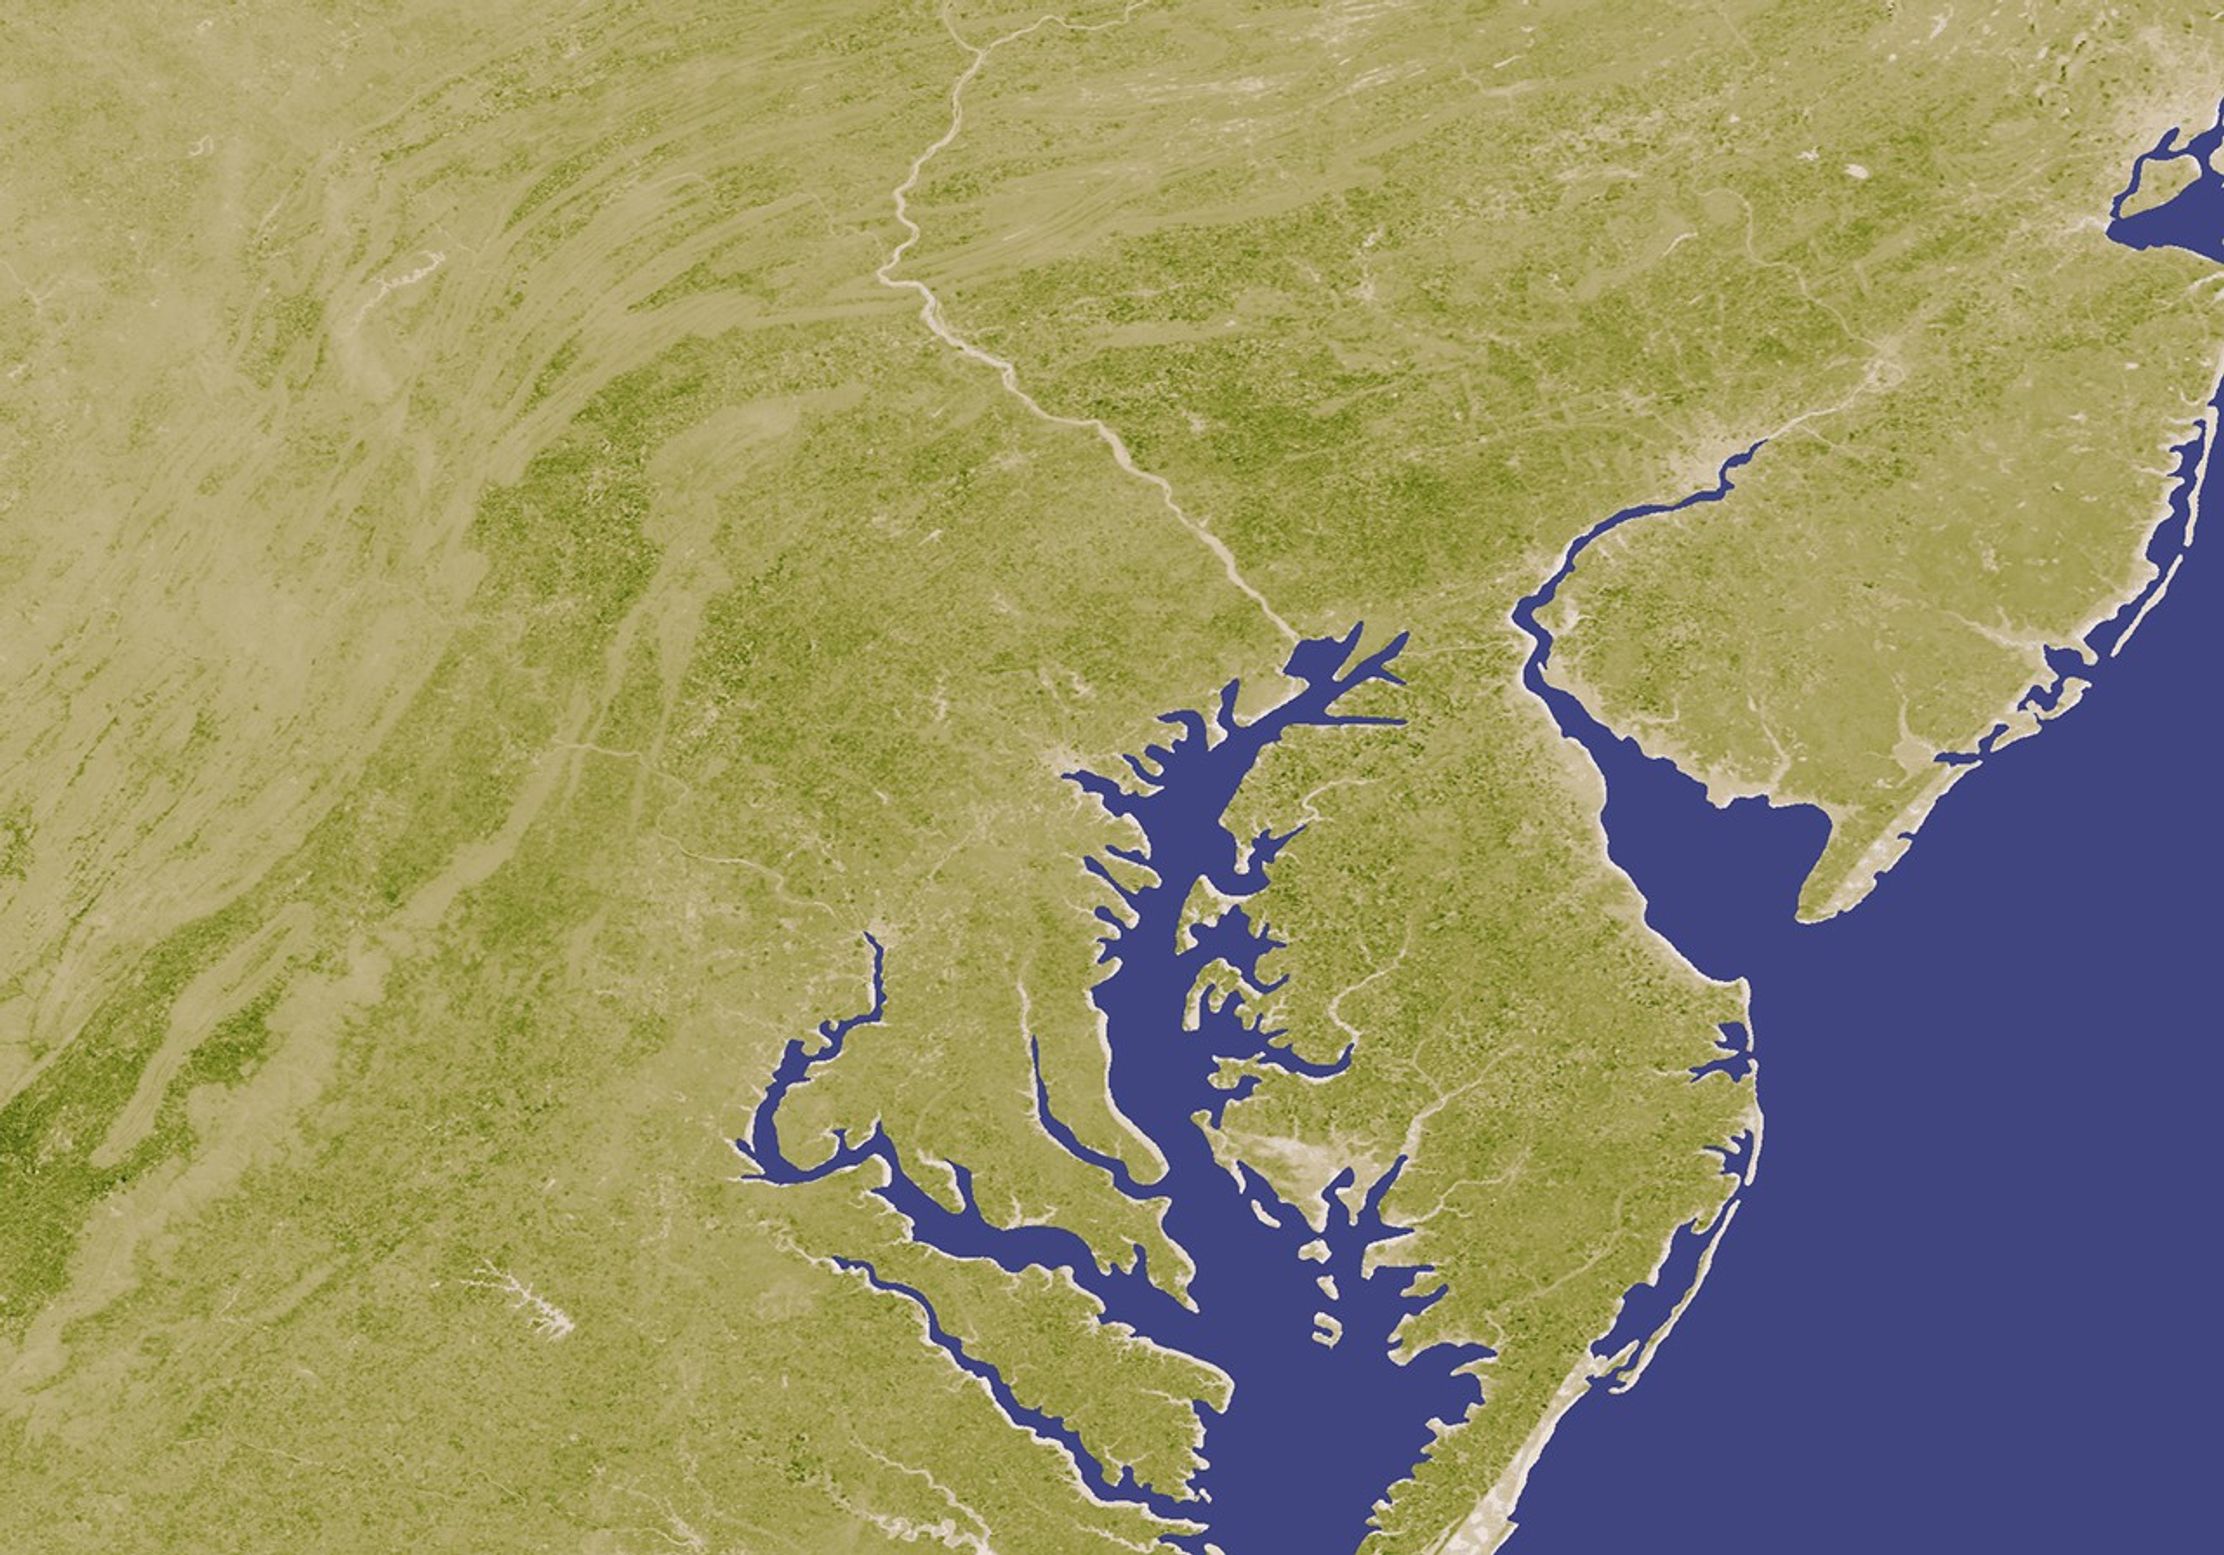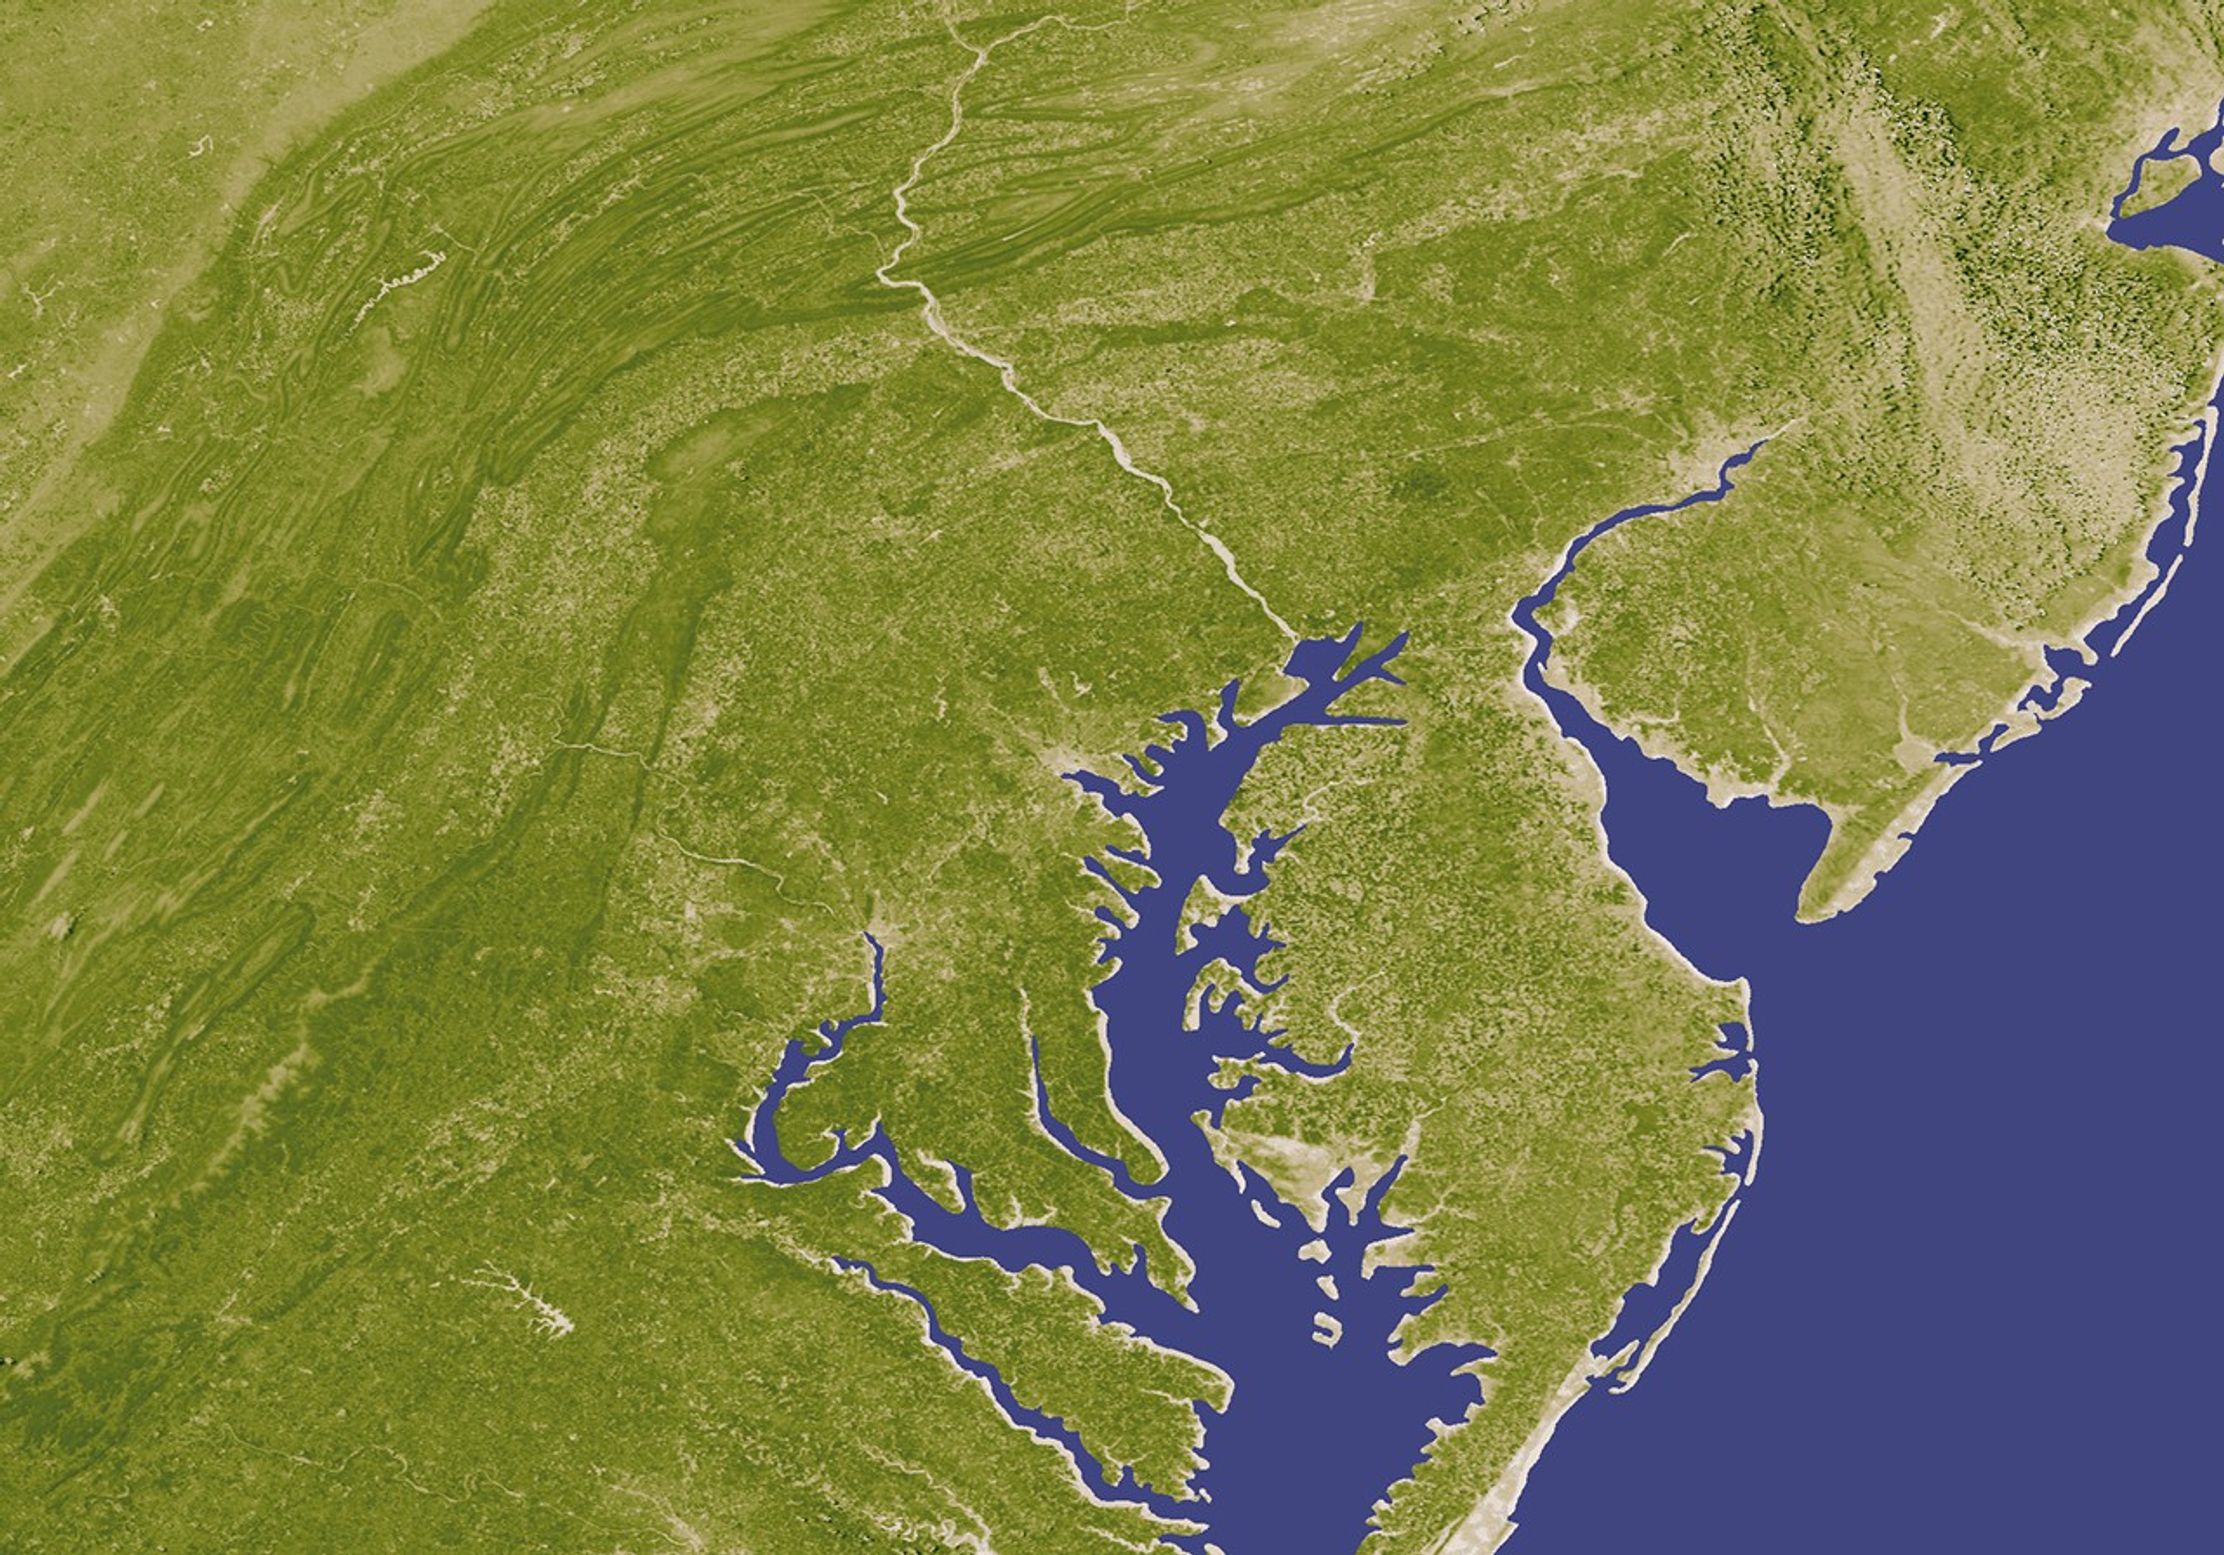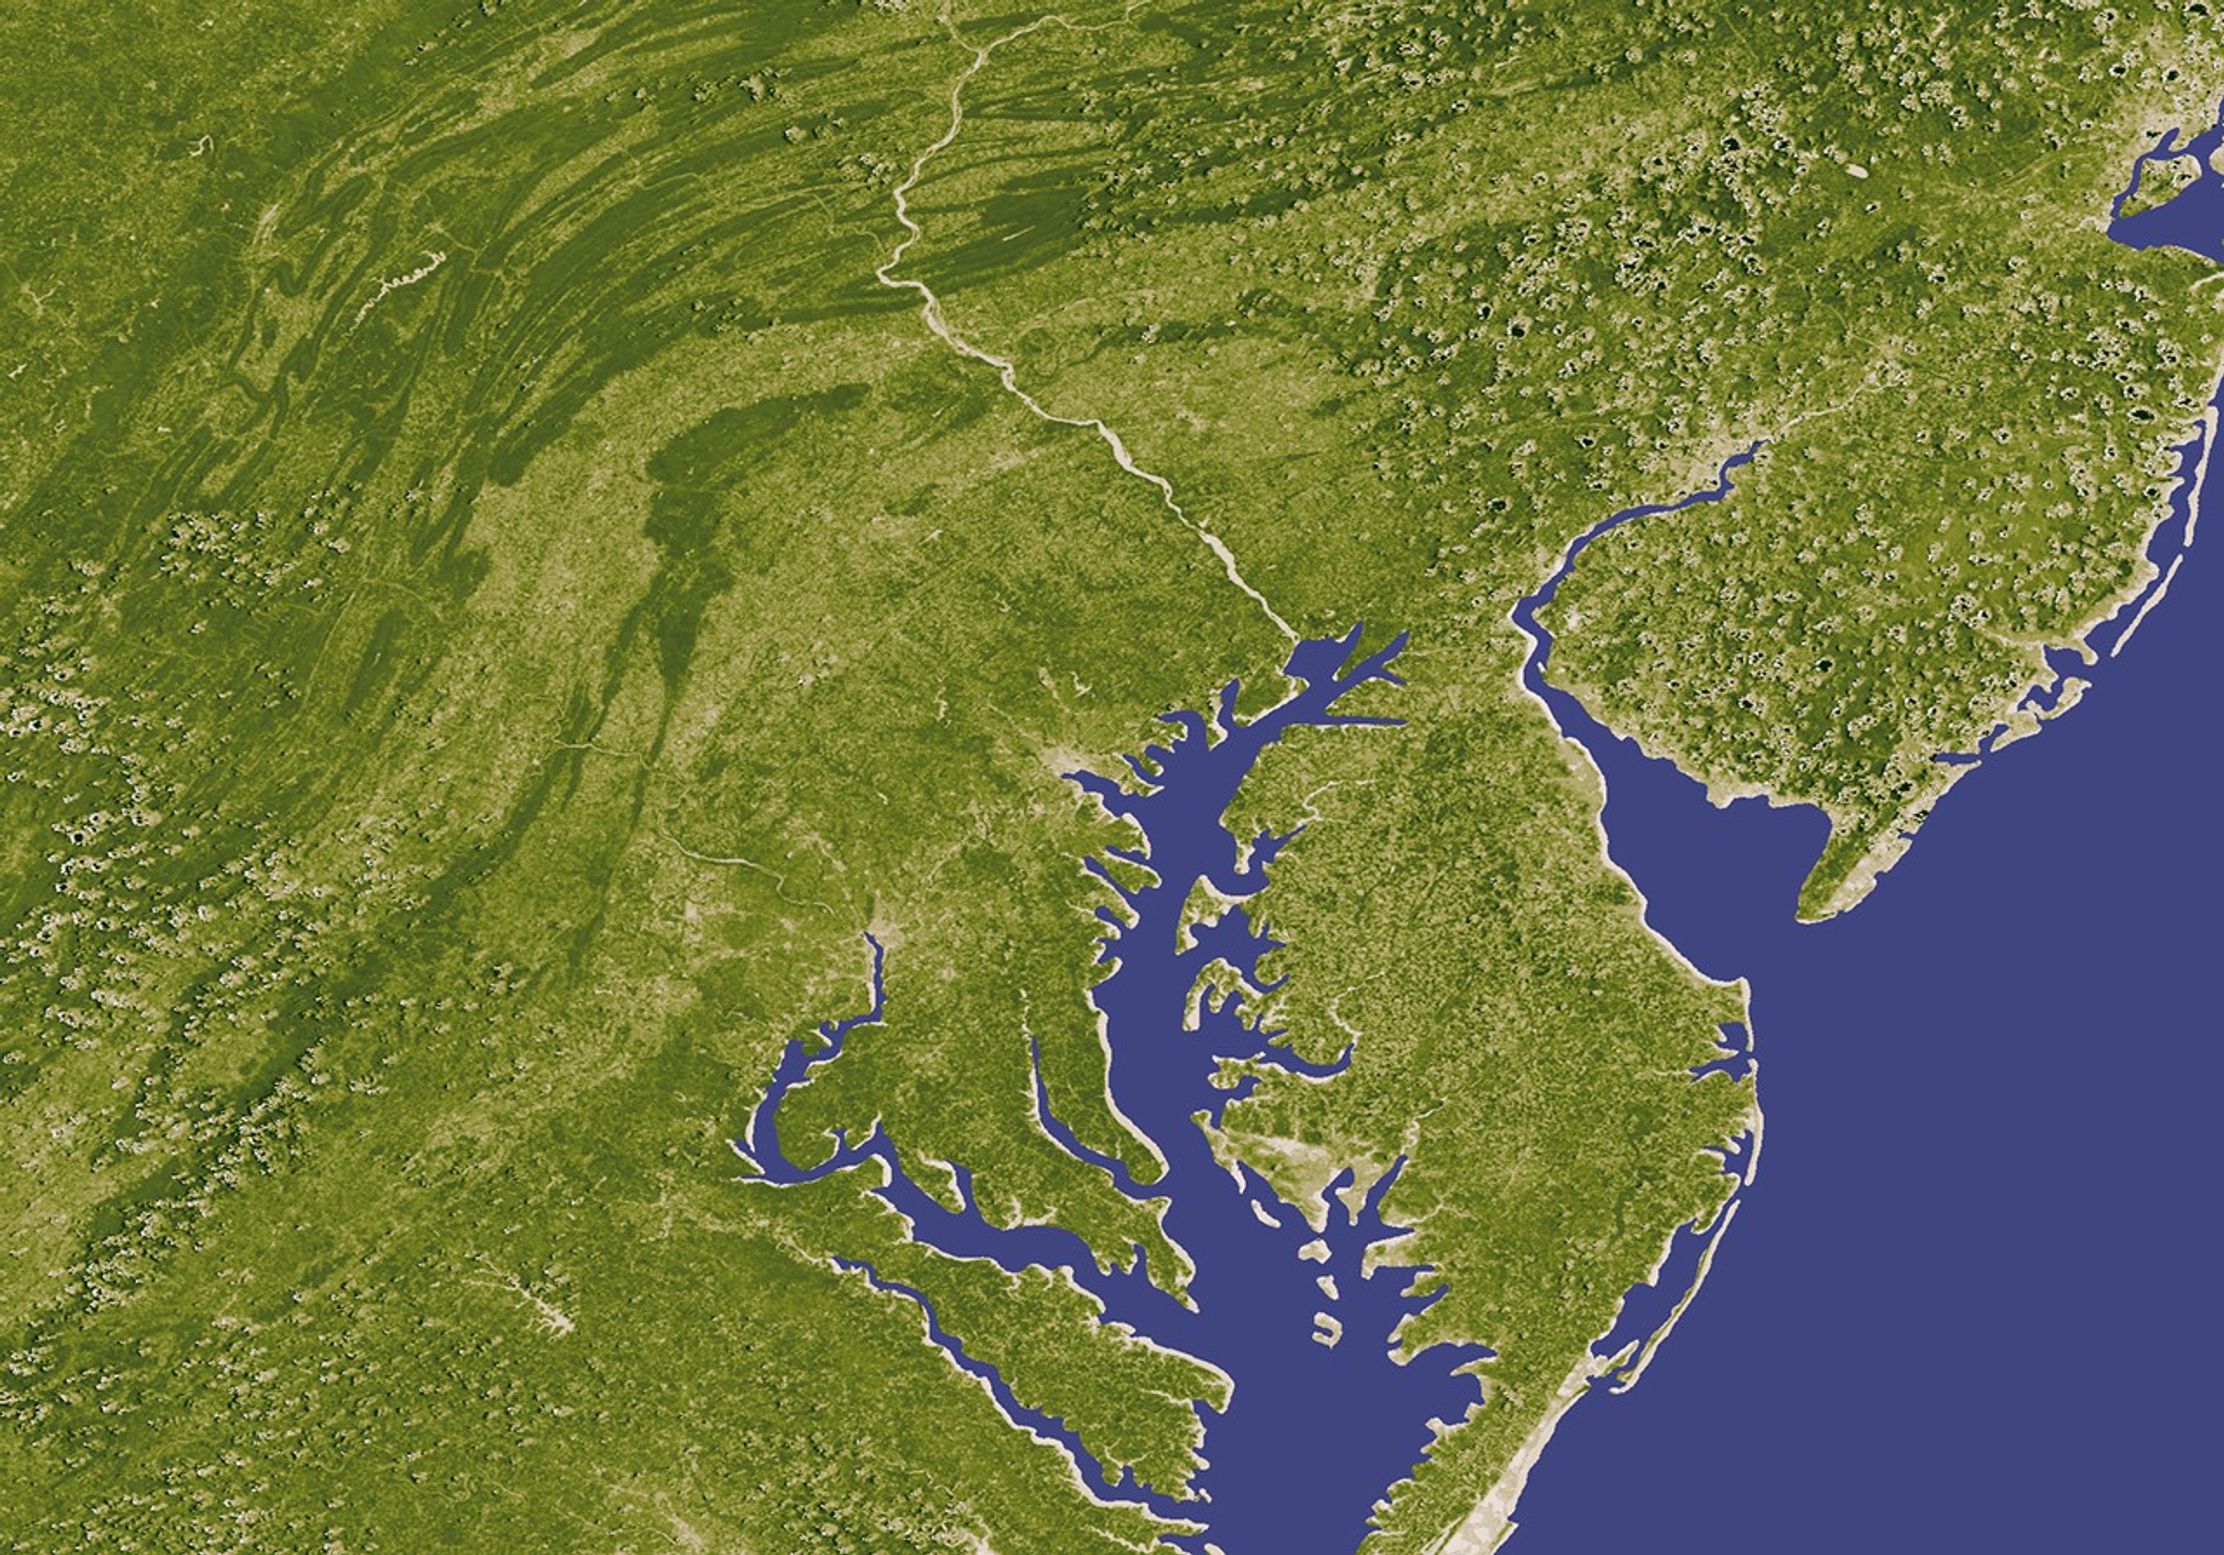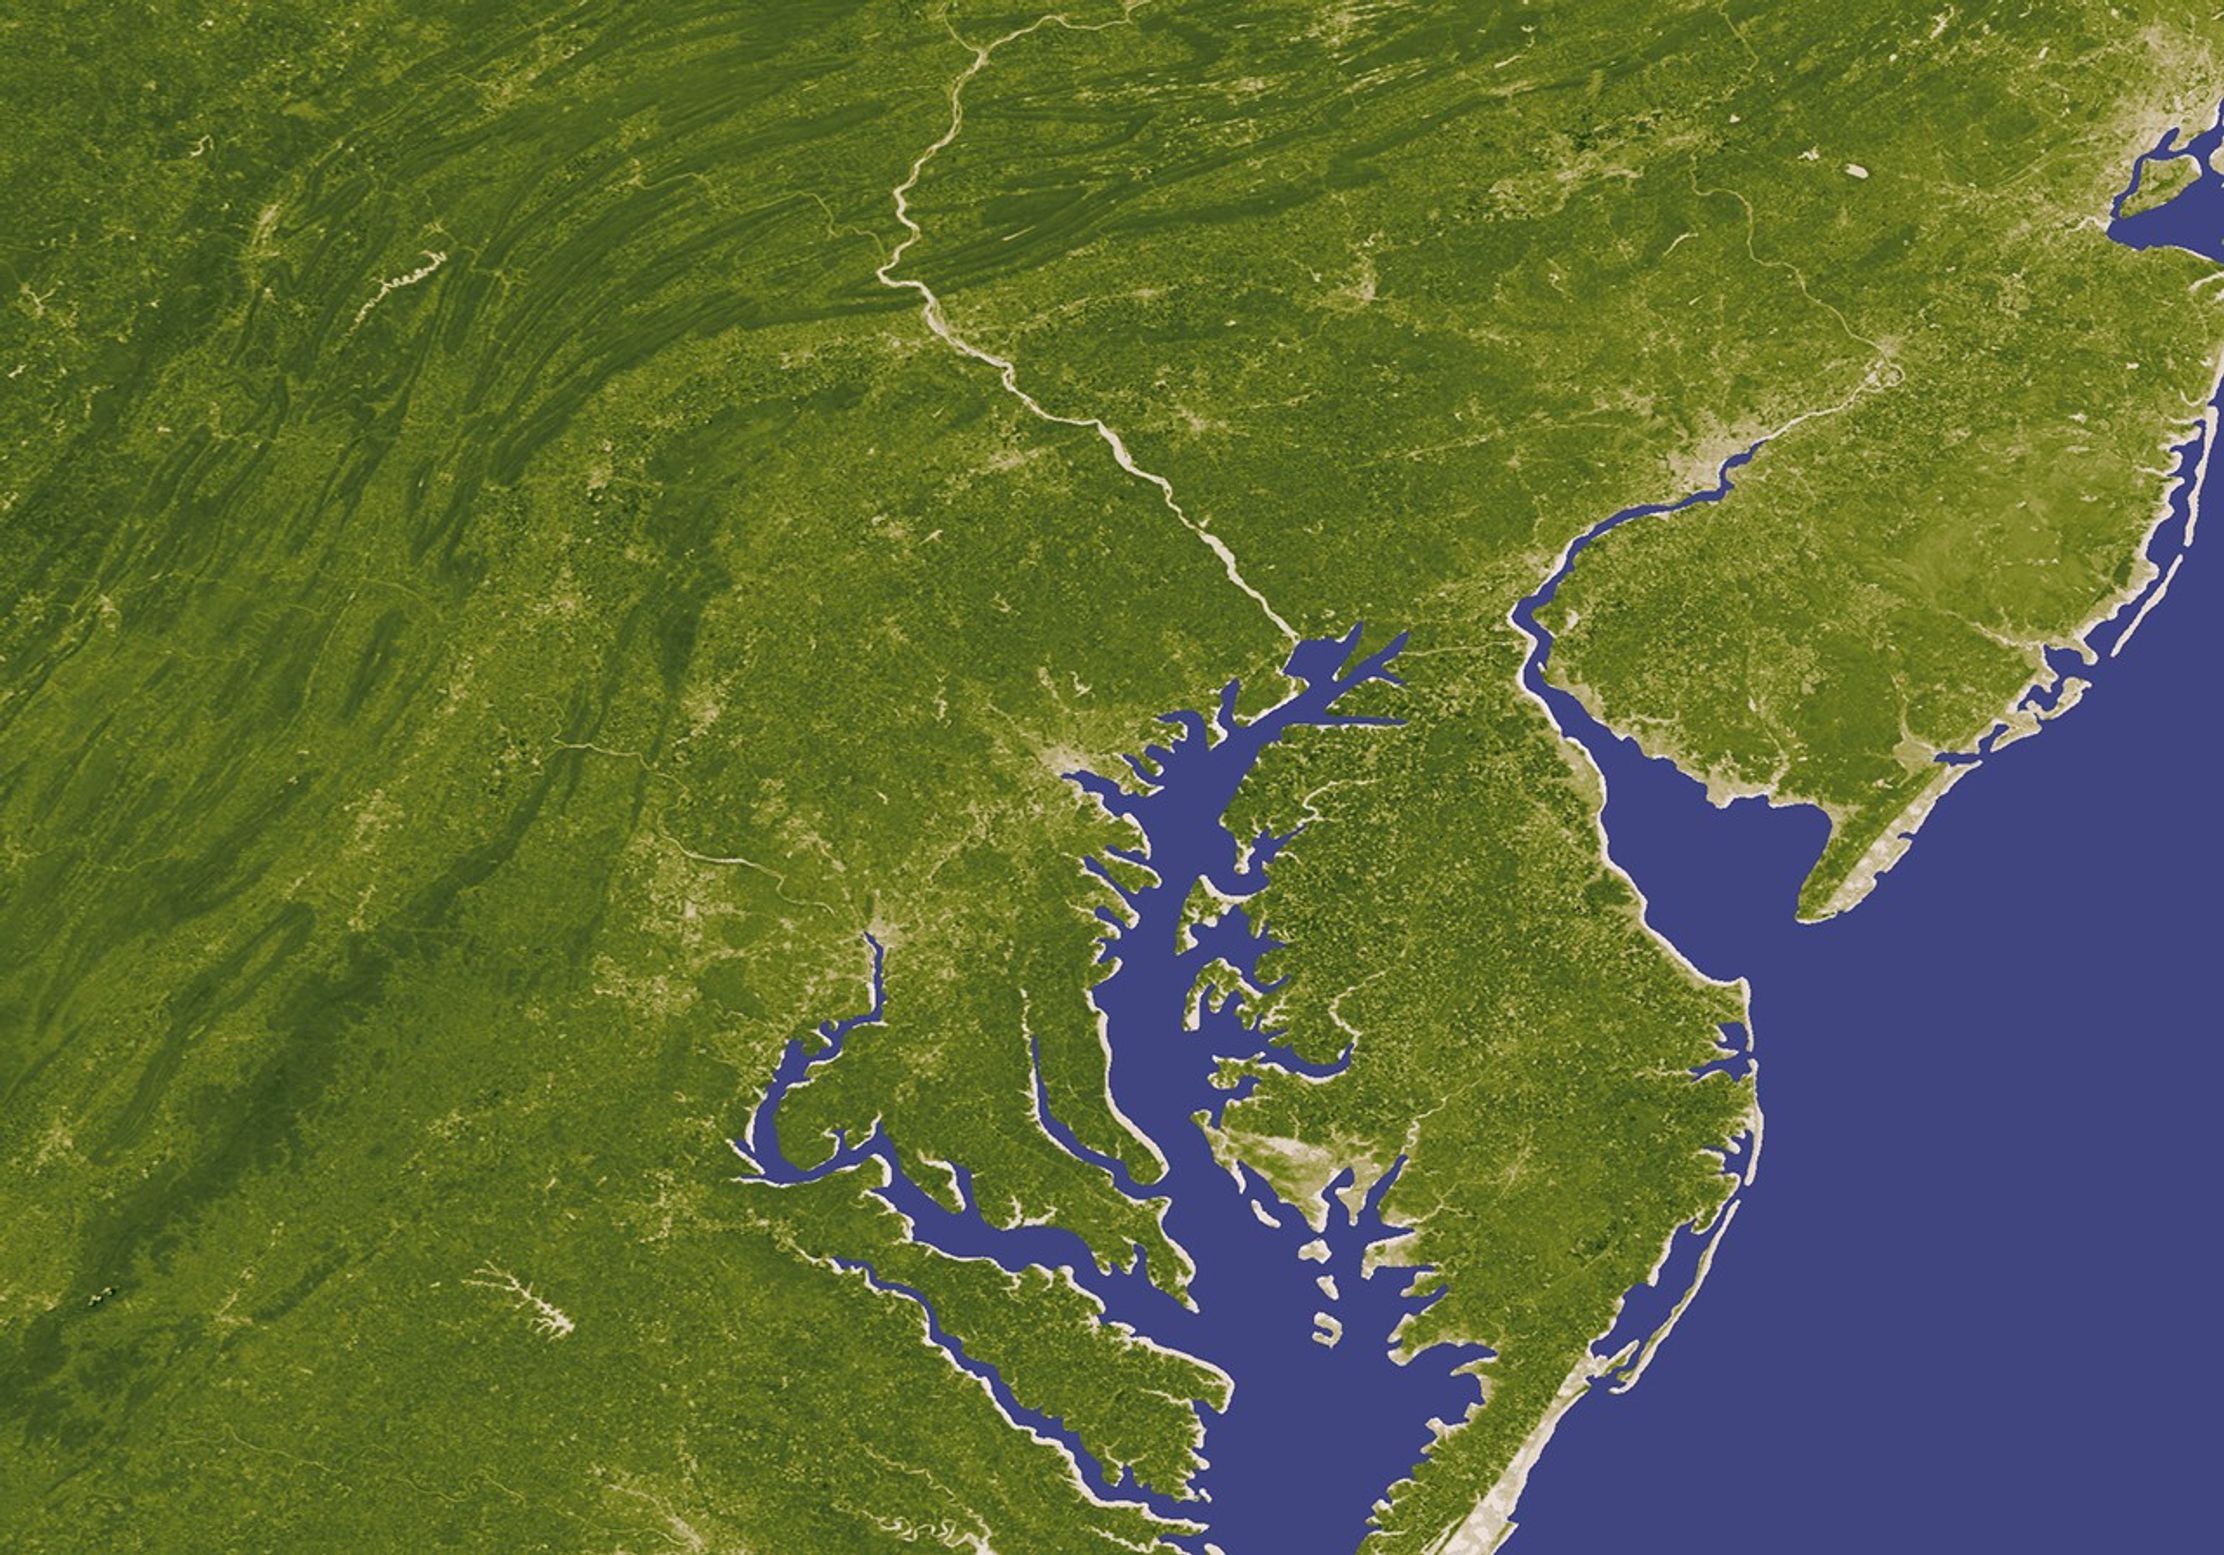


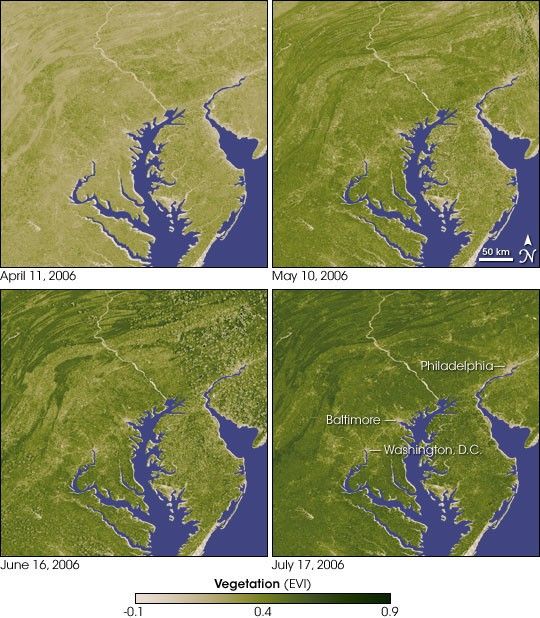
For more than two decades, satellites have been observing seasonal patterns of Earth's vegetation. In eastern North America, the spring “green up” is one of the most dramatic changes satellites observe. The panel of images above shows an example of what satellites see each year in the Chesapeake Bay area. In April 2006, the signal from green vegetation was weak (see our Measuring Vegetation factsheet to learn about how satellites observe vegetation). The paved and developed surfaces of the region’s large cities—Washington, D.C., Baltimore, and Philadelphia—barely stand out from the rest of the landscape. As the spring and summer progress, the vegetation signal becomes stronger (greener), and by July, urban areas stand out sharply from the surrounding landscape.
Using vegetation observations from satellites, scientist have documented that the Northern Hemisphere growing season has lengthened over the past 20 years or so as climate has warmed. The spring green up comes a week or more earlier in many Northern Hemisphere locations. Not all important seasonal events can be observed with satellites, however. The most important event in the life cycle of flowering plants—flowering itself—is too small-scale and variable for satellites to observe directly. It’s not, however, too small-scale or variable to escape the notice of honeybees.
According to NASA scientist and amateur beekeeper Wayne Esaias, seasonal changes in the weight of a honeybee hive mirror the availability of nectar and pollen in the surrounding ecosystems. In Maryland, the primary source of nectar for honeybees is flowering trees, such as Black locust and Tulip poplar. When the trees start to flower, the workers increase honey production; the weight of the hive increases. When the flowering stops, the hive's weight gain tapers off. The hive’s weight is a very sensitive indicator of when flowering occurs in an ecosystem.
Esaias thinks that keeping track of seasonal changes in honeybee hive weights at many locations over many years will help scientists understand the impact of climate change on flowering plants. In his own hives, the peak of honey production is occurring earlier in the spring than it did when he began keeping bees in the early 1990s. By combining hive data with climate models and satellite observations like the greenness images shown above, he hopes to get a more complete picture of the impact of climate change on Maryland ecosystems. To read more about how honeybees are observing climate change, please read the Earth Observatory Feature article Buzzing About Climate Change.
You can download a 250-meter-resolution KMZ file of the vegetation change in the Mid-Atlantic region suitable for use with Google Earth.
References & Resources
NASA image created by Jesse Allen, using data obtained from the Goddard Land Processes data archives (LAADS).