


While the continental U.S. shivered through an abnormally cold spell in December 2013, Alaska experienced record-breaking heat. Both extremes were caused by an unusual kink in the northern hemisphere’s polar jet stream, which caused frigid Arctic air to move south and warm air to head north.
The jet stream is a fast-moving belt of westerly winds created by the convergence of cold air masses from the Arctic and warm air from lower latitudes. It’s common for it to have meanders called Rossby waves, but what was unusual in December 2013 was how amplified and contorted those waves became after a ridge of high pressure parked itself over Alaska.
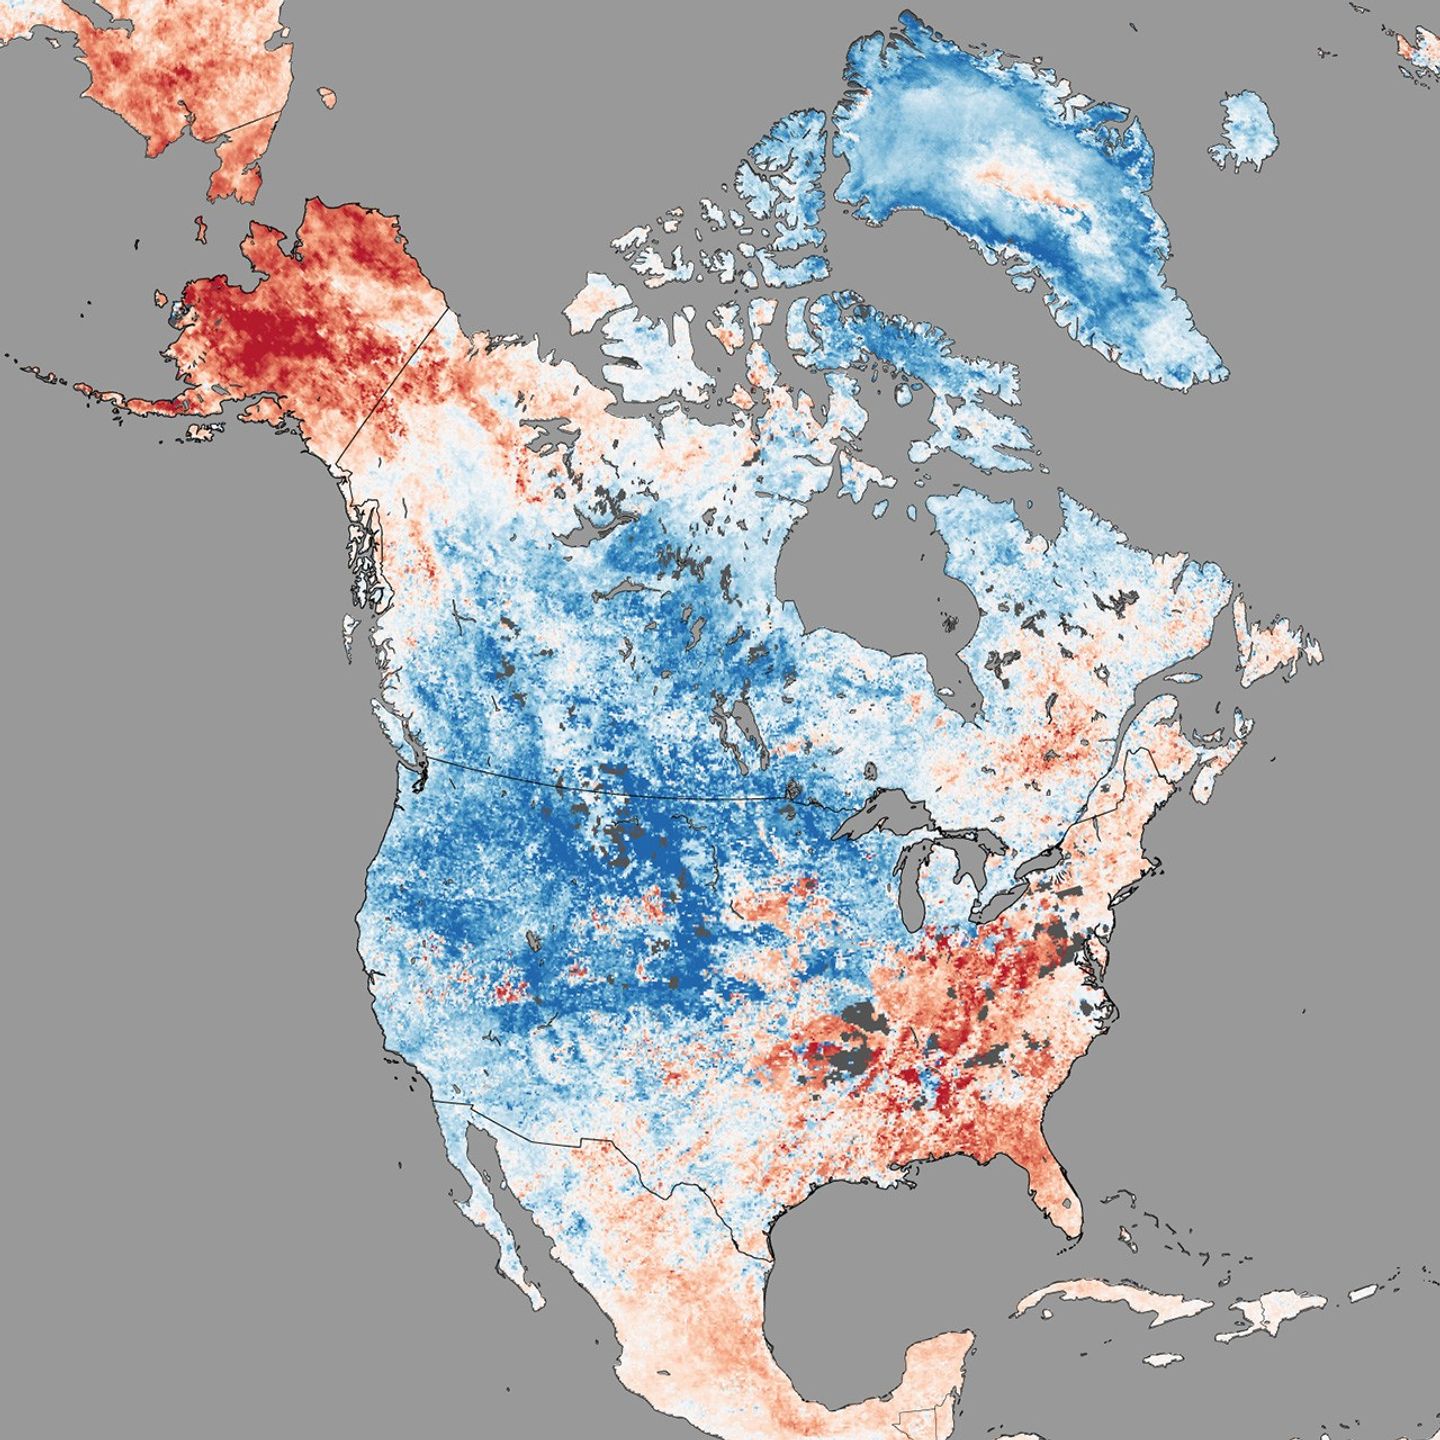
As warm air pushed north, numerous temperature records fell in Alaska. On December 7, 2013, temperatures reached 39°F (4°C) at Deadhorse, an airport in far northern Alaska that serves Prudhoe Bay. This was the warmest December temperature measured there since the airport was established in 1968, according to Weather Underground historian Christopher Burt. Meanwhile, high temperature records for December also fell or were tied at Barter Island, Alaska, and Wainwright, Alaska. In contrast, many towns in the Pacific Northwest saw record cold temperatures.
This map of land surface temperature anomalies for December 3–10, 2013, shows the sharp contrast between Alaska and the western U.S. Based on data from the Moderate Resolution Imaging Spectroradiometer (MODIS) on NASA’s Terra satellite, the map depicts 2013 temperatures compared to the 2001–2010 average for the same eight day period.
Areas with warmer than average temperatures are shown in red; near-normal temperatures are white; and areas that were cooler than the 2000-2011 base period are blue. Note that Land surface temperatures (LST) are distinct from the air temperatures that meteorological stations typically measure. LSTs indicate how hot the surface of the Earth would feel to the touch. From a satellite vantage point, the “surface” includes a number of materials that capture and retain heat, such as desert sand, the dark roof of a building, or the pavement of a road. As a result, daytime land surface temperatures are usually higher than air temperatures.
References & Resources
- Climate Central (2012, June 28). While Most of U.S. Froze, Parts of Alaska Set Record Highs. Accessed December 13, 2013.
- Climate Central (2012, December 10) Study Adds to Arctic Warming, Extreme Weather Debate. Accessed June 13, 2013.
- Weather Underground (2013, December 10) New Round of Snow and ice for the U.S.; Extreme Warmth in Alaska. Accessed December 13, 2013.
- Weather Underground (2013, December 9) Record Cold in Western U.S., Record Warmth in Alaska’s Arctic. Accessed December 13, 2013.
Images by Jesse Allen, NASA’s Earth Observatory using data courtesy of the MODIS Land Group. Additional land surface temperature anomaly images available on NASA Earth Observations.


