


![Request for Information – Potential [Placeholder for Prize]](https://assets.science.nasa.gov/dynamicimage/assets/science/psd/solar/2023/09/s/solarsystem_0.jpg?w=1024)


Claire Parkinson has been studying polar sea ice for about four decades. She has been speaking to public audiences for nearly as long. And it was those public audiences who provoked one of the NASA climatologist’s latest research projects.
“When I give public lectures or talk with people interested in the topic of polar ice, somebody will often say something like: ‘Well, the sea ice is decreasing in the Arctic but it’s increasing in the Antarctic, so don’t they cancel out?’” said Parkinson. “The answer is no, they don’t cancel out.”
In the past decade, sea ice around the Arctic Ocean has reached record lows several times, while the extent of ice around Antarctica has reached new highs. This has led to public misconceptions about climate change and the ice around Earth’s poles. Parkinson’s instincts and scientific experience told her that growth in one place does not necessarily offset losses in the other. But instincts are not enough. She dug into the data.
Examining 35 years of sea ice data, Parkinson has shown that increases around Antarctica do not make up for the accelerated Arctic sea ice loss of the last decades. Earth has been shedding sea ice at an average annual rate of 35,000 square kilometers (13,500 square miles) since 1979—the equivalent of losing an area of sea ice larger than the state of Maryland every year.
“Even though Antarctic sea ice reached a new record maximum in September 2014, global sea ice is still decreasing,” said Parkinson, who is based at NASA’s Goddard Space Flight Center. “That’s because the decreases in Arctic sea ice far exceed the increases in Antarctic sea ice.”
The line graphs above plot the monthly deviations and overall trends in polar sea ice from 1979 to 2013 as measured by satellites. The top line shows the Arctic, the middle shows Antarctica, and the third line shows the global, combined total. The sparklines at the bottom of the graphs show each year separately, enabling month-to-month comparisons across each year. The thickness of each sparkline indicates the overall growth or loss in sea ice globally. The thinning of the sparklines is indicative of the downward trend in total polar sea ice.
Parkinson analyzed microwave data that were collected by NASA and U.S. Department of Defense satellites from November 1978 to December 2013. She determined the global ice extent for each month (shown above) and found that the global trend was down in all months of the year—even those corresponding to the Arctic and Antarctic sea ice maxima. The findings were published in December 2014 in the Journal of Climate.
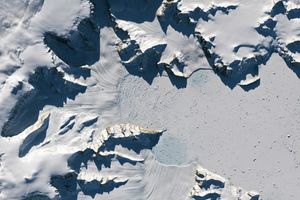
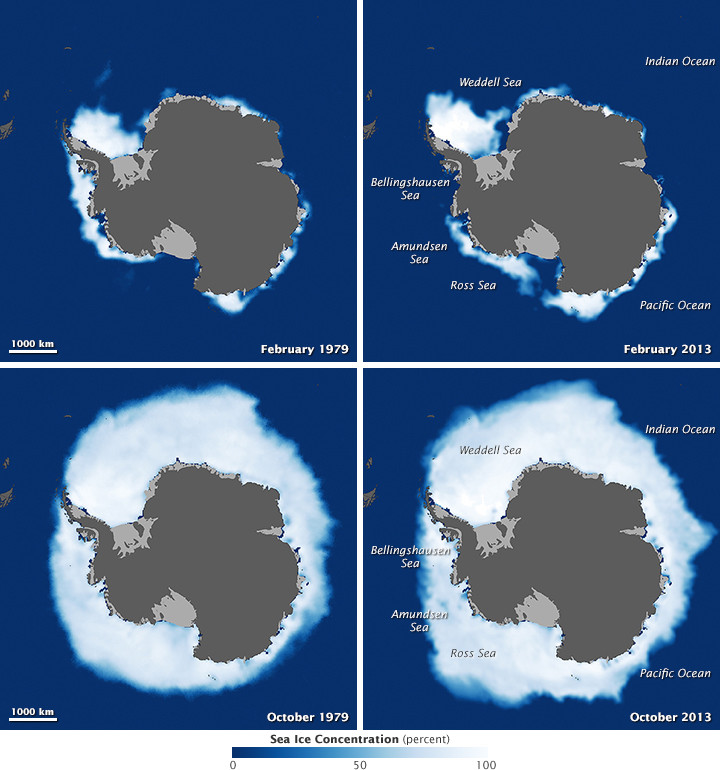
Furthermore, the global sea ice loss has accelerated. From 1979 to 1996, the ice loss was 21,500 square kilometers (8,300 square miles) per year. This rate from 1996 to 2013 was 50,000 square kilometers (19,500 square miles) lost per year. Annual losses were larger than the states of Vermont and New Hampshire combined. The maps below show the extent of Arctic and Antarctic sea ice in 1979 and 2013.
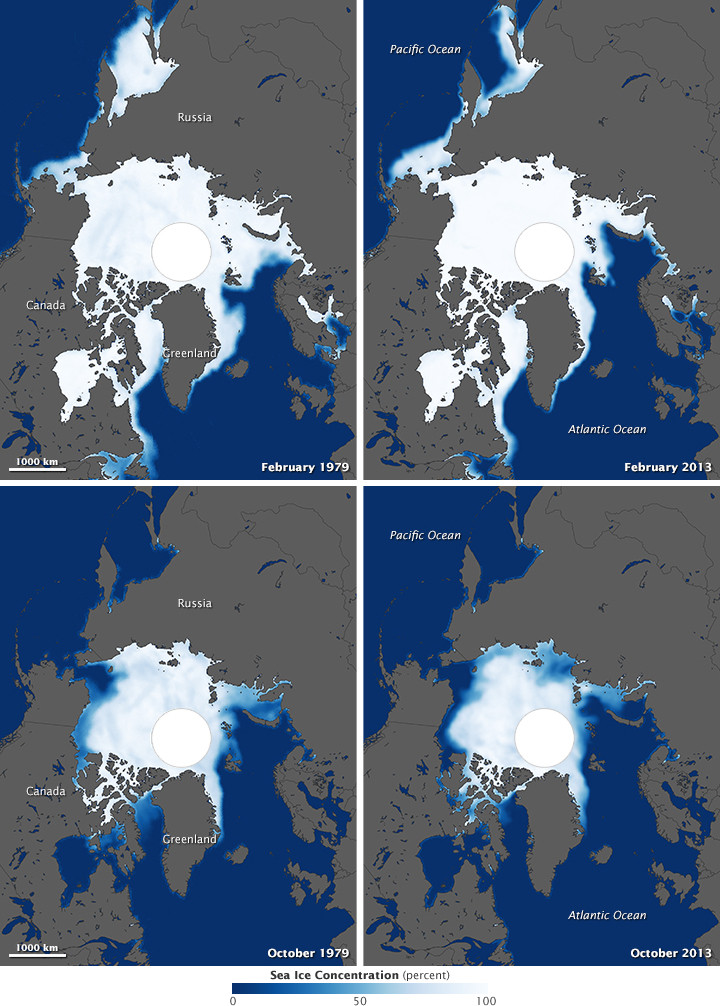
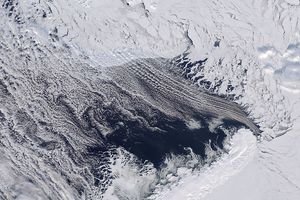
Sea ice has diminished in almost all regions of the Arctic, whereas the sea ice increases in the Antarctic are less widespread geographically. Although sea ice cover expanded in most of the Southern Ocean between 1979 and 2013, it decreased substantially in the Bellingshausen and Amundsen seas. These two seas are close to the Antarctic Peninsula, a region that has warmed significantly in recent decades.
Parkinson also found that the annual cycle of global ice extent is more in line with the annual cycle of Antarctic ice than Arctic ice. The global minimum ice extent occurs in February, as does the Antarctic minimum extent. The global maximum sea ice extent occurs in either October or November, one or two months after the Antarctic maximum. This contrasts with the Arctic minimum (September) and maximum (March).
Averaged over the 35 years of the satellite record, the planet’s monthly ice extents range from a minimum of 18.2 million square kilometers (7.03 million square miles) in February to a maximum of 26.6 million square kilometers (10.27 million square miles) in November.
“One of the reasons people care about sea ice decreases is because sea ice is highly reflective, whereas the liquid ocean is very absorptive,” Parkinson said. When sea ice coverage is reduced, less sunlight is reflected back into space and more is trapped in the atmosphere, ocean, and land.
References & Resources
- Parkinson, C.L. (2014) Global Sea Ice Coverage from Satellite Data: Annual Cycle and 35-Yr Trends. Journal of Climate, 27, 9377–9382.
- NASA Earth Observatory (2014, September 24) A Tale of Two Poles.
- NASA Earth Observatory (2014) Antarctic Sea Ice.
- NASA Earth Observatory (2014) Arctic Sea Ice.
- NASA Earth Observatory (2009, April 20) Sea Ice.
Earth Observatory images by Joshua Stevens. Caption by Maria-Jose Viñas and Mike Carlowicz.
None