


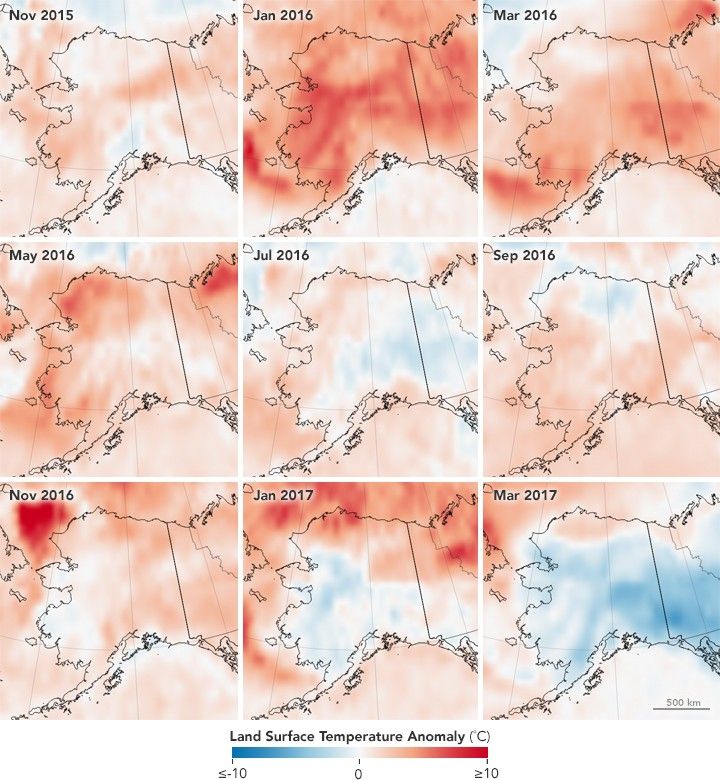
Since November 2015, temperatures in Alaska have been high—at times remarkably high. The seventeen-month warm streak ultimately came to an end in March 2017, a month that was frigid even by Alaskan standards. Several towns recorded air temperatures that month falling as low as -46 degrees Celsius (-50 degrees Fahrenheit), according to news reports.
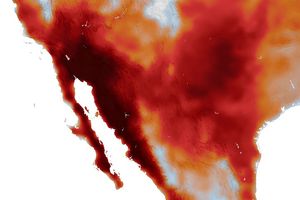
This series of maps is based on data from the Atmospheric Infrared Sounder (AIRS) on NASA’s Aqua satellite. The measurements shown here represent the temperature of the “skin” (or top 1 millimeter) of the land surface during the daytime—including bare land, snow or ice cover, urban areas, and cropland or forest canopy.
Land surface temperatures (LSTs) should not be confused with surface air temperature measurements that are given in a typical weather report. LSTs reflect the heating of the land surface by sunlight and they can sometimes be significantly different from air temperatures. (To learn more about LSTs and air temperatures, read: Where is the Hottest Place on Earth?)
The maps show LST anomalies for each month compared to the average conditions for that month between 2002-2016. Aside from Alaska’s North Slope, much of the rest of the state faced land surface temperatures that ranged from a few degrees below normal to as much as 10°C Celsius (18°F) below normal in March.
AIRS is a hyperspectral infrared sensor that makes observations sensitive to atmospheric and surface conditions at 2,378 separate wavelengths. In addition to detecting land surface temperatures, this allows the sensor to measure air temperatures from several heights in the atmosphere. This makes it possible for scientists to create detailed three-dimensional maps—or temperature profiles—that go from the surface to an altitude of 40 kilometers (25 miles) up.
The cold snap proved to be short-lived. In April 2017, temperatures in Alaska flipped and became unusually warm again.
References & Resources
- Daily News-Miner (2017, March 25) Interior Alaska unusually cold for March. Accessed May 16, 2017.
- KTOO (2017, May 3) Ask a Climatologist: April flips the warm switch in Alaska. Accessed May 16, 2017.
- NASA AIRS Near Real-Time Products. Accessed May 16, 2017.
- NASA (2017, May 4) AIRS :15 Years of Seeing What’s in the Air. Accessed May 16, 2017.
- NOAA (2017) State of the Climate. Accessed May 16, 2017.
- NOAA (2017) Beyond the Data: Listicle Edition (#4 will amaze you!) Accessed May 16, 2017.
- USA Today (2017, March 25) It’s so cold in Alaska that even Alaskans are complaining. Accessed May 16, 2017.
NASA Earth Observatory images by Jesse Allen, using AIRS Land Surface Temperature data provided courtesy of the AIRS team. Story by Adam Voiland, with information from Joel Susskind (NASA GSFC).
None


