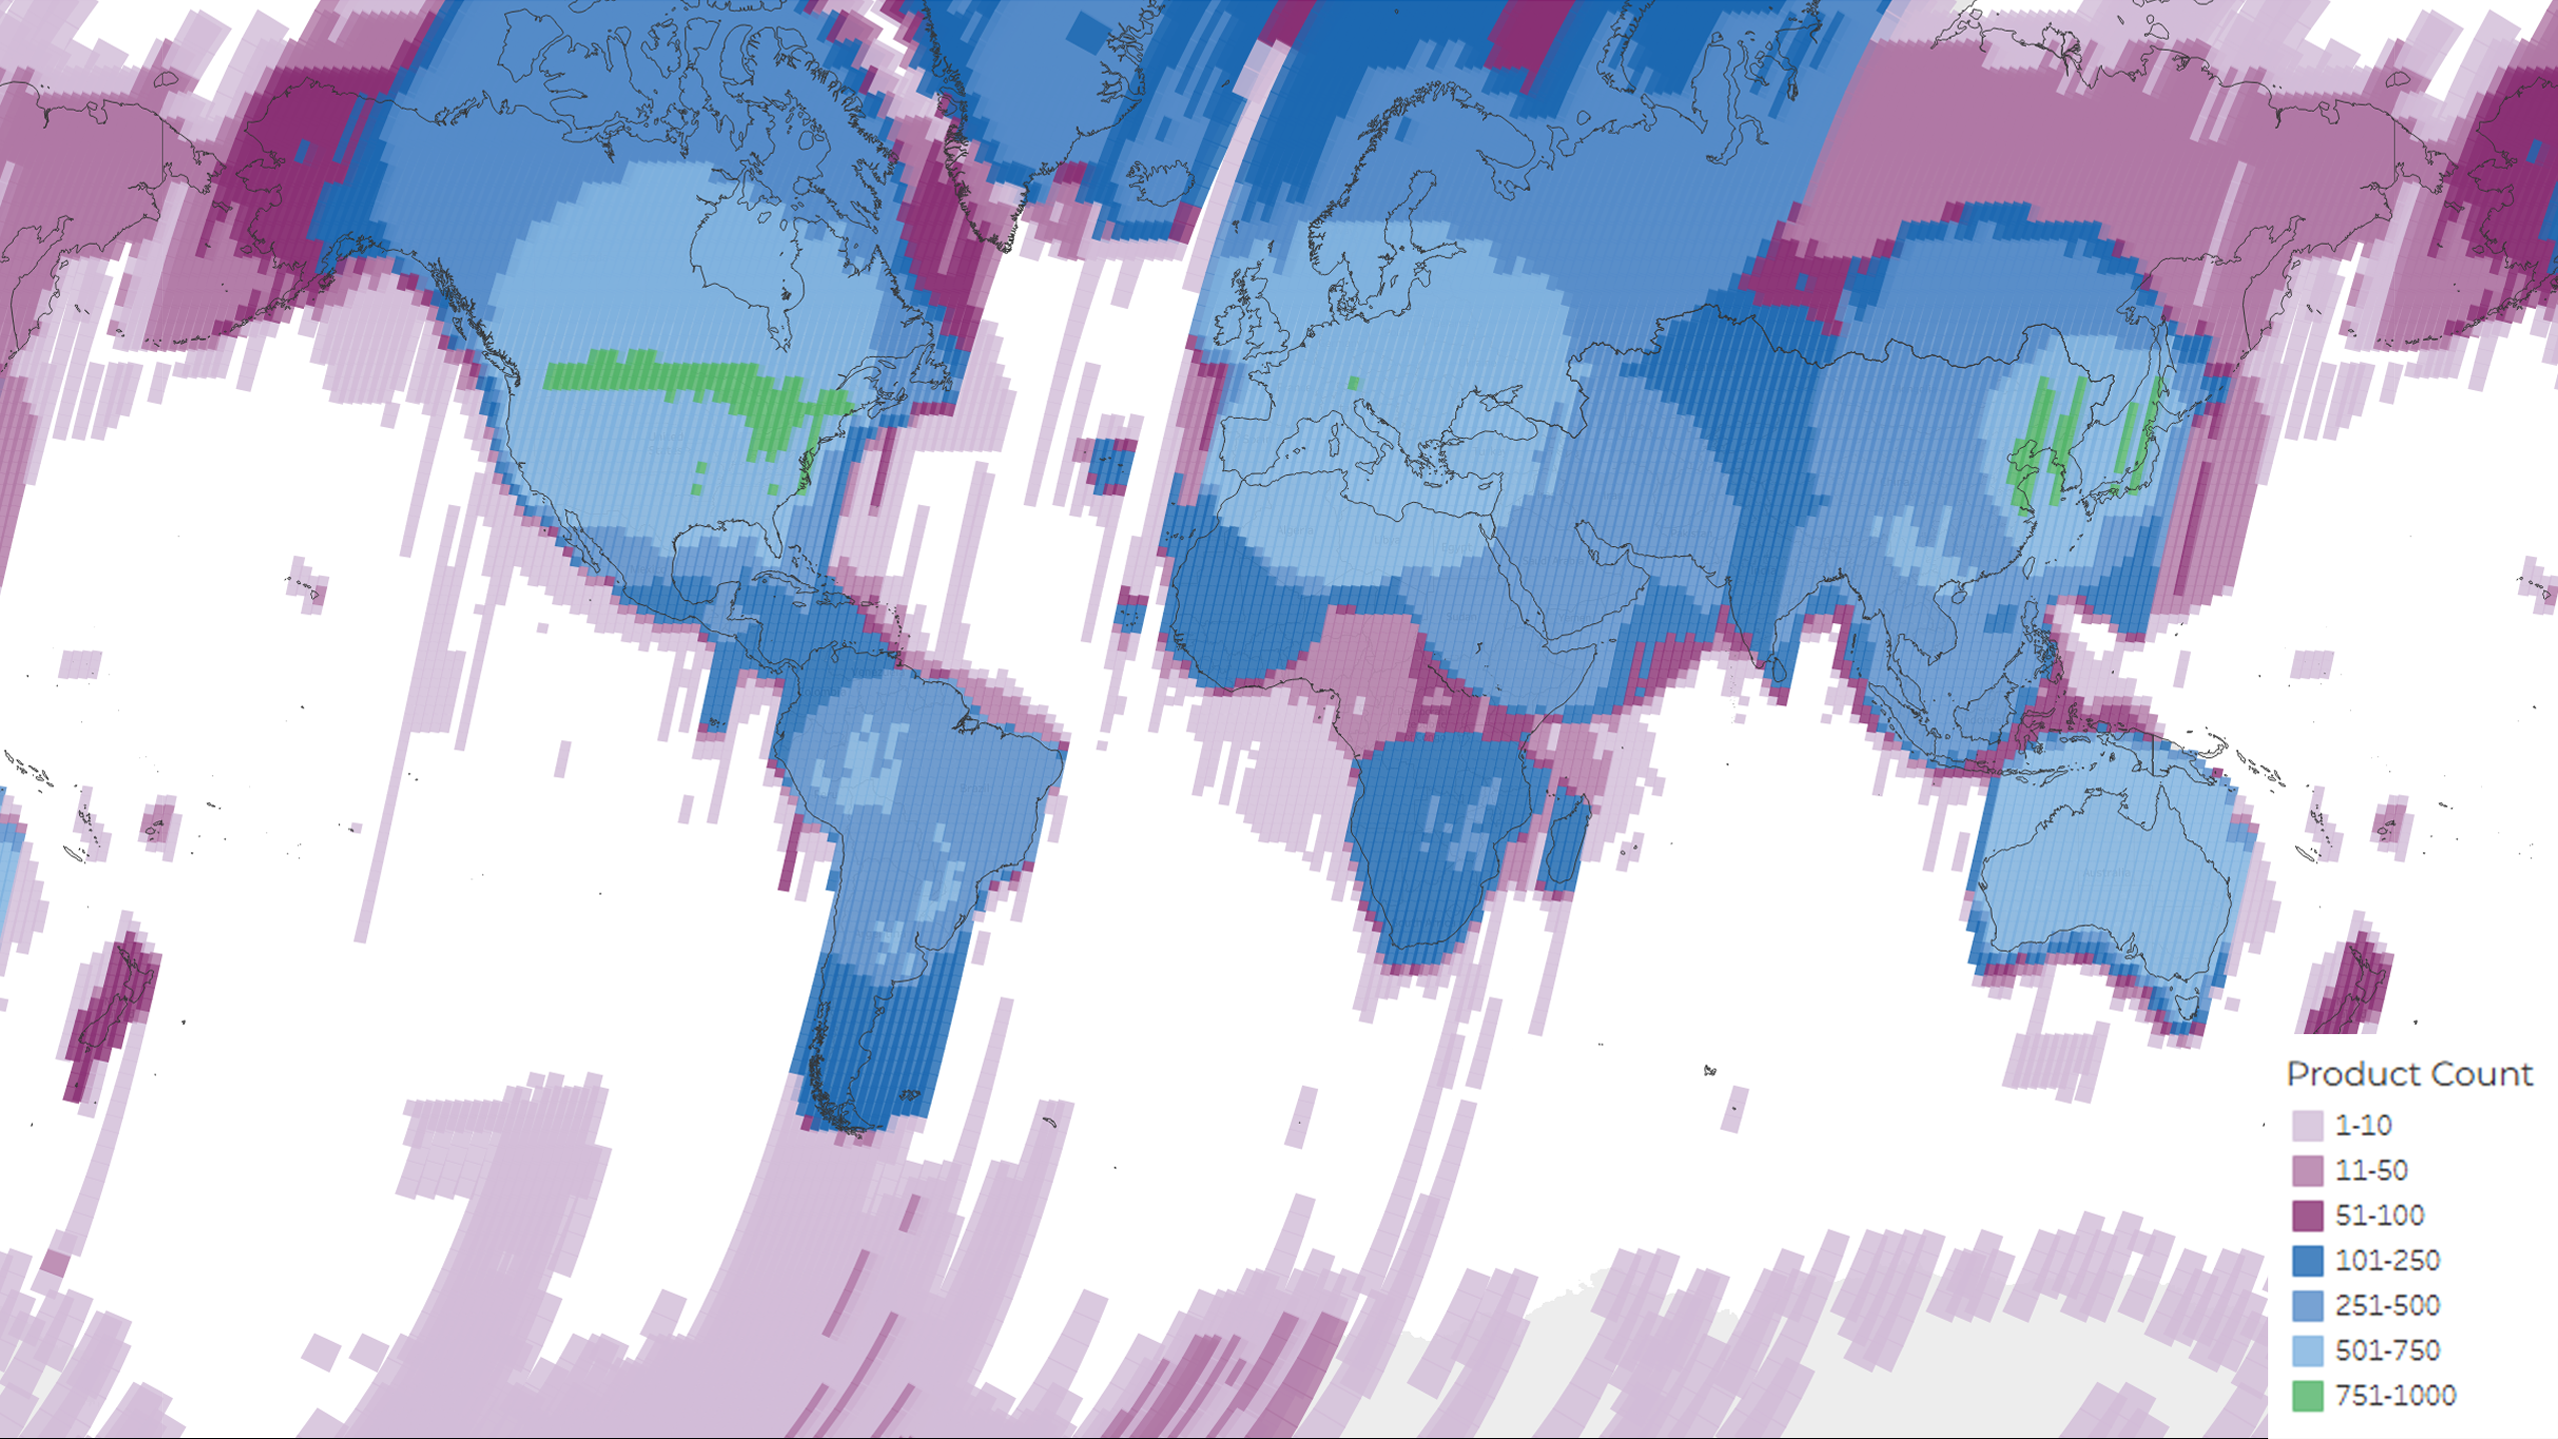


Landsat 5 – USGS EROS Archive
A density map showing the distribution of the total 3,870,273 MSS and TM scenes acquired and archived during the lifetime of the Landsat 5 mission. The colors represent the number of products per Path/Row.
Image Credit: USGS
- X
https://science.nasa.gov/image-detail/amf-d71aac2f-fa34-49af-a621-842a844ea8cb/
Image CreditUSGS
Size2558x1439px