


- May 7, 2004 (392 KB)
- May 9, 2004 (460 KB)
- May 11, 2004 (300 KB)
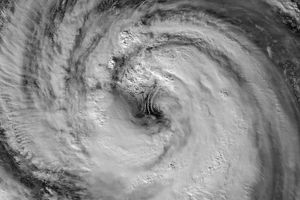
Cyclone 01A hovered just off the west coast of India this past week slowlydrifting parallel to the coastline without coming ashore. It began as aweak depression that formed on the 4th of May 2004 about 200 km east of thesouthwest coast of India in the Laccadive Sea. The system strengthenedinto a tropical storm the next day on the 5th with winds estimated at 35knots (40 mph) by the Joint Typhoon Warning Center. On the 7th and 8th,the stormed reached its peak intensity of just 45 knots (52 mph) beforeweakening back into a depression on the 10th. The storm was responsiblefor 5 deaths in India from heavy rains.
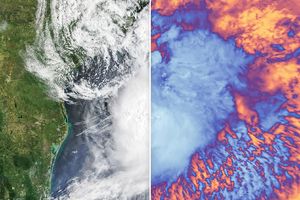
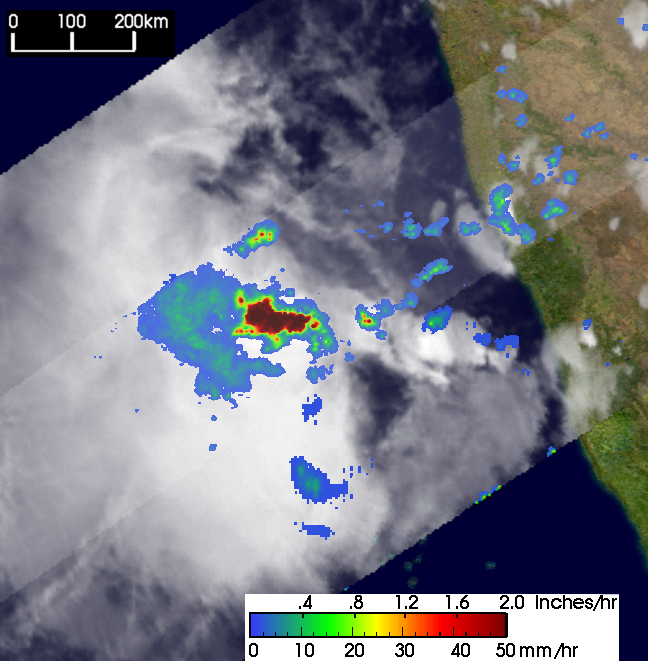
The Tropical Rainfall Measuring Mission (TRMM) satellite captured severalimages of the cyclone as it drifted northward in the western Indian Ocean.The first image taken at 21:25 UTC on 5 May 2004 shows rainfall within thestorm as seen by the TRMM satellite. Rain rates in the center swath arefrom the TRMM Precipitation Radar (PR), and rain rates in the outer swathare from the TRMM Microwave Imager (TMI). The rain rates are overlaid oninfrared (IR) data from the TRMM Visible Infrared Scanner (VIRS). Thisfirst image shows that the rain field associated with the storm is veryasymmetrical with almost all of the rain falling west of the center, whichlacks an eyewall, a characteristic of immature or weaker systems. Severalpatches of intense rain (darker reds) are embedded within a broad shield ofmoderate (green) to light rain (blue). The second image taken at 11:20 UTCon the 7th shows the system has not become any better organized. The areaof heavy rain (dark red) is consolidated into one band, but there is stillno evidence of an eyewall. In the final snapshot at 11:07 UTC on the 9th,the center is now completely devoid of rainfall without which the stormcannot survive as tropical cyclones rely on heat released from the conversionof water vapor to fuel their circulations. This image does reveal that thesystem is still capable of producing heavy rains over land well away fromthe center as shown by the dark red areas over the coastline.
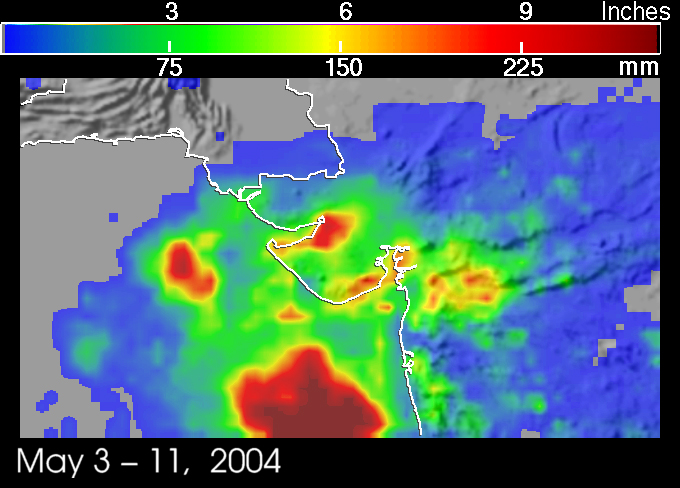
The TRMM-based, near-real time Multi-satellite Precipitation Analysis (MPA)at the NASA Goddard Space Flight Center monitors rainfall over the globaltropics. The last image gives MPA rainfall totals for the period 3-11 May2004 associated with the passage of the cyclone. The highest amounts on theorder of 12 inches fell over water (dark red areas). However, some coastalareas in the state of Gujarat did receive up to 9 inches locally (red areas)with several areas receiving between 3 and 6 inches (green areas).
TRMM is a joint mission between NASA and the Japanese space agency JAXA.
References & Resources
Images produced by Hal Pierce (SSAI/NASA GSFC) and caption by Steve Lang (SSAI/NASA GSFC).


