


![Request for Information – Potential [Placeholder for Prize]](https://assets.science.nasa.gov/dynamicimage/assets/science/psd/solar/2023/09/s/solarsystem_0.jpg?w=1024)


browse image of orbit 6663 (420 KB JPEG)
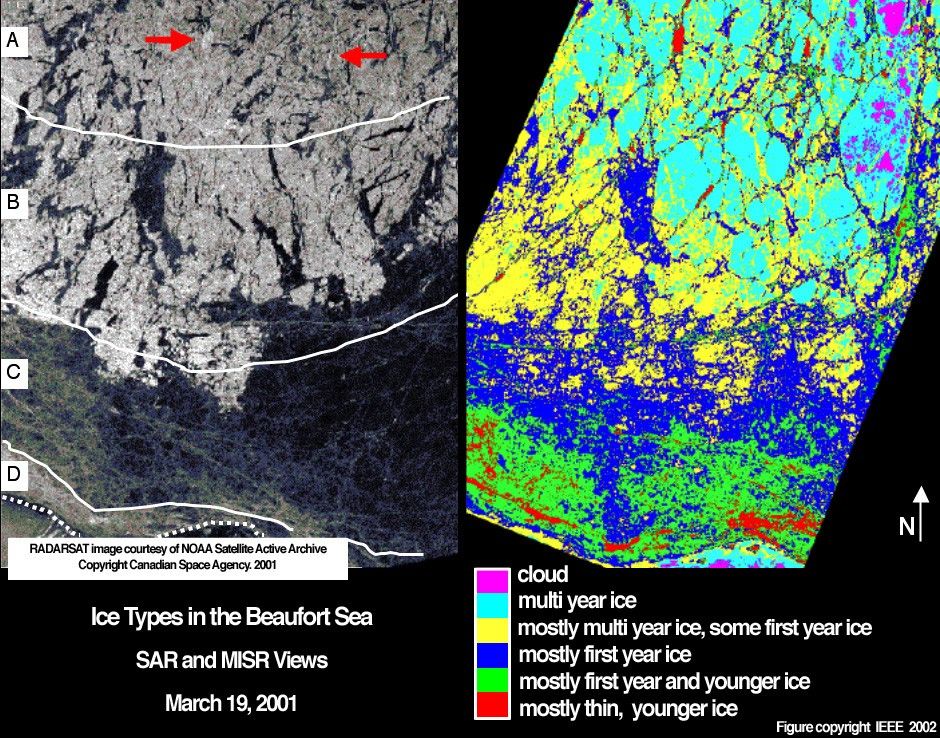
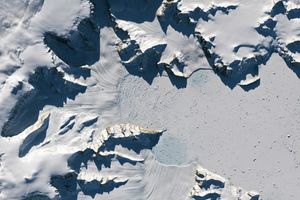
Determining the amount and type of sea ice in the polar oceans iscrucial to improving our knowledge and understanding of polar weatherand long term climate fluctuations. These views from two satelliteremote sensing instruments; the synthetic aperture radar (SAR) on boardthe RADARSAT satellite and the Multi-angle Imaging SpectroRadiometer(MISR), illustrate different methods that may be used to assess sea icetype. Sea ice in the Beaufort Sea off the north coast of Alaska wasclassified and mapped in these concurrent images acquired March 19, 2001and mapped to the same geographic area.
To identify sea ice types, the National Oceanic and AtmosphericAdministration (NOAA) National Ice Center constructs ice charts usingseveral data sources including RADARSAT SAR images such as the one shownat left. SAR classifies sea ice types primarily by how the surface andsubsurface roughness influence radar backscatter. In the SAR image,white lines delineate different sea ice zones as identified by theNational Ice Center. Regions of mostly multiyear ice (A) are separatedfrom regions with large amounts of first year and younger ice (B-D), andthe dashed white line at bottom marks the coastline. In general, sea icetypes that exhibit increased radar backscatter appear bright in SAR andare identified as rougher, older ice types. Younger, smoother ice typesappear dark to SAR. Near the top of the SAR image, however, red arrowspoint to bright areas in which large, crystalline "frost flowers" haveformed on young, thin ice, causing this young ice type to exhibit anincreased radar backscatter. Frost flowers are strongly backscatteringat radar wavelengths (cm) due to both surface roughness and the highsalinity of frost flowers, which causes them to be highly reflective toradar energy.
Surface roughness is also registered by MISR, although the roughnessobserved is at a different spatial scale. Older, rougher ice areas arepredominantly backward scattering to the MISR cameras, whereas younger,smoother ice types are predominantly forward scattering. The MISR map atright was generated using a statistical classification routine (calledISODATA) and analyzed using ice charts from the National Ice Center.Five classes of sea ice were found based upon the classification of MISRangular data. These are described, based on interpretation of the SARimage, by the image key. Very smooth ice areas that are predominantlyforward scattering are colored red. Frost flowers are largely smooth tothe MISR visible band sensor and are mapped as forward scattering. Areasmapped as blue are predominantly backward scattering, and the otherthree classes have statistically distinct angular signatures and fallwithin the middle of the forward/backward scattering continuum. Someareas that may be first year or younger ice between the multi year icefloes are not discernible to SAR, illustrating how MISR potentially canmake a unique contribution to sea ice mapping.
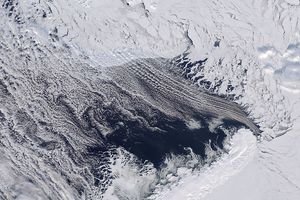
The Multi-angle Imaging SpectroRadiometer observes the daylit Earthcontinuously and every 9 days views the entire globe between 82 degreesnorth and 82 degrees south latitude. The MISR Browse Image Viewer provides access tolow-resolution true-color versions of these images. This data product was generatedfrom a portion of the imagery acquired during Terra orbit 6663. The MISRimage has been cropped to include an area that is 200 kilometers wide,and utilizes data from blocks 30 to 33 within World Reference System-2path 71.
References & Resources
Image courtesy NASA/GSFC/LaRC/JPL, MISR Team. RADARSAT image courtesy NOAA Satellite Active Archive. Figure reprinted courtesy of IEEE.


