


In this era of heightened concern about the relationship between the build up of atmospheric carbon dioxide and climate change, scientists are working to itemize all the ways carbon moves between the atmosphere and the elements of Earth’s surface, including life, water and soil. Forests are of particular interest in large part because many nations now manage the forests within their borders, deciding where and when to harvest trees and when to leave the forest alone. Now those decisions are influenced by the role forests play in the global carbon cycle. Forests’ ability to take in and sequester carbon during photosynthesis has ceased to be something we accept without thought; the biological services they provide have instead become a product with a market value to be traded between nations like radio parts or soybeans. Just as humans have turned to forests for fuel, food, and shelter for hundreds of thousands of years, we now look to them to help us compensate for the atmospheric excesses of our combustion-engine civilization.

Whether or not forests will respond as we hope is unclear. Factors other than carbon dioxide availability influence rates of photosynthesis—factors such as water availability and heat stress. In addition, the carbon cycle of a forest involves more than just carbon dioxide uptake because forests burn, decompose, and respire, re-releasing some of their carbon stash back into the atmosphere. We must consider the contribution of many processes to the overall cycle before we can say what future role forests will play in the global carbon cycle or how much we can rely on them to absorb steadily increasing atmospheric carbon dioxide.
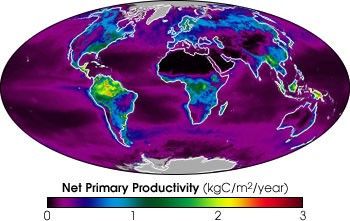
Perhaps nowhere on Earth do questions about the role of forests in the carbon cycle need answers more than in the Amazon Rainforest. The largest expanse of tropical forest on Earth, the Amazon covers just 5% of the Earth’s land surface (neglecting Antarctica), and yet is responsible for 10% of the net primary productivity of the whole terrestrial biosphere. Once an undisturbed, remote, and inaccessible region, the Amazon is experiencing rapid land cover change as a consequence of economic development. In the face of such rapid change, scientists are anxious to understand the carbon cycle of the Amazon.
Bookkeeping Carbon
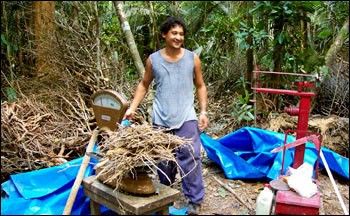
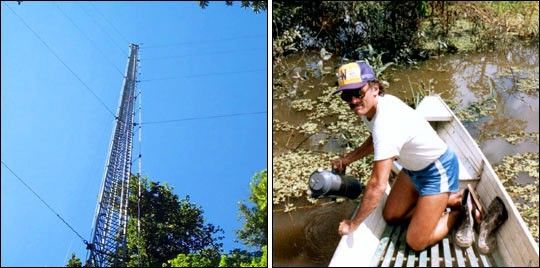
Scientists studying the cycle have several sources of information at their disposal. One source is from towers that reach several hundred feet into the top of the forest canopy. Here scientists can measure the flux, or movement, of carbon dioxide into and out of the forest canopy. Another way they retrieve information is by measuring the amount of biomass in the forest. For years, researchers have been monitoring forest plots from the ground, counting trees, measuring them, and sometimes even weighing them to estimate their carbon content. Finally, using mathematical models, scientists sometimes step out from among the trees to take a look at the whole forest. Working backwards from what they know about the global distribution of carbon dioxide in the atmosphere, they try to determine whether the Amazon must be a source of carbon dioxide or a sink, where carbon is stored.
The trouble is that the answer to the question of whether the Amazon is a carbon source or sink seems to depend on where you look for the answer. Jeffrey Richey, a biogeochemist at the School of Oceanography at the University of Washington, has been drawn to the puzzle for more than 20 years. “I guess the real question about the carbon cycle in the Amazon is why tropical rainforests aren’t full of monster trees that double in size every year. When we look at the rate of carbon dioxide uptake by forests that is estimated by published results of flux tower measurements, it is a big number—on the order of 3 to 6 tons per hectare each year. That would make the Amazon a huge carbon sink. The problem is, if the trees were taking up that much carbon every year, they would have to be enormous. When we estimate the rate of carbon uptake by looking at the accumulation of carbon in wood and soil, the rates aren’t even close to the flux measurements, perhaps more like 1 to 1.5 tons per hectare per year”, says Richey.
And then there is the global carbon cycle problem. When the scientists who model the carbon cycle on a global scale work backward from the known concentrations of carbon dioxide in the atmosphere, they find that to make the Amazon carbon budget fit into the global carbon balance—with all the known sources and sinks of carbon—the Amazon is either in near equilibrium with respect to carbon exchange—giving off about as much as it takes in—or is possibly even a source of atmospheric carbon dioxide. Could the Amazon be a source of carbon? Imagining all those trees soaking up carbon dioxide day after day makes that idea seem counter-intuitive, if not downright far-fetched.
But whether the Amazon is a small sink, as biomass measurements suggest, or a small source, as global models suggest, scientists realize that the ecosystem is clearly not the large sink that the flux tower measurements alone seem to indicate. So where does all that carbon go?
Escaping Carbon
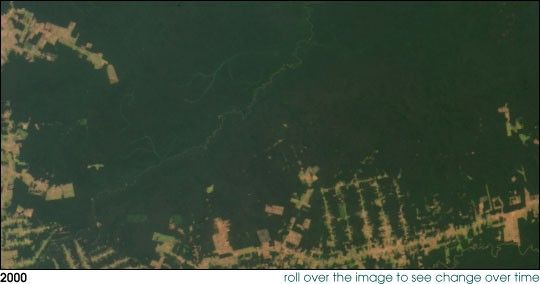
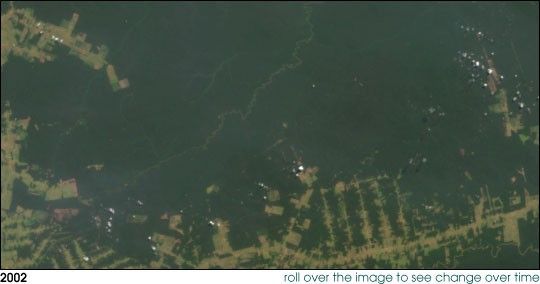
At first glance, the simplest explanation might appear to be deforestation. When forests are cut down or burned, the carbon stored in the forest biomass is released into the atmosphere. Combined with the other processes that carry carbon out of the rainforest ecosystem—decomposition, respiration, soil and sediment run off into the Atlantic—deforestation might be the big source of carbon scientists are seeking. But calculations suggest otherwise. In Brazil alone, deforestation is proceeding at a rate of about 20,000 square kilometers per year as the Amazon is cleared for farming and ranching (Houghton, et al., 2002), but these losses still do not appear to be large enough to offset the large carbon intake measured by the flux towers.
If deforestation wasn’t the culprit, then how could scientists account for the apparent discrepancy between how much carbon the flux towers indicated was coming into the forest and the lesser amount of carbon actually contained in the biological material? Researchers had no lack of alternative explanations. Maybe the global models were wrong. Maybe estimates of the rates of deforestation were too low. Maybe there was something wrong with how scientists were collecting the flux tower data. A few scientists, though, did not discount the possibility that the Amazon could be hiding a large, yet-to-be-discovered source of carbon emissions. Richey thought he knew where.
“We had been working in the Amazon for almost 20 years, collecting all kinds of river samples, including measurements of the carbon dioxide dissolved in the water. So as far back as 20 years ago, we were publishing papers saying that the amount of carbon in the waters of the Amazon was greater than that in the air. For years I had been listening to the carbon modelers complaining about the discrepancies in the tropics, and I said to myself, ‘I know that carbon dioxide is moving out of the water into the atmosphere.’ But at that time the scientists doing the carbon modeling didn’t talk to the people doing the flux tower measurements, and they didn’t talk to those of us who were down on the water.”
LBA Brings the Right Scientists Together
But then in 1998, the Brazilian science community, joined by an international team of scientists, launched the Large-scale Biosphere-Atmosphere Experiment in Amazonia (LBA). Their aim was to study how Amazonia functions as a regional entity within the larger Earth system and how changes in land use and climate will affect the biological, physical, and chemical functioning of the region’s ecosystem. With the Amazon as their laboratory, scientists have been studying climate, atmospheric chemistry, the carbon cycle, nutrient cycling, land surface hydrology and water chemistry, land use and land cover, and the interaction of humans with the landscape.
Richey credits the LBA project for bringing a diverse group of scientists together and encouraging them to speak a common language. It was on a return flight from an LBA conference that Richey began a dialogue with a carbon cycle modeler. He says,“On the plane we started comparing notes. I realized that we had always talked in terms of pressures of carbon dioxide, and they spoke in terms of mass, so many tons of carbon in and out of the ecosystem each year. I realized we would need to put our results into that common language.”
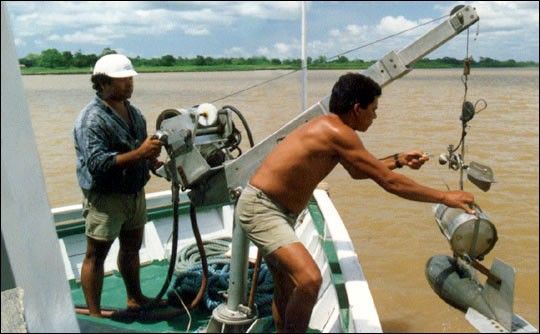
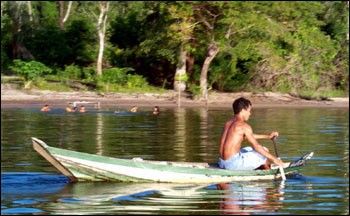
Richey knew that what they needed was a grand total: how much total carbon was emitted from water surfaces (a process called evasion) across the Amazon every year. To get a grand total, they required two pieces of information; as many measurements as they could get of the amount of carbon dioxide released by numerous areas within the basin and an estimate of the total surface area covered by water in the Amazon. To come up with these numbers, Richey and his colleagues made use of data sources that ranged from low tech— more than a decade’s worth of air and water samples collected from the bows of small fishing boats—to a sophisticated, satellite-based radar.
Using the Right Tools
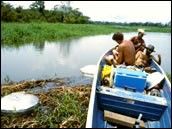
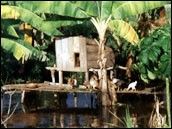
Richey already had a lot of the river water samples he needed. Between 1982 and 1992, he and his colleagues had periodically gone out on six-week river cruises on a 60-foot, double-decker research boat. In describing those thousand-kilometer expeditions, Richey says, “The Amazon is almost beyond anything you can imagine. There’s this vast life and energy surrounding you. The sky is moving. The river is swirling and churning. There are birds everywhere. Then you get off the big boat and into outboards to go into the narrower floodplains, and you are overwhelmed by the smell of all the vegetation. And all day, there’s the pressure of the sun.”
In addition to the standard, canned, camp fare you’d expect on a month-long research venture into the depths of the Amazon, Richey says the crew ate delicious local food, especially the fish they bought from local fisherman. The trips were not always idyllic, however. The researchers had one of their scarier moments after being confronted by a local tribe who mistakenly thought the researchers had arrived to take them away and claim a bounty on the tribe offered by drug traffickers. Richey and his colleagues beat a hasty retreat, more than willing to sacrifice a few data points to preserve the peace.
Richey and his colleagues collected more than 1800 river water and air samples within the central Amazon River Basin. In some cases, they used huge winches to haul up samples from deep in the river. In other cases, they captured gas emissions from the water surface using what Richey called “floating dishpans,” and described as inverted bowls placed over the water.
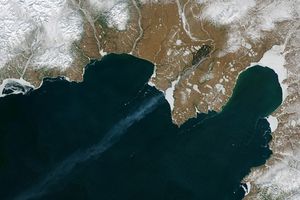
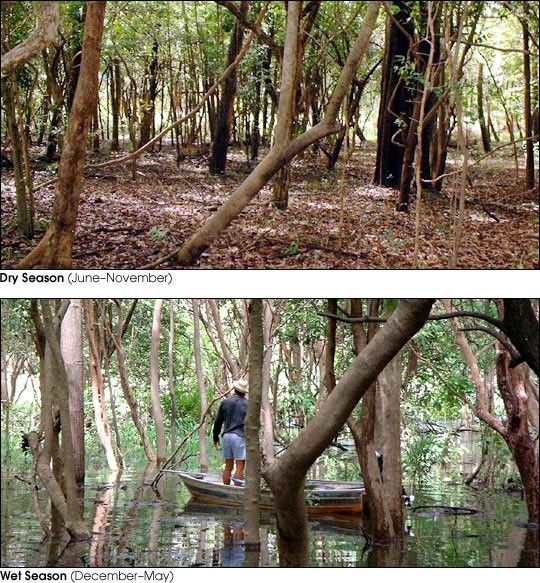
The second piece of information Richey needed was a good estimate of just how big an area was covered by water during the year. The Amazon may be perpetually wet, but it is wetter at some times than others. From December to May each year, torrential rains and snow melt from the Andes increase the main river channel’s depth 30 to 45 feet, and water backs up in tributaries and inundates forest miles from the main channel. The river and the flooded forests, called várzea in Portuguese, become a giant, slow-moving swamp. Richey needed to know how big.
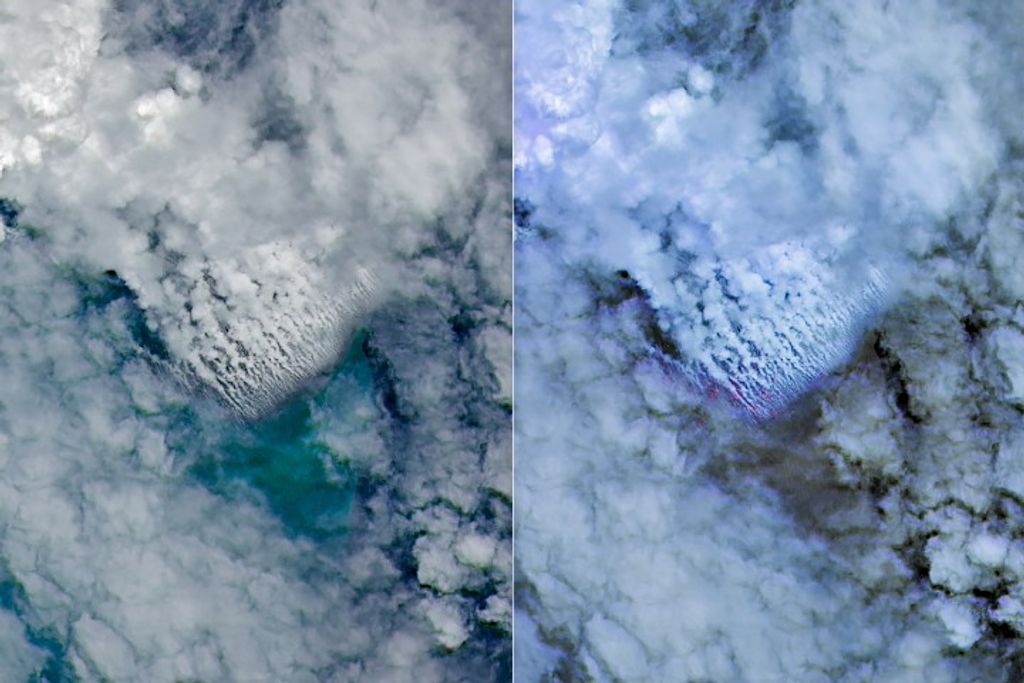
Given the immense area under study, an afternoon trek through the jungle with a camera in hand was out of the question. Satellite mapping was the only real possibility; satellites such as NASA’s Landsat series had been mapping the Amazon basin for years in true- and false-color imagery. Optical sensors like those on Landsat, which work like digital cameras, have a serious limitation, however. If there is one thing that you can count on in the Amazon during the wet season, it’s rain. At precisely the time of year when Richey needed imagery to reveal the extent of the flooding, the rain clouds hid the forests from a satellite’s view. To map the flooded Amazon forests, Richey needed a remote-sensing device that could see through clouds. He turned to radar.
Seeing Through Clouds
Unlike traditional optical sensors, radar is considered active as opposed to passive remote sensing. Instead of passively recording how much energy is being reflected by or emitted from the Earth as the spacecraft travels overhead, radar works by sending out a pulse of radio waves toward a target and then recording the strength and return time of the signal as it bounces back. That information tells the scientists both how far away the target is and what the surface looks like, since different surfaces will absorb and reflect the pulse in different ways.

Although LBA is a Brazil-led study, it is an international affair. The National Space Development Agency (NASDA) of Japan mapped the Amazon floodplain as part of their Global Rainforest Mapping Project, using radar data collected by the Japanese Earth Resources Satellite (JERS-1). As the satellite mapped tropical rainforests around the globe, different groups around the world became responsible for processing the data and making them available to the scientific community in an easy-to-use format.
Bruce Chapman is a senior engineer at NASA’s Jet Propulsion Laboratory (JPL) in California, which is the organization selected by NASDA to handle the data coming in from South America. Chapman was a principal investigator on the project. “With an optical sensor,” he says, “it can take years to create a cloud-free image of the Amazon. Even the supposedly ‘cloud-free’ image still has some clouds because there are places in the Amazon where the clouds just never go away. Radar wavelengths penetrate the clouds and provide a detailed image of the forests below. The radio waves can even penetrate the forest canopy and reveal the layers of structure within the forest right down to the ground.”
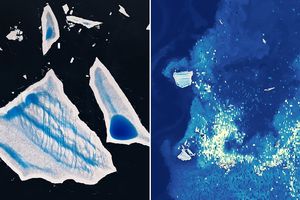
It’s this ability to see the underlying structure that enabled them to map the extent of the flooding. The water underlying the forest canopy provides a kind of amplification of the returned radar signal. Explains Chapman, “The water underneath the canopy provides something we call a ‘double bounce reflection.’ This double bounce occurs when the radar waves bounce off two perpendicular structures: the very reflective surface of the water and the tree trunks. This double bounce makes the return signal very bright. When we see that really bright signal in the Amazon, there is a good chance there are partially submerged trees.”
Making the Maps
The mapping of the Amazon took place in two phases: one data collection for the dry season and a second one for the wet. The first strip of radar data was obtained on September 27, 1995, over the east coast of South America. The satellite mapping progressed about 75 kilometers westward each day for the next 62 days, with the last strip collected over the west coast in mid-November. Beginning May 4, 1996, the satellite mapped the Amazon in flood. The picture was complete by July 3. Chapman and his team at JPL made the final maps available to the scientific community in March 2001.
Even with the radar data, though, there were limitations. The radar could only see rivers and streams at least 100 meters wide, but hundreds, possibly thousands of small streams branch across the Amazon. “To get those streams,” explains Richey, “we had to drill down even further, using Geographic Information Systems (GIS) data sets that had been collected over the years.” For the smallest streams they had computer models predict the volume and area based on topographic and geologic features.
Putting Together Maps and Measurements
Despite the aid of satellite data and years of observations, Richey and his colleagues couldn’t hope to study the whole Amazon. Instead, they focused their efforts on a large area in the central Amazon basin. They categorized the waters of the 1.77-million-square-kilometer study area into four geographic regions based on the hydrological characteristics: the main Amazon channel, the main channel floodplain, tributaries greater than 100 meters wide, and tributaries less than 100 meters wide. The region was further subdivided into up-, mid- and downriver regions. Based on the carbon dioxide detected in the river samples from each of these categories, they came up with an estimate for the entire study area.
Richey said they had suspected for years that the amount of carbon dioxide evasion could be large, but until they could combine their ground-based measurements with the satellite maps of the total flooded area, they had no hard evidence, no “smoking gun.” When the amount of carbon dioxide emitted from the sampled water surfaces was extrapolated to the entire flooded area within the study site, it totaled 120 million grams (264,550 pounds) of carbon per square kilometer per year. A rough estimate for the amount of carbon given off by the entire Amazon River basin was half a gigatonnne of carbon every year—a mass of carbon equivalent to more than 90 million adult elephants!
Says Richey, “When we put our measurements together with the satellite-based flood maps, we got an estimate of carbon dioxide emissions that was greater than 10 times the amount of carbon that washes out to sea in the river outflow. Hydrologists had long thought that the most important role of river systems in the global carbon cycle was in the carbon that flowed out to sea as dissolved organic and inorganic compounds. And now we had an estimate that the carbon dioxide flowing into the atmosphere directly from the river surface was almost 13 times larger than that amount.” For the first time, there was solid evidence of a large carbon source within the forest sink.
Identifying the Source of the Source
The carbon in the rivers comes from a number of places. Richey and his colleagues’ believe that most of the carbon originates in the non-flooded, upland forests. Accounting for 35 percent of the total, they believe, is forest litter that washes down from highland forests. The litter decomposes, giving off carbon dioxide. Another 25 percent of the carbon comes into the system directly as carbon dioxide when plant and tree roots give off carbon dioxide during respiration. The carbon dioxide becomes dissolved in groundwater that flows into streams and rivers. Another 15 percent comes from carbon-containing compounds that leach out of soil, leaf litter, and other biological matter. Those dissolved organic carbon compounds get metabolized by river life, ultimately returning to the atmosphere as carbon dioxide.
Richey estimates that only about 25 percent of the carbon given off by the Amazon River and its tributaries actually originates within the river itself, mostly in the form of aquatic vegetation that first fixes carbon dioxide during photosynthesis and then respires some of it back into the water. He admits those numbers are only estimates at this time. Despite the surprising discovery of this large source of carbon emissions, he says, so far the scientific community doesn’t seem bothered by the magnitude of his estimate. “There is definitely a sense of ‘here is a missing piece’ of the tropical carbon budget puzzle.”
Answers Produce More Questions
Where that carbon is coming from is more hotly debated. If most of the carbon dioxide released from the Amazon waters comes from carbon originally absorbed by the upland forests and washed down into rivers and streams, as Richey believes, then it would represent a real carbon loss from the ecosystem. But if it turns out the carbon dioxide is produced by vegetation in the river and in the adjacent flooded forests and lakes, rather than the upland forests, then the large emissions only counterbalance a large carbon intake by the aquatic vegetation. The source of the carbon dioxide seeping out of the Amazon waters is the subject of several ongoing studies.
Richey’s enthusiasm for the project and his excitement about the results don’t seem to have dimmed since the paper was published in the journal Nature in April 2002. “This study was a terrific assemblage of water chemistry data, GIS, theory, remote sensing, and tower dynamics. That’s why this was so fun—the integration—all these disciplines coming together to work on a problem.” The implication is that the coupling between the land and the atmosphere, and also between the terrestrial Amazon and the aquatic Amazon, is tighter than scientists previously thought.
Those who say that for every question science answers, it generates a dozen more can find evidence in Richey’s work. Richey himself is already thinking ahead. He wonders about the effect on this source of carbon from global warming and land-use change. He’s also beginning to think globally, and has also begun planning a similar study of the rivers and rainforests near the Mekong River in southeast Asia. And he’s not done with the Amazon yet either. Says Richey, “Not all the data we used in this study was gathered specifically to answer this question. Now we have to go back and get better, more detailed measurements, specifically targeted to answering our questions.”
References and Resources
- Richey, J. E., Melack, J.M., Aufdenkampe, A.K., Ballester, V.M., and Hess, L.L. (2002) Outgassing from Amazonian rivers and wetlands as a large source of tropical CO2, Nature, 416: 617-620
- Houghton, R.A, Skole, D. L., Nobre, C.A., Hackler, J.L., Lawrence, K.T., and Chomentowski, W.H. (2002) Annual fluxes of carbon from deforestation and regrowth in the Brazilian Amazon, Nature, 403: 301-304
- Amazon Facts from the Smithsonian National Zoo.
- LBA-ECO Website
NASA Earth Observatory story by Rebecca Lindsey. Design by Robert Simmon.