


Fire Effects from the 2023 Drought and Extreme Wildfire Season
By Laura L. Bourgeau-Chavez, Mary Ellen Miller, Dorthea J.L. Vander Bilt, Rachel A. Gumpper, and Chris L. Cook
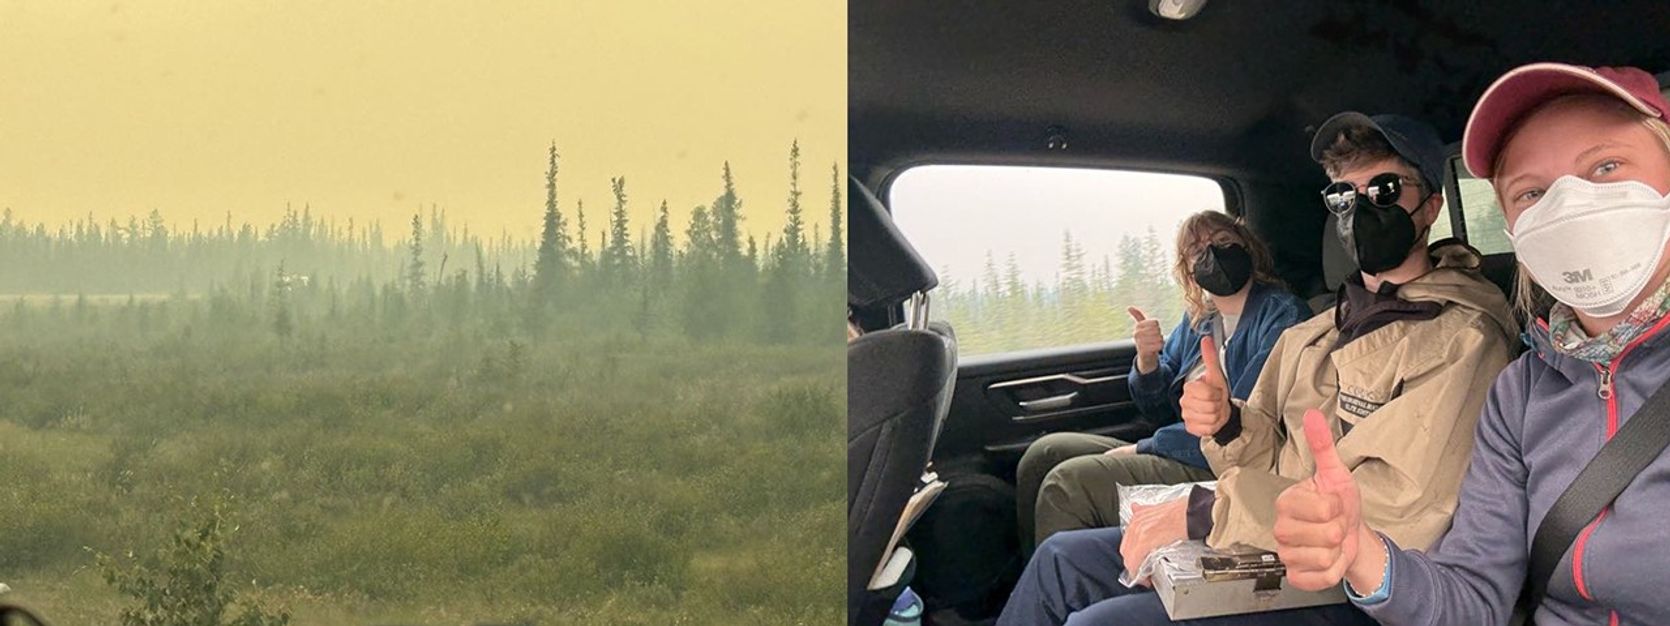
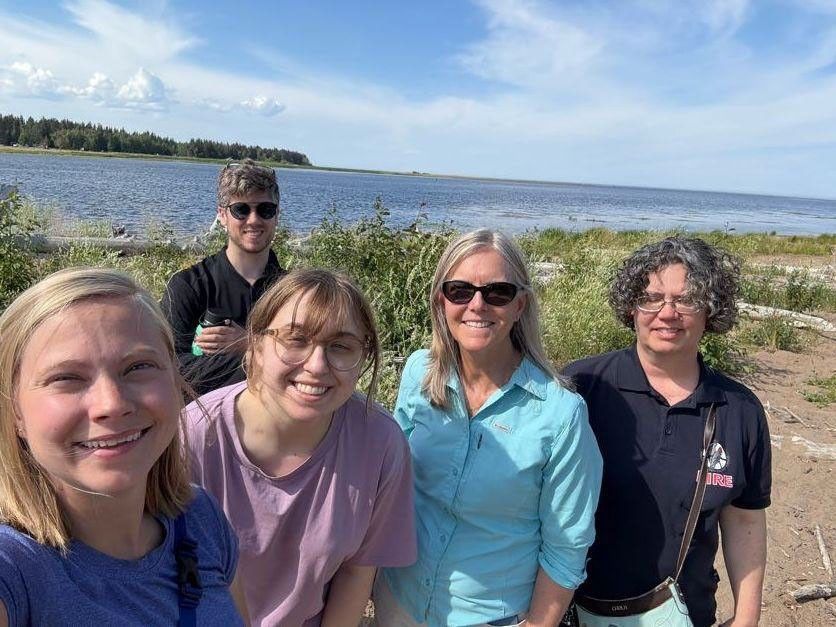
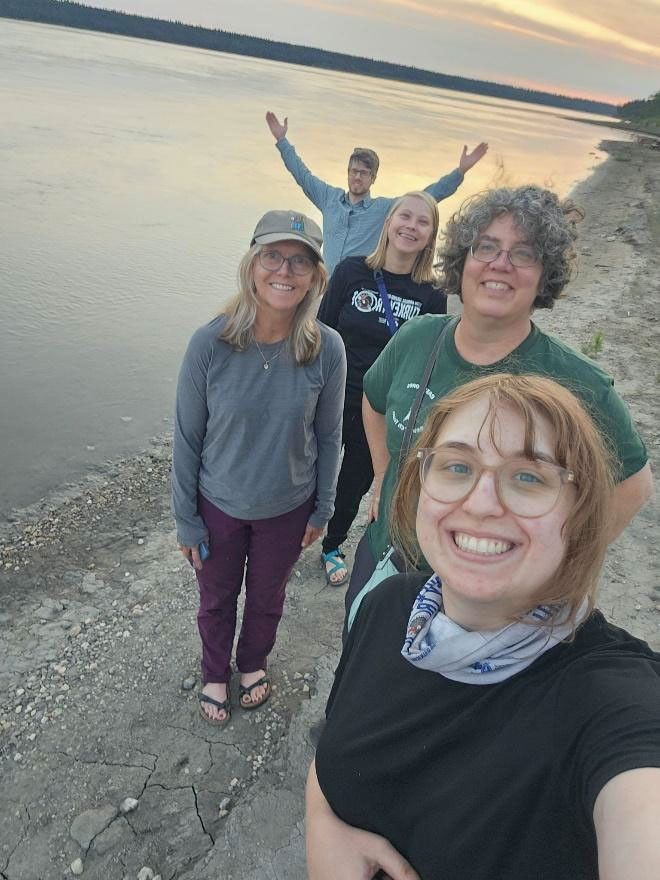
Our Michigan Tech Research Institute (MTRI) field team of five arrived in Yellowknife, Northwest Territories, Canada, on July 27, 2025, for a nine-day field campaign to sample the effects of the extreme drought and wildfire of 2023 on wetlands and uplands. The region experienced an unprecedented second extreme drought and record-breaking catastrophic wildfire season in just nine years, affecting both uplands and wetlands across the landscape. We are particularly focused on understanding how vulnerable the carbon-rich bog and fen wetlands (that is, peatlands) are to wildfire in such extreme conditions. The campaign is part of NASA’s Arctic-Boreal Vulnerability Experiment (ABoVE). Other teams, out in the field in 2024-2025, focused on sampling uplands. We want to know how severe the burns were, how deep the peat burned, and what is regrowing (i.e., what will the burn sites become after fire); will the dominant black spruce regenerate?
7/28/2025 Yellowknife, Day 1
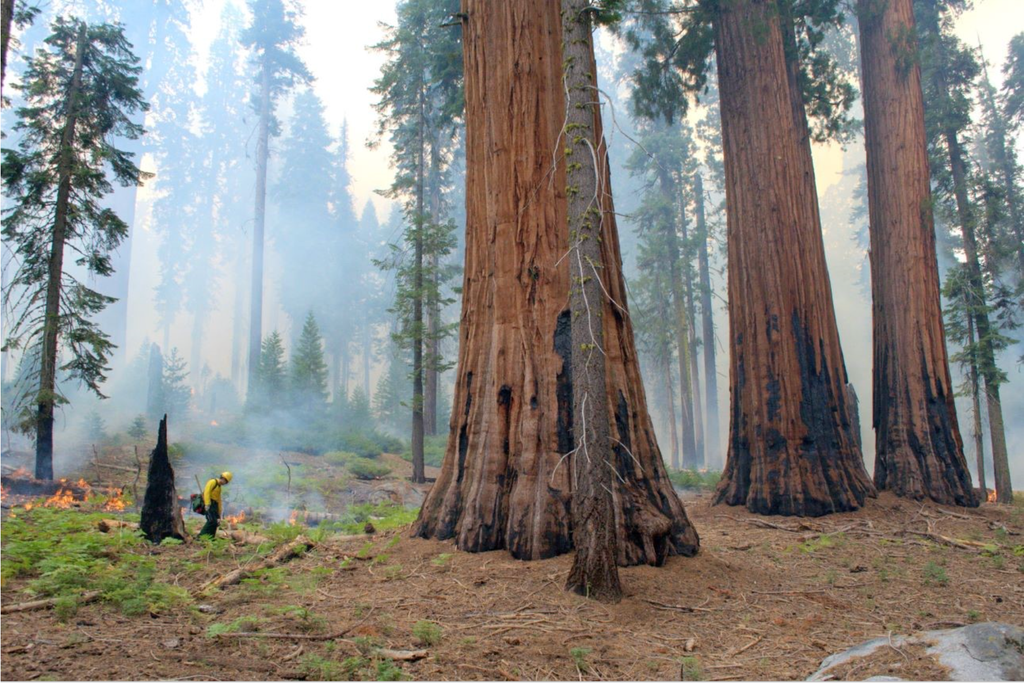
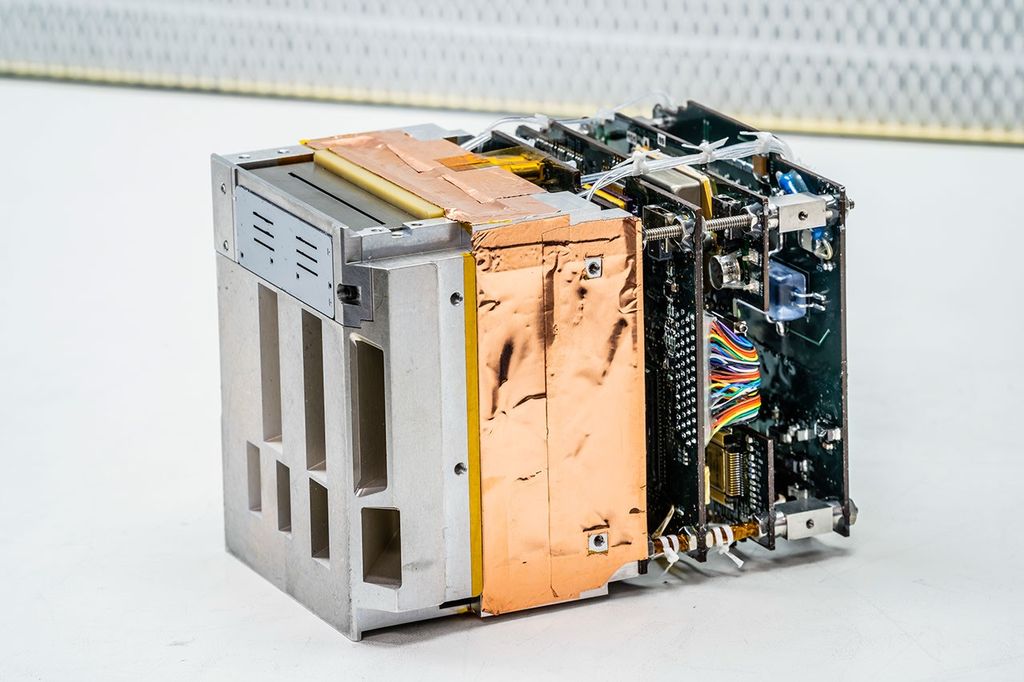
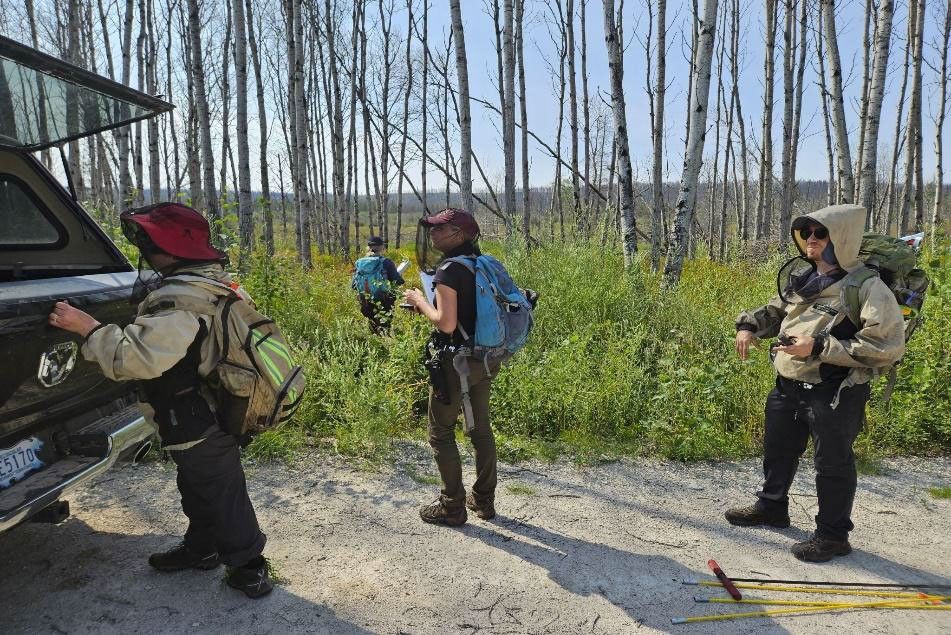
The field was a bit smoky. We began our fieldwork by visiting 2023 burned peatland sites near Yellowknife. Extreme drought conditions continue two years after the catastrophic 2023 fire season, and wildfires continue to ignite the landscape, mainly from lightning strikes. We picked up safety supplies, equipment, and food, including bear mace, from the field supply store Arctic Response. (Black bears are the main safety concern in the field.)
For some of the team, this was a first observation of a burn, and for others, a first observation of a peatland that burned. We took the day to train on what and how we measure in the field to quantify burn severity and fire effects. On this first day, we were testing out the methods and determining how many plots we should have within sites to capture the variability in the sites. We intend to visit as many sites as possible each day and observe them with our protocols. Given the relatively short time window that we have for the project, it will be a challenge to collect field data over four different 2023 burn scars.
As the principal investigator of the project, I have been studying fire in boreal landscapes for over 30 years and peatlands for over 15 years and have not seen such severe burning across the landscape before. We collected similar data for the 2014 wildfires in NWT, also focusing on the bogs and fens (i.e., peatlands) and how fire affected them. In 2023, just nine years later, an even more extreme drought and wildfire year occurred, and some of our 2014 burn sites were burned again. One of my goals for this field campaign and the remote sensing study is to train the next generation of scientists to continue the research.
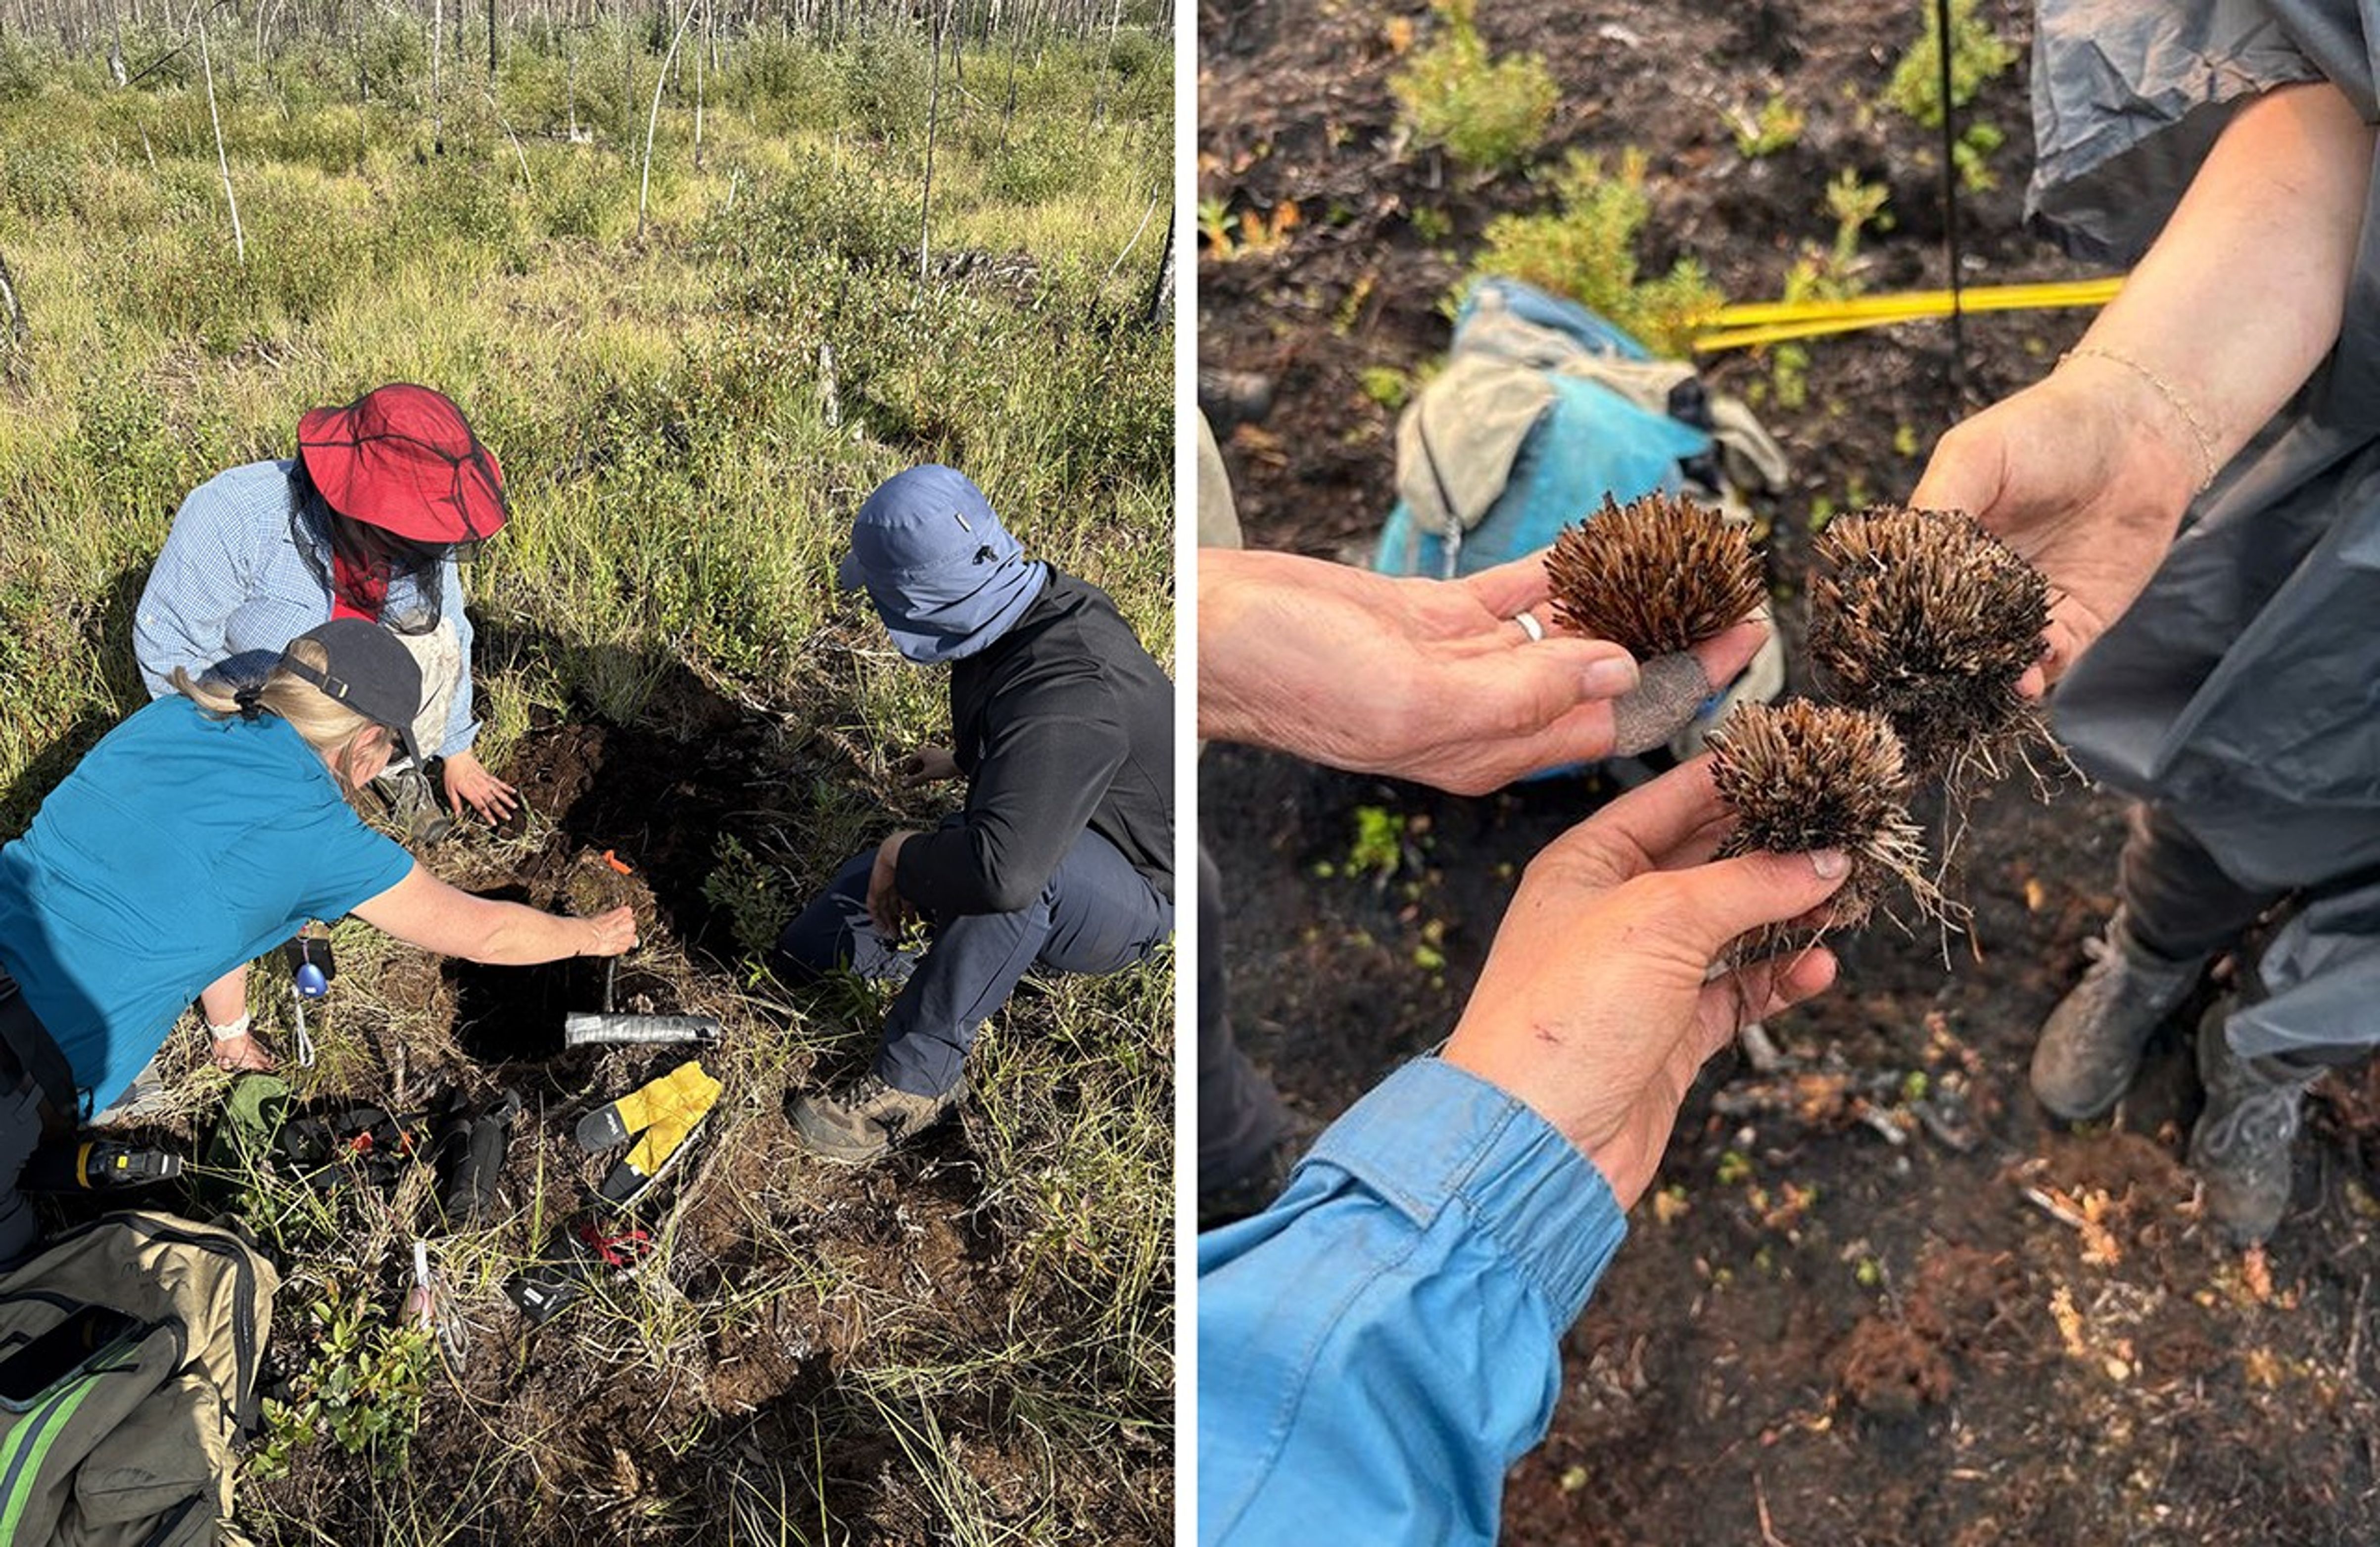
For comparison, we also visited unburned peatland sites near our Yellowknife sites. We reached a beautiful intact open fen with deep organic soils. Unburned peatland sites help show what peatlands would look like pre-fire: we walked through cushiony deep peat layers instead of crunchy charred soils, providing a context for the destruction found at the burn sites.

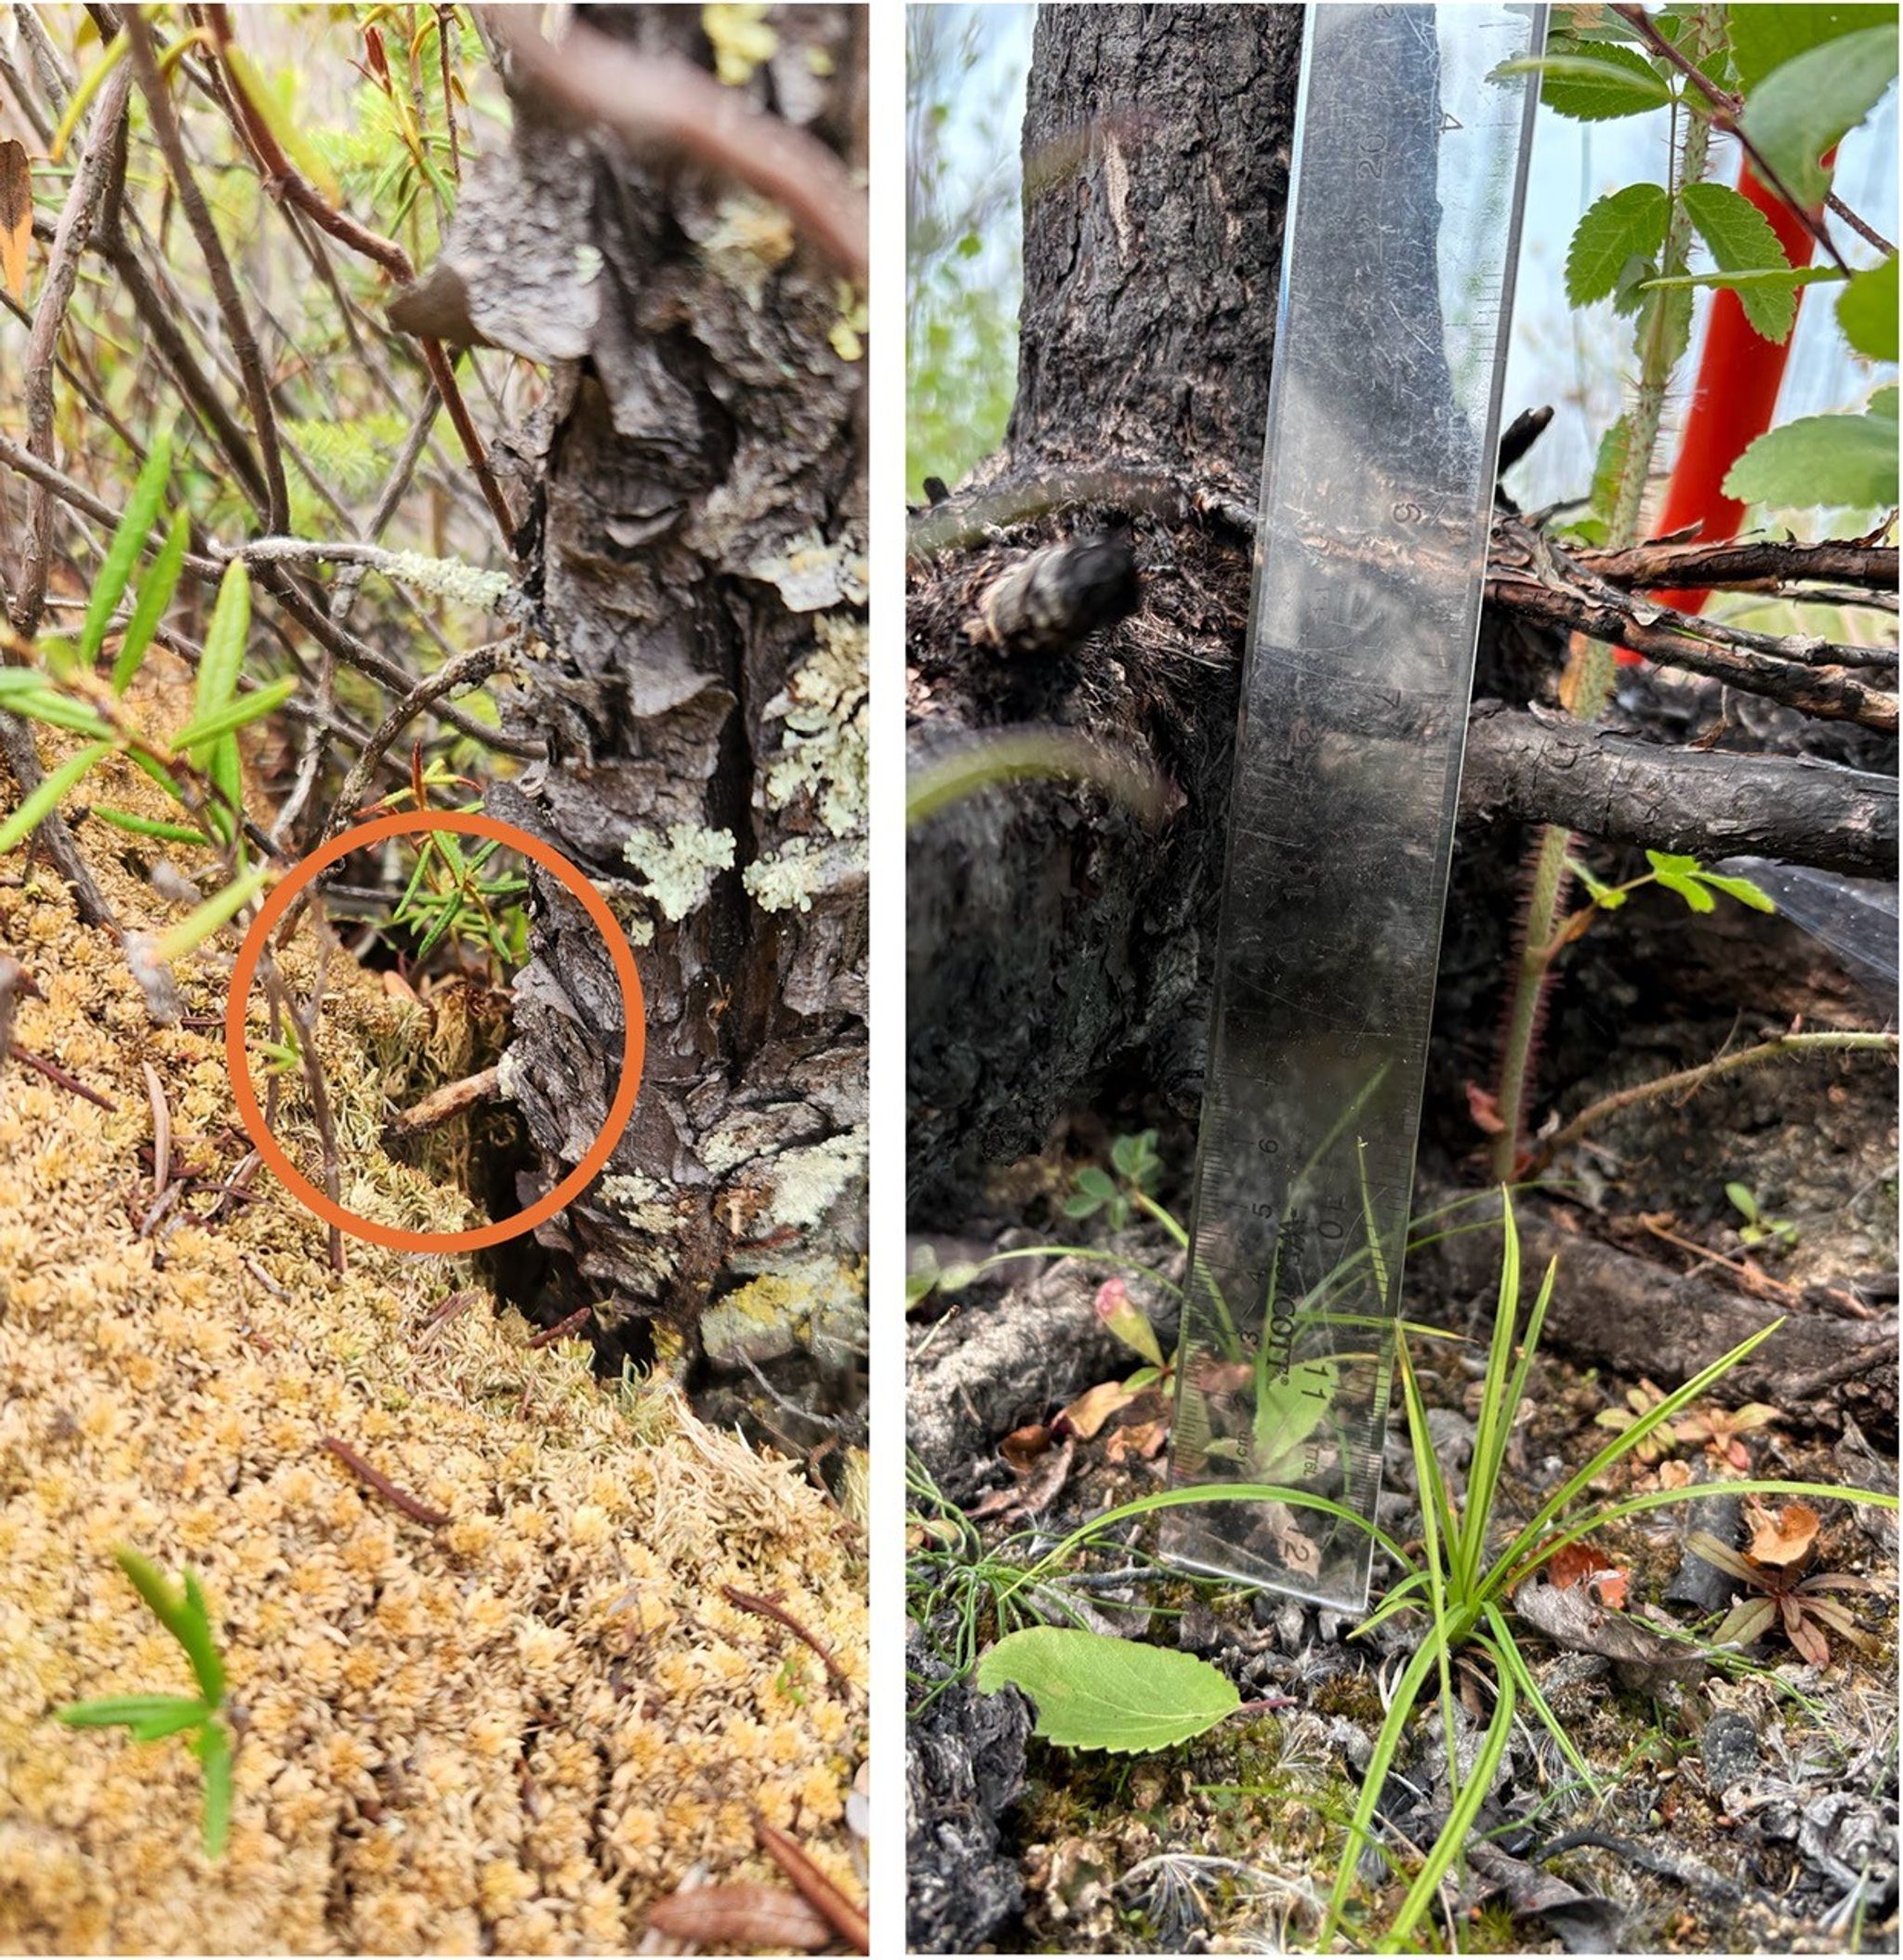
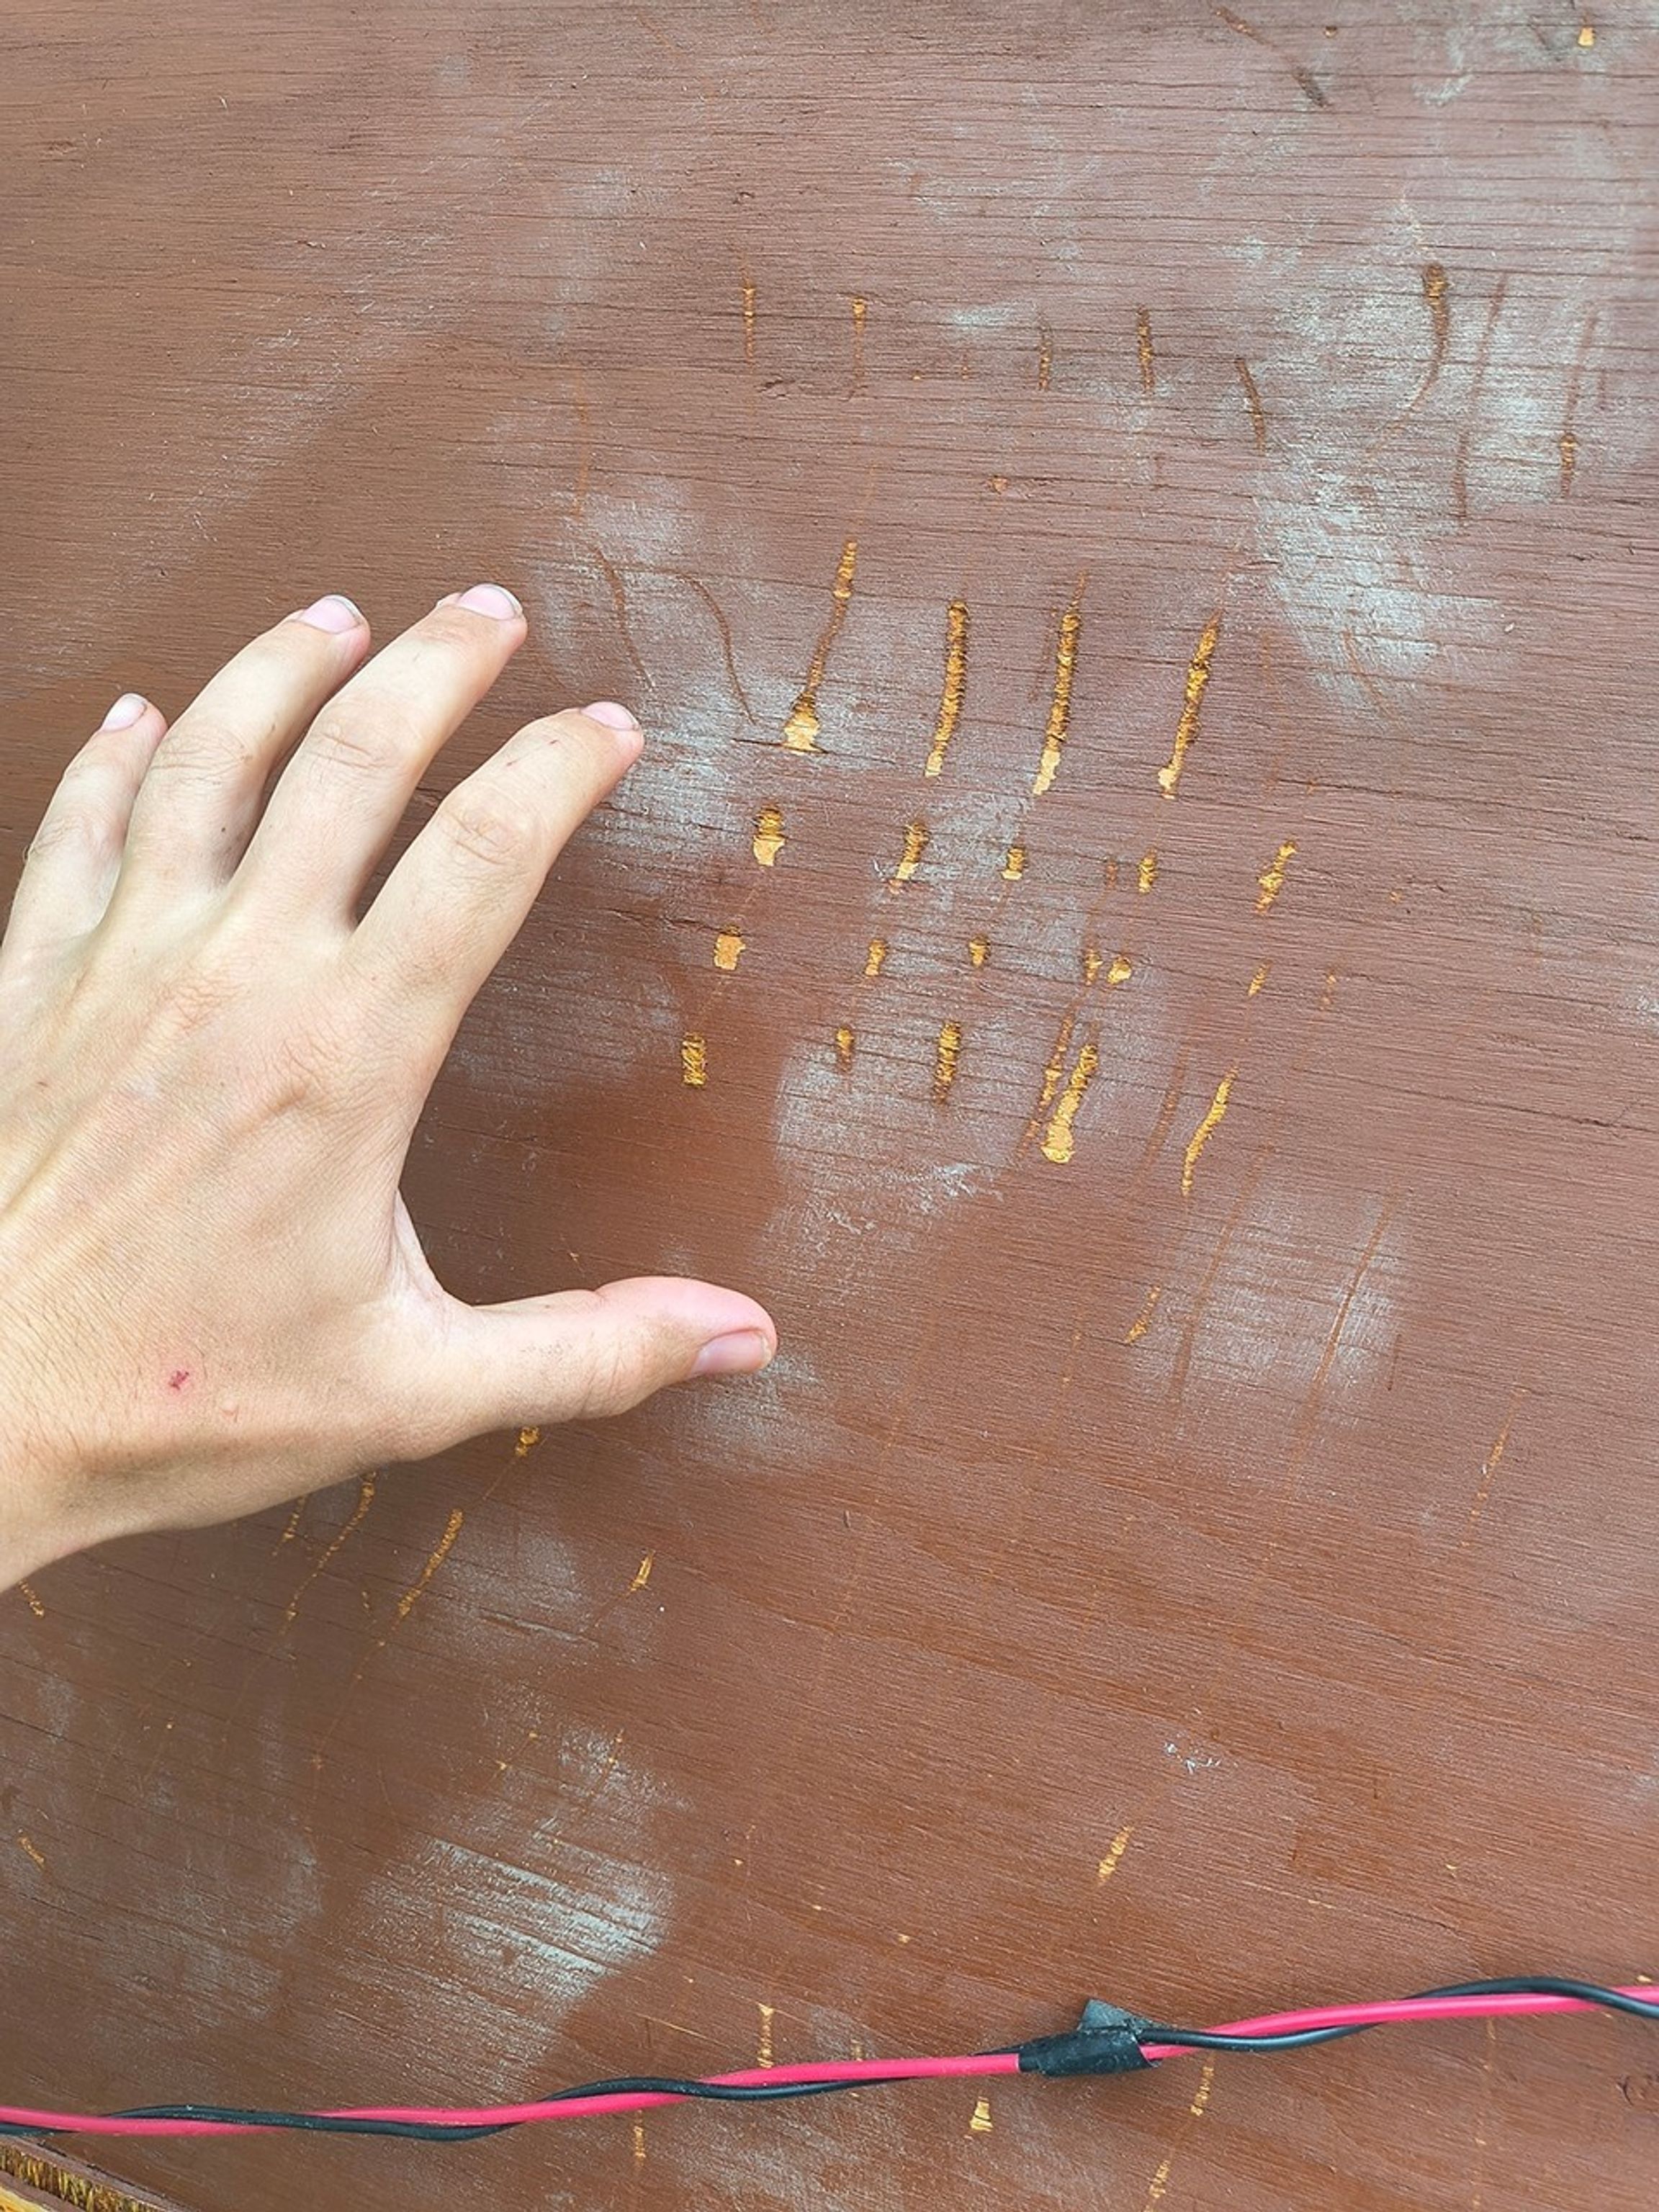
For example, the unburned black spruce in this peatland allowed us to show the team examples of adventitious roots, which develop in the moss as it builds up higher on the tree trunk. These roots take advantage of the moist moss while the trees are growing. After a fire, we use them to measure how deep the moss and organic soil burned down into the organic layers. Regular roots may also be measured if the burns are deep enough.
7/29/2025 Yellowknife to Hay River, Day 2
We began by packing up for a five-hour drive south to Hay River. We needed additional supplies, including food, to support long field days. We spent the day capturing data on unburned peatlands along our route while driving into the heavy smoke from current wildfires south of Yellowknife. Firebrands (small pieces of burning wood) from fires farther from the road torched trees along the roadside.
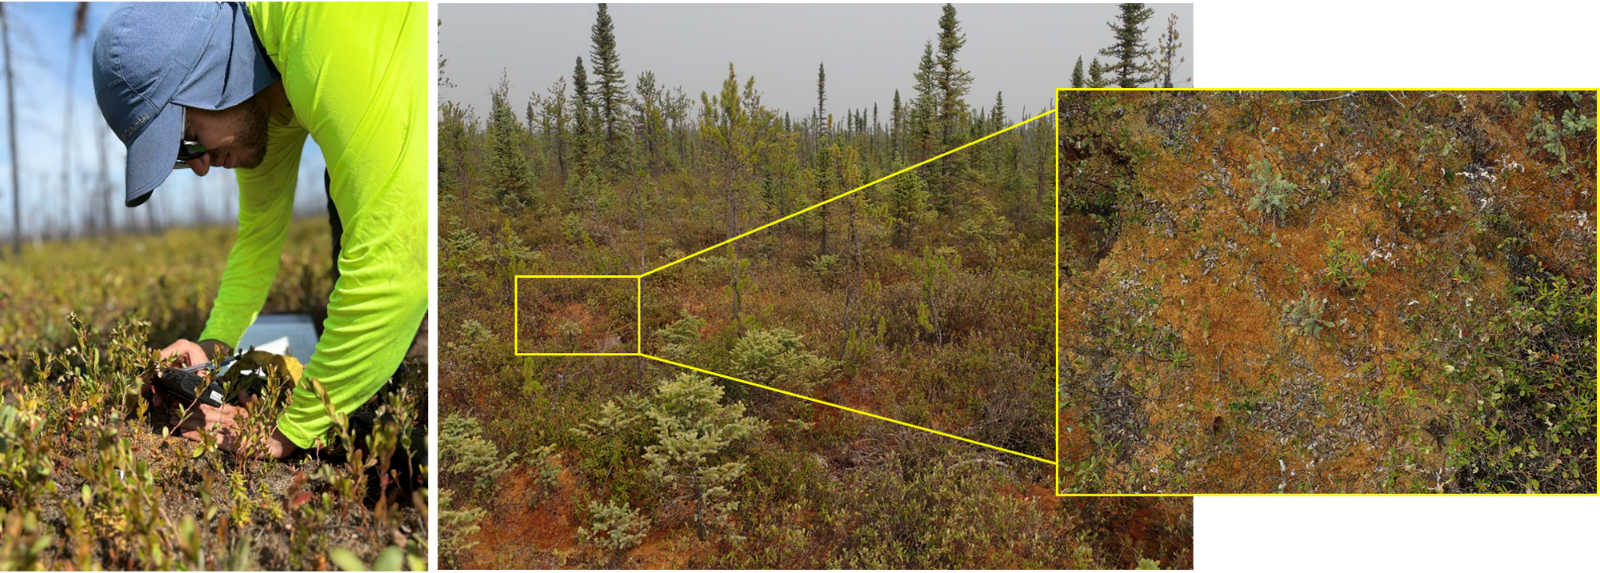
At the unburned sites, we quickly estimated the percent cover of different mosses. Chris Cook is working on mapping the distribution of sphagnum and feather moss across the landscape, using data from hyperspectral and multispectral optical and infrared imagery. Last year, we used an instrument to capture spectral signatures of the different moss types. The sphagnum moss holds water and remains wet even when the landscape is dry because it is able to pull water up from deep below; thus, it acts to suppress wildfire. We see the results in a burn site as sphagnum “sheep,” sphagnum that survived the fire. Feather mosses dry out more easily and carry a fire better.
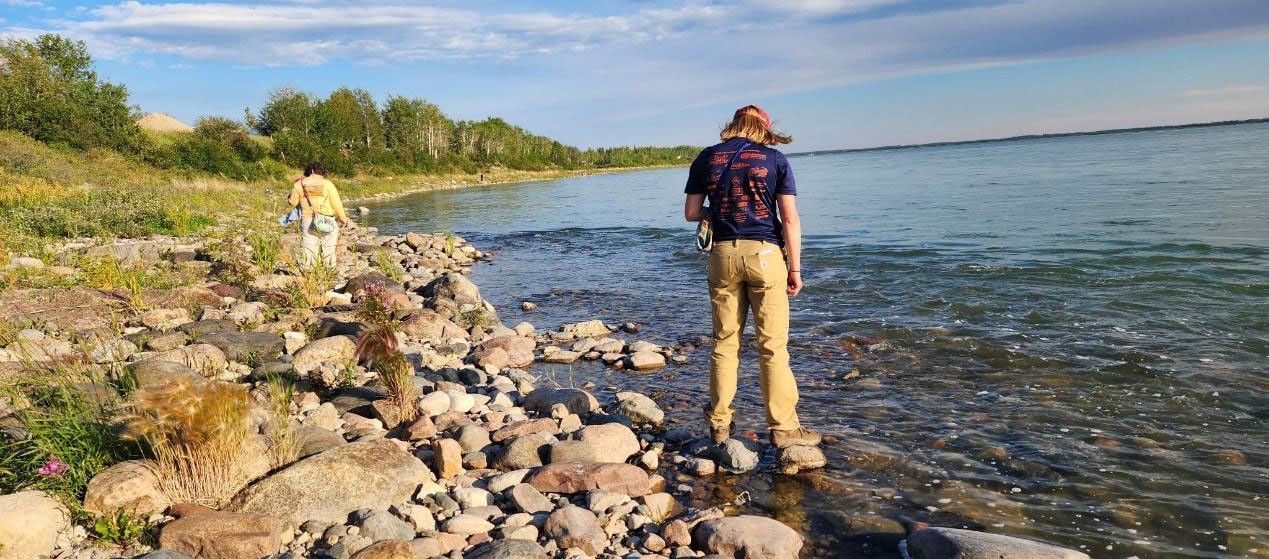
We stopped in Fort Providence at the Big River Gas Station right on the MacKenzie River for dinner. They had delicious white fish from Great Slave Lake. We took a hike down to the river and collected rocks before continuing our trip south.
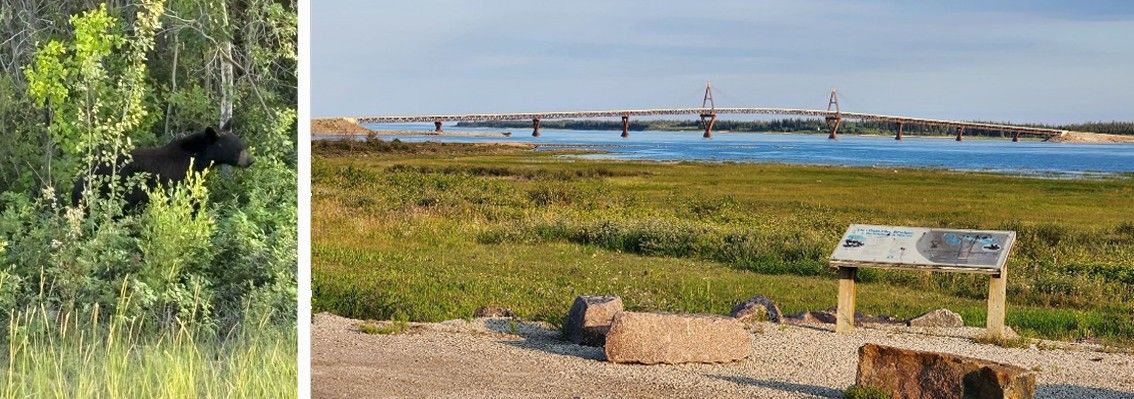
Leaving Fort Providence for Hay River, we saw our only black bear of the trip, munching on shrubs along the road, just before we crossed the bridge over the MacKenzie River. We were thankful that the bear was not near any of our sampling sites!
7/30/2025 Hay River, Day 3
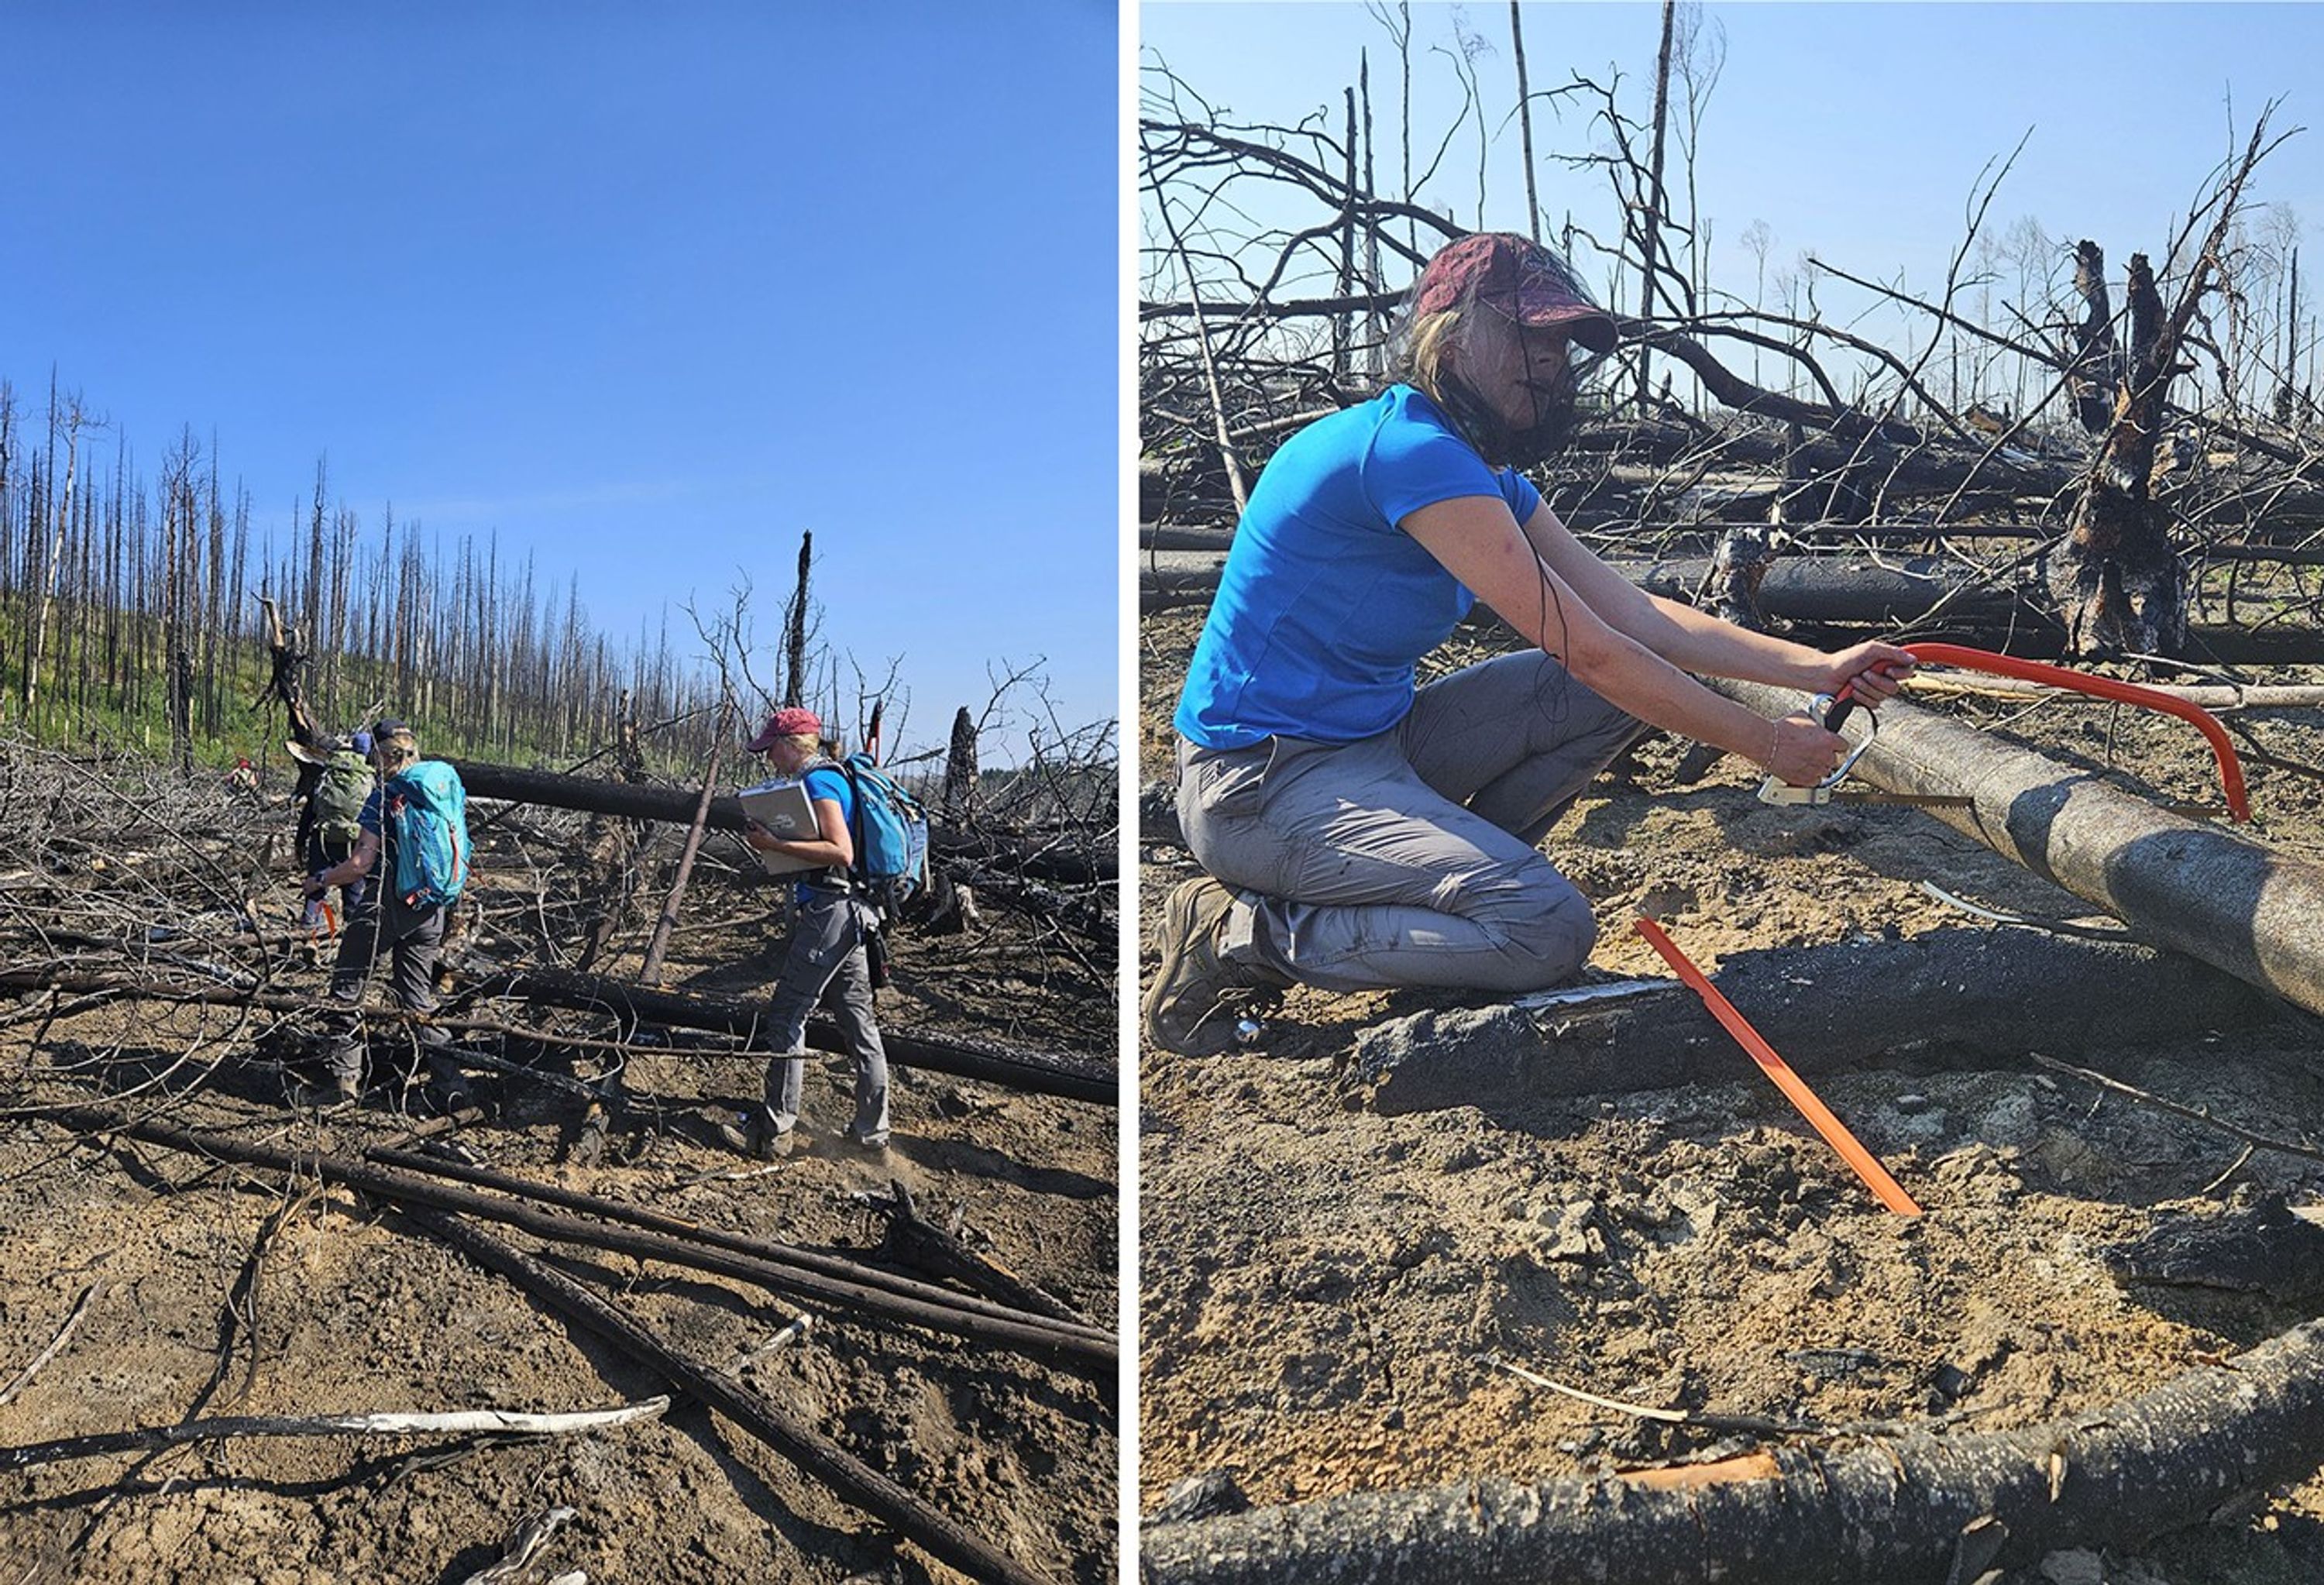
The field was smoke-free. In the morning, we set out to visit a high burn severity upland site that was good for comparison with our peatland sites. It had been sampled in 2019 by the Canadian Forest Service (CFS) and the Government of Northwest Territories (GNWT), which are collaborating with us. All the trees had fallen from the deep burning. This upland contrasts with the lowlands and peatlands that we are sampling.
We did a lot of climbing up and over fallen trees to get to our predetermined field location. Here we harvested the largest cross-section of a tree of the trip. The trees in peatlands are typically very small. Tree cookies (cross- sections) are used to age the stand and give us an idea of the number of years since the last wildfire. It was good that we stopped to pick up a bow saw in Yellowknife before heading south, as our folding saws would not have done the job on these thick trees.
In the middle of the day, we went to the hotel to wash ash and char from our faces and hands and become presentable. We went to meet with elders from K’atl’oDeeche First Nation (KFN) to discuss the changes in climate, extreme droughts, and wildfires and how they are affecting the overall landscape. We learned a great deal about the 2023 wildfire in Hay River. The elders told us of high-sustaining winds (60 kilometers per hour) that resulted in large areas being completely consumed, which reshaped the landscape as they remembered it. The fire blew through so quickly that satellites missed it, and thus the initial satellite hot spot data showed the area as unburned. The elders asked us to share our results with them. They told us to be sure to drive down to Great Slave Lake and check out their village and the lake.
Next, we went back into the field to collect more data. We got back to town with 90 minutes to spare to get dinner at the hotel restaurant before closing time. Successive long days in the field are normal for our field crew, taking advantage of the long day lengths in the summer and fitting in as many sites as possible in the timeframe of the field campaign.
7/31/2025 Hay River to Fort Smith, Day 4
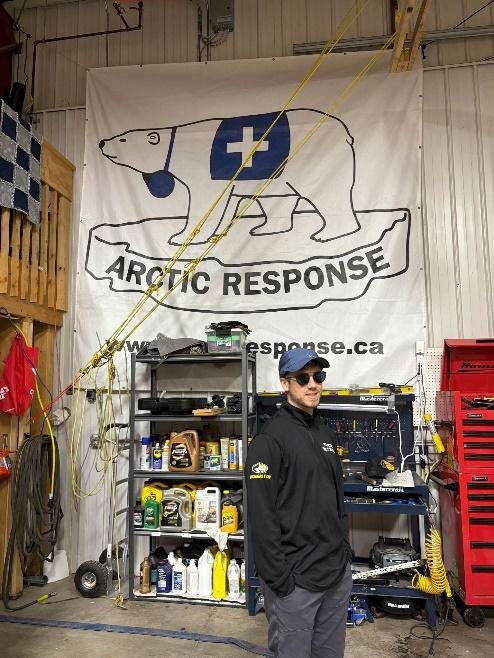
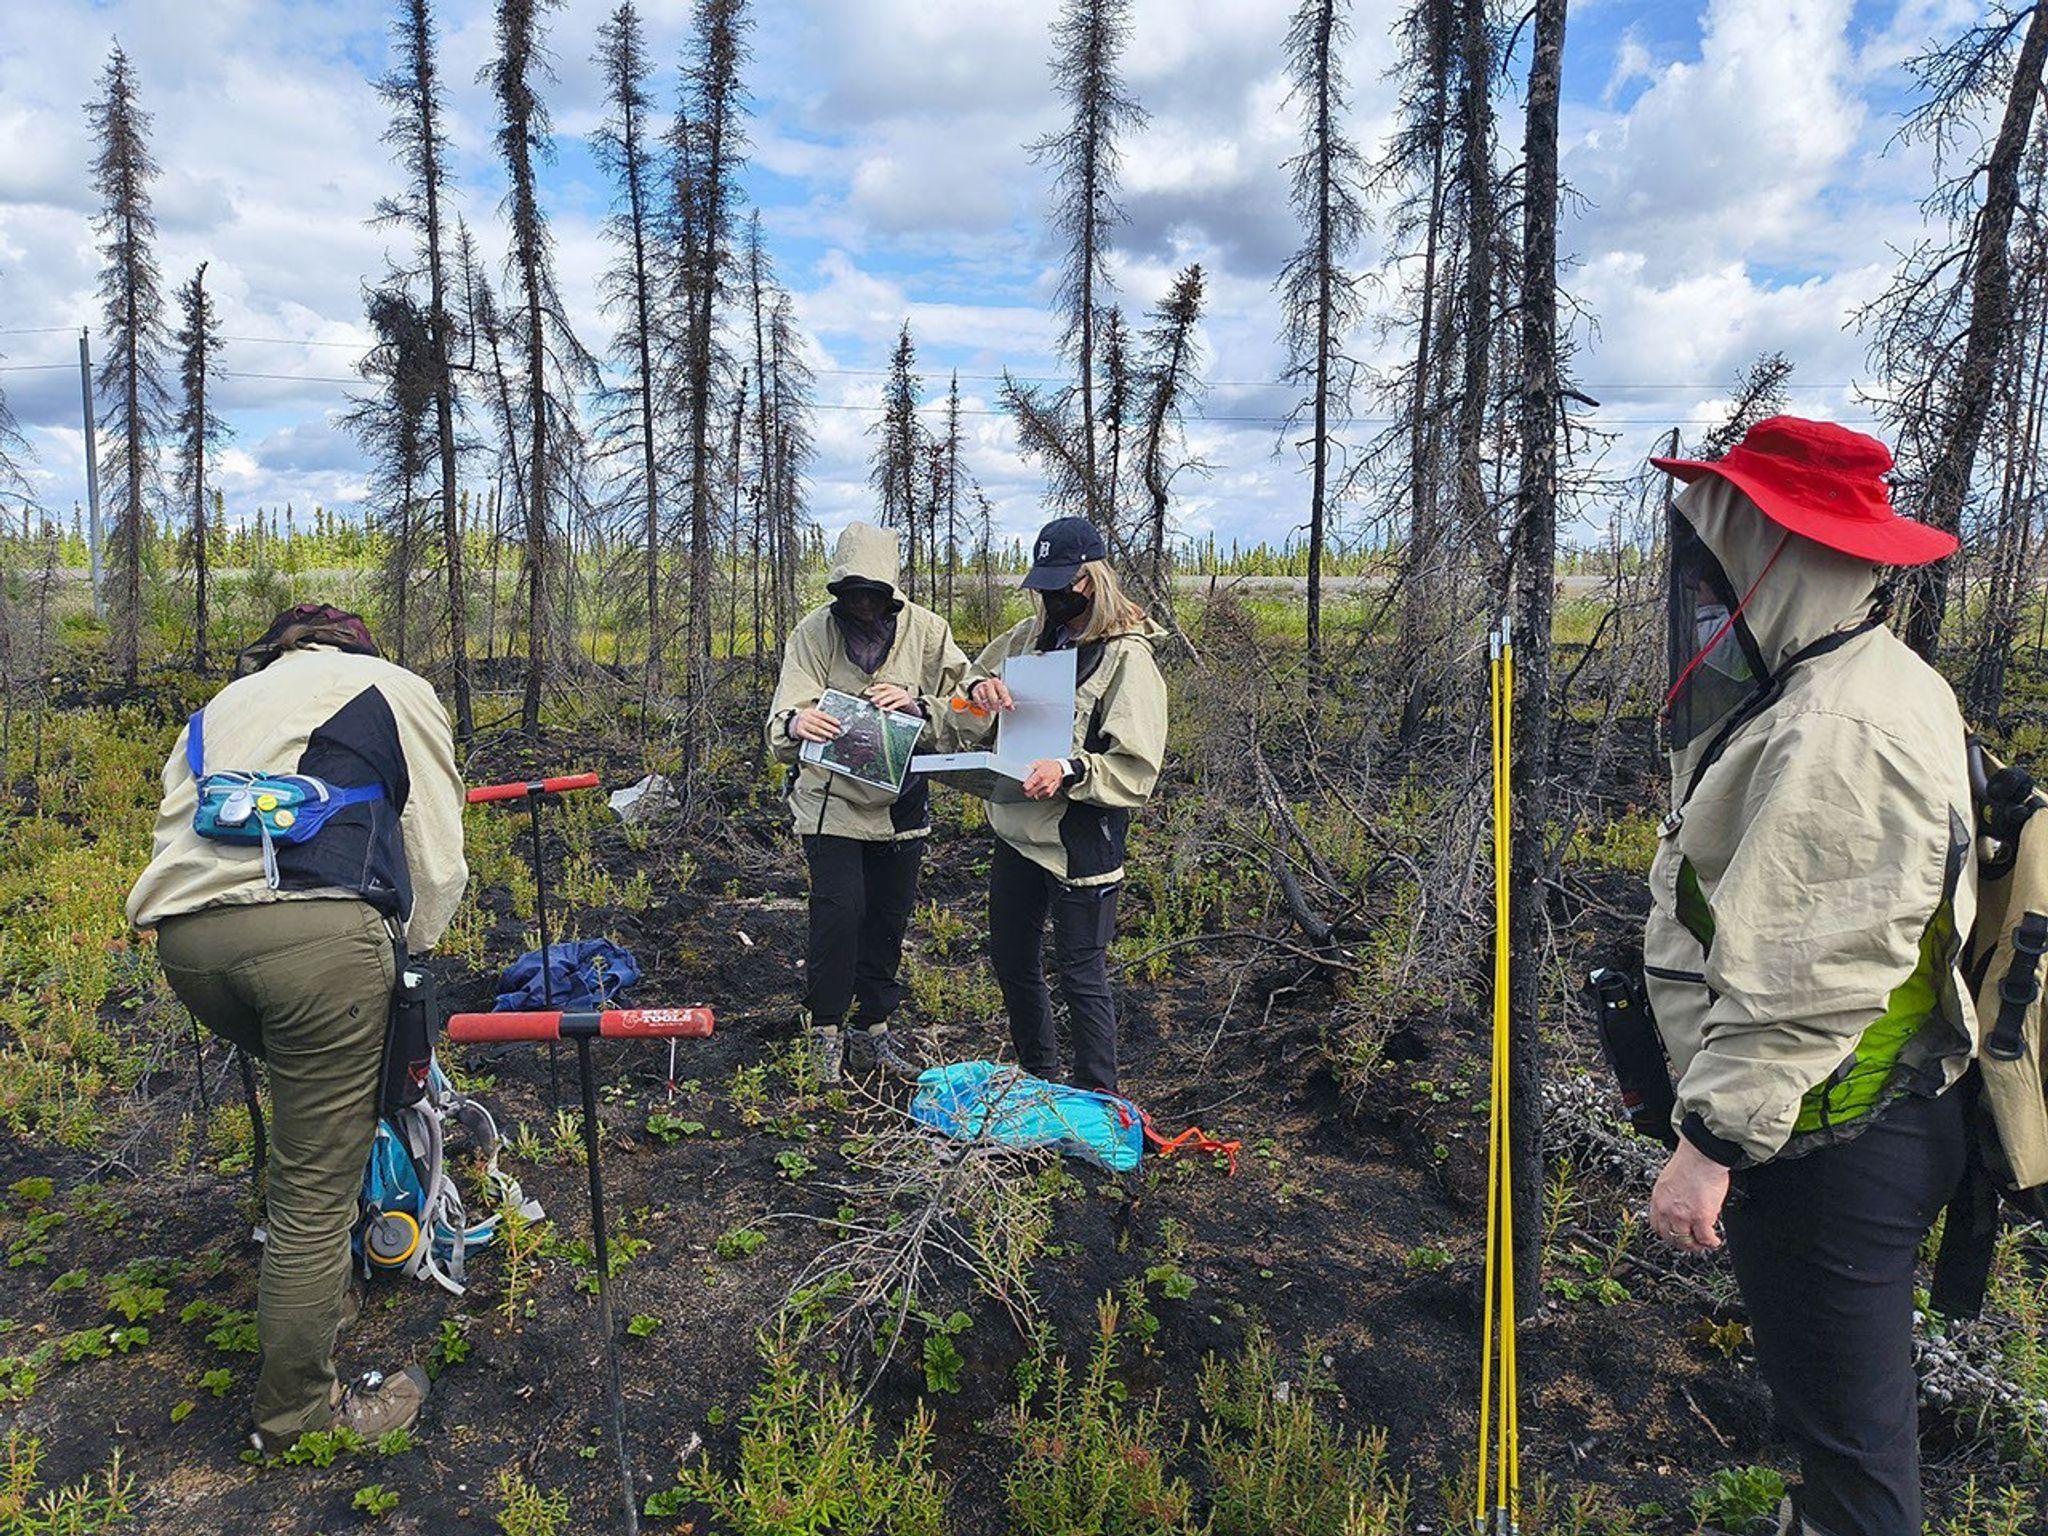
Another smoky day that required wearing masks in the field. We collected data at several sites along the three-hour drive to Fort Smith. Some of the shrubby and open fens recover quickly with lots of sprouting shrubs post-burn, and it is at first difficult to see that the site did burn. The soil pits and inspection of root collars, tussocks, and trees help provide information, as well as the char and ash that we sample.
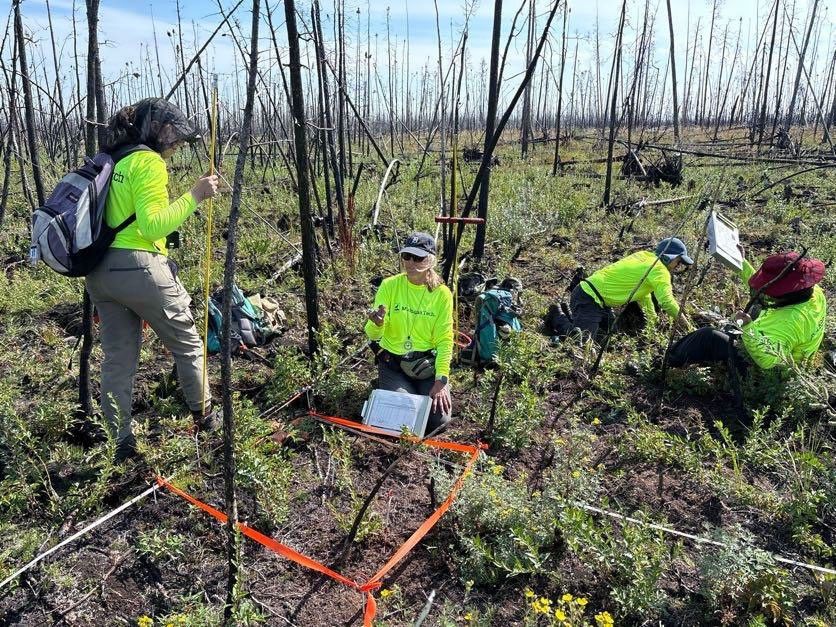
![] In a sunny meadow, three researchers work in a plot laid out with white string. To the left, one researcher, wearing a baseball cap, N-95 mask, and t-shirt, writes on a board propped on her stomach. Beside her, another team member crouches on the ground, examining what’s below. In the background, a third researcher can be seen bending toward the ground, which is covered in thigh-high sprigs of wildflowers and grasses.](https://assets.science.nasa.gov/dynamicimage/assets/science/esd/articles/2026/nftf/fig12.5.jpg?w=2048&h=946&fit=clip&crop=faces%2Cfocalpoint)
At the end of the day, we arrived at the Wood Buffalo Inn to stay for four days. The team was happy to be in one place for several days, but trying to capture so many of the wildfires required lots of travel.
We met researchers also staying at the inn, and found out they were from Parks Canada and also studying peatlands, although not wildfire in peatlands. We exchanged information and kept in touch in the following days and plan to share data.
8/1/2025 Fort Smith, Day 5
We collected data at more peatland and lowland (non-peat) sites. For this region, our maps of peatland types were incomplete, so we relied on other map sources. The sourced map proved to be inaccurate as far as peatland ecotypes but was helpful at finding permafrost complexes. The Parks Canada field team told us that they were using the same map source and finding it inaccurate in their fieldwork as well. Thus, we had to rely on some field reconnaissance to determine site suitability. In treed peatlands, the trees are mostly stunted black spruce and often ‘drunken’ or leaning due to the permafrost. We looked for those features before heading into sites.
In the afternoon, we met with fire managers from GNWT in Fort Smith to further discuss the wildfires of 2023 and conditions in 2024-2025. They are collaborators on our project and are conducting their own research on wildfires of 2023 and other years to better understand the changing conditions. Because of climate change, recently burned sites and wetlands are no longer acting as fire breaks, so the fire managers are rethinking their strategies to protect communities. We also stopped at Aurora College to drop off information on our project, along with stickers and cards and other goodies from NASA for the students. We were in the field until really late, and all the restaurants were closed, so we made a pasta dinner at the inn where we were staying.
8/2/2025 Fort Smith, Day 6
We collected data at more peatland and lowland (non-peat) sites. By this point our team was getting very efficient at collecting the necessary data. Everyone was learning about the different soil types and as field work progressed, coming across new conditions and new positions to gain access to the soil pits. Dorthea Vander Bilt is using the field data on peat depth and peat concentration by peatland type to estimate carbon storage. These estimates are then scaled up using our peatland maps to the landscape scale carbon storage.
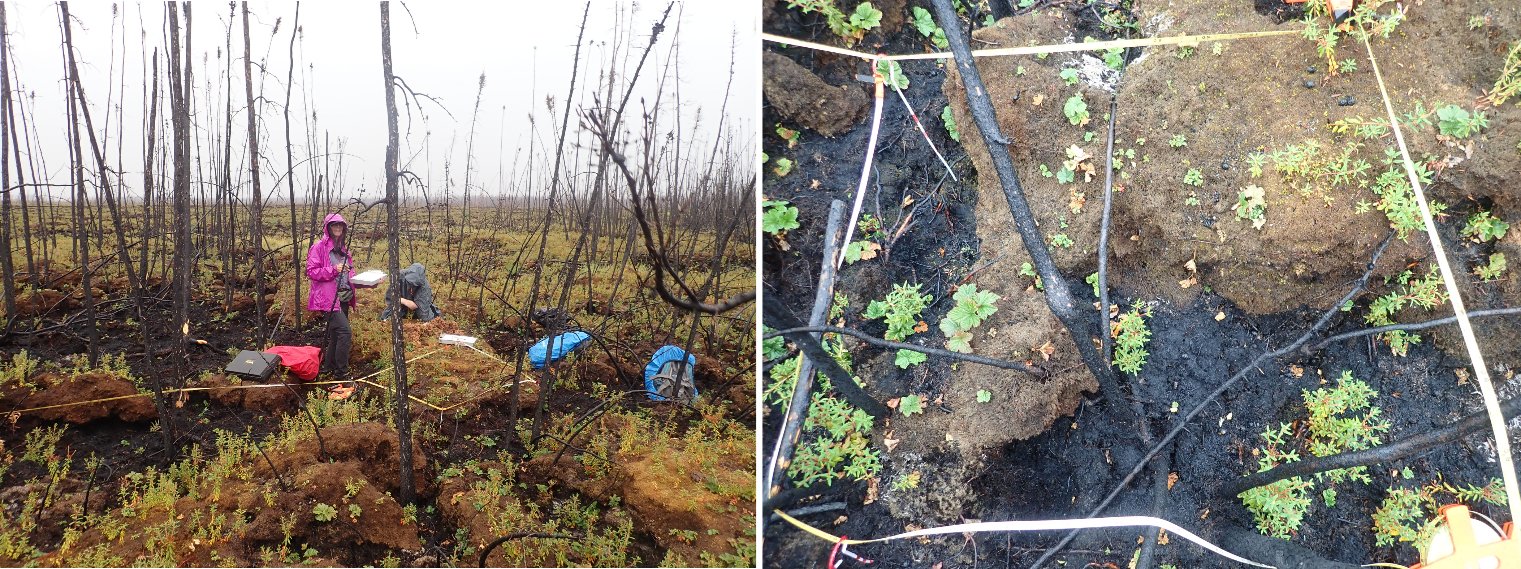
We dig a soil pit to determine the soil horizons present and how deep the peat is. We have harvested samples in past years to get carbon concentration by peat depth and ecosystem type ( bog or fen). Often times the peat is just at 40 centimeters deep, which is how a peatland is defined, and sometimes we hit mineral soil then, or rocks or ice. At other sites the peat is deep, measuring 160 centimeters or even over 200 centimeters before you hit the permafrost or ice layer. The deepest measurement we had was last summer in a burned open fen where we probed 300 cm of peat before hitting ice. For this we use the yellow chimney cleaning rods that you can see in these field photos as peat probes.
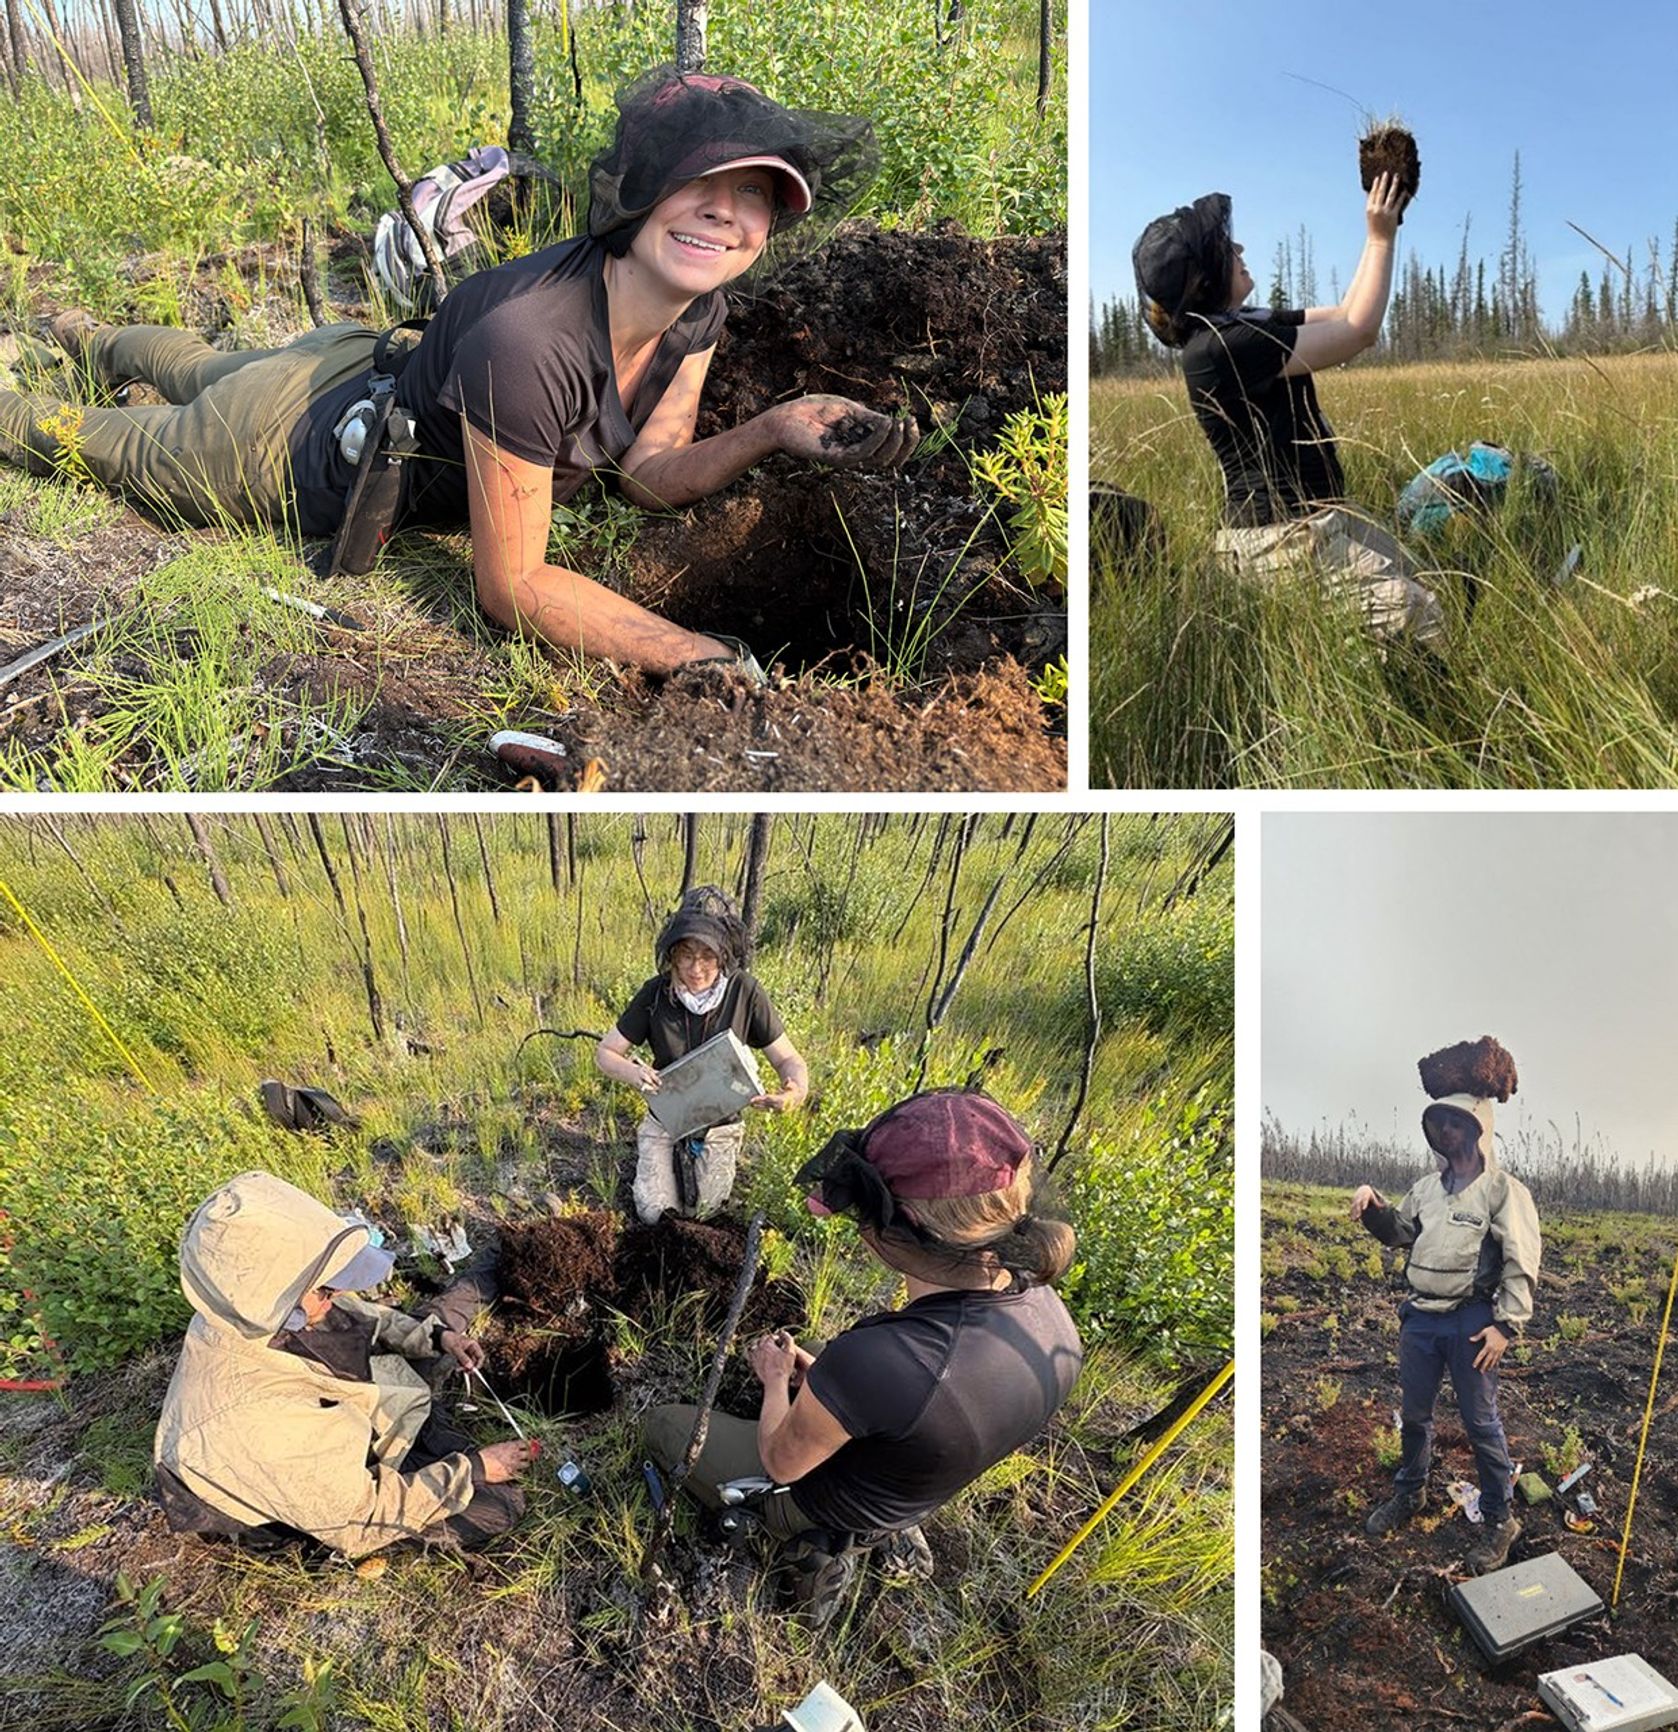

For some of the soil pits, we hit ice before 50 centimeters, and there was excitement at finding permafrost! For several team members, this was their first experience of permafrost, and everyone took turns touching the smooth ice in our soil pits. Once ice was found, no more digging was possible, and the pit was complete.
Rachel Gumpper is just beginning to study peatlands, and this year she learned how to map wetlands and peatlands from the multi-date radar and optical satellite imagery we typically use in our research. She will be extending the maps we previously created for the Great Slave Lake area to include the fires down by Fort Smith and into Alberta, as well as other areas of 2023 wildfires, to capture what the landscape was composed of pre-fire. She also worked on applying a burn severity algorithm to Landsat imagery of the peatlands and uplands that tells us how severely the ground and organic layers were burned. We developed the algorithm based on 136 wildfires that occurred in 2014. Our field data will help validate those maps for the 2023 wildfires.
8/3/2025 Fort Smith to Hay River, Day 7
We visited six sites, including one upland with some ash that delighted Dr. Mary Ellen Miller. She is currently working with the USDA Forest Service to map post-fire ash depth and color. Ash color is an important indicator of soil burn severity and consumption, with lighter colors representing higher consumption.
While digging the soil pit at a site just west of Fort Smith, Dorthea Vander Bilt discovered a treasure trove of buried ash that was over 3 centimeters thick and of a light color, indicating a high severity burn. We are not sure if the ash was deposited at the site by wind or if perhaps our peat pit was a localized spot of high severity–likely the latter. Typically, in the organic layers we see char and singed or consumed moss layers and other ground consumption, but little ash. Ash crops up with each of our steps in the peatlands, but it is otherwise not noticeable. Ash is more common in the upland sites where organics are not as deep as peatlands, and much of the organics are consumed by fire in uplands.
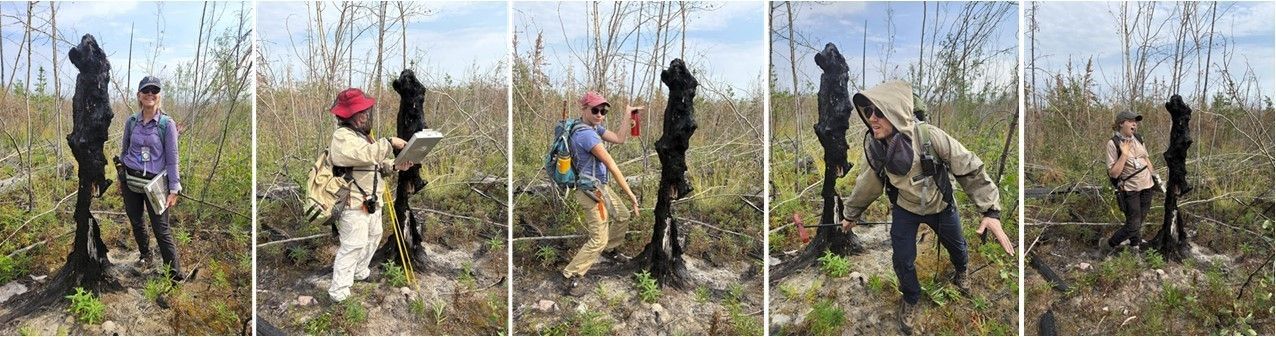
This site also provided an opportunity for getting silly and posing cameos with a burned tree trunk that looked like a dark shadow.
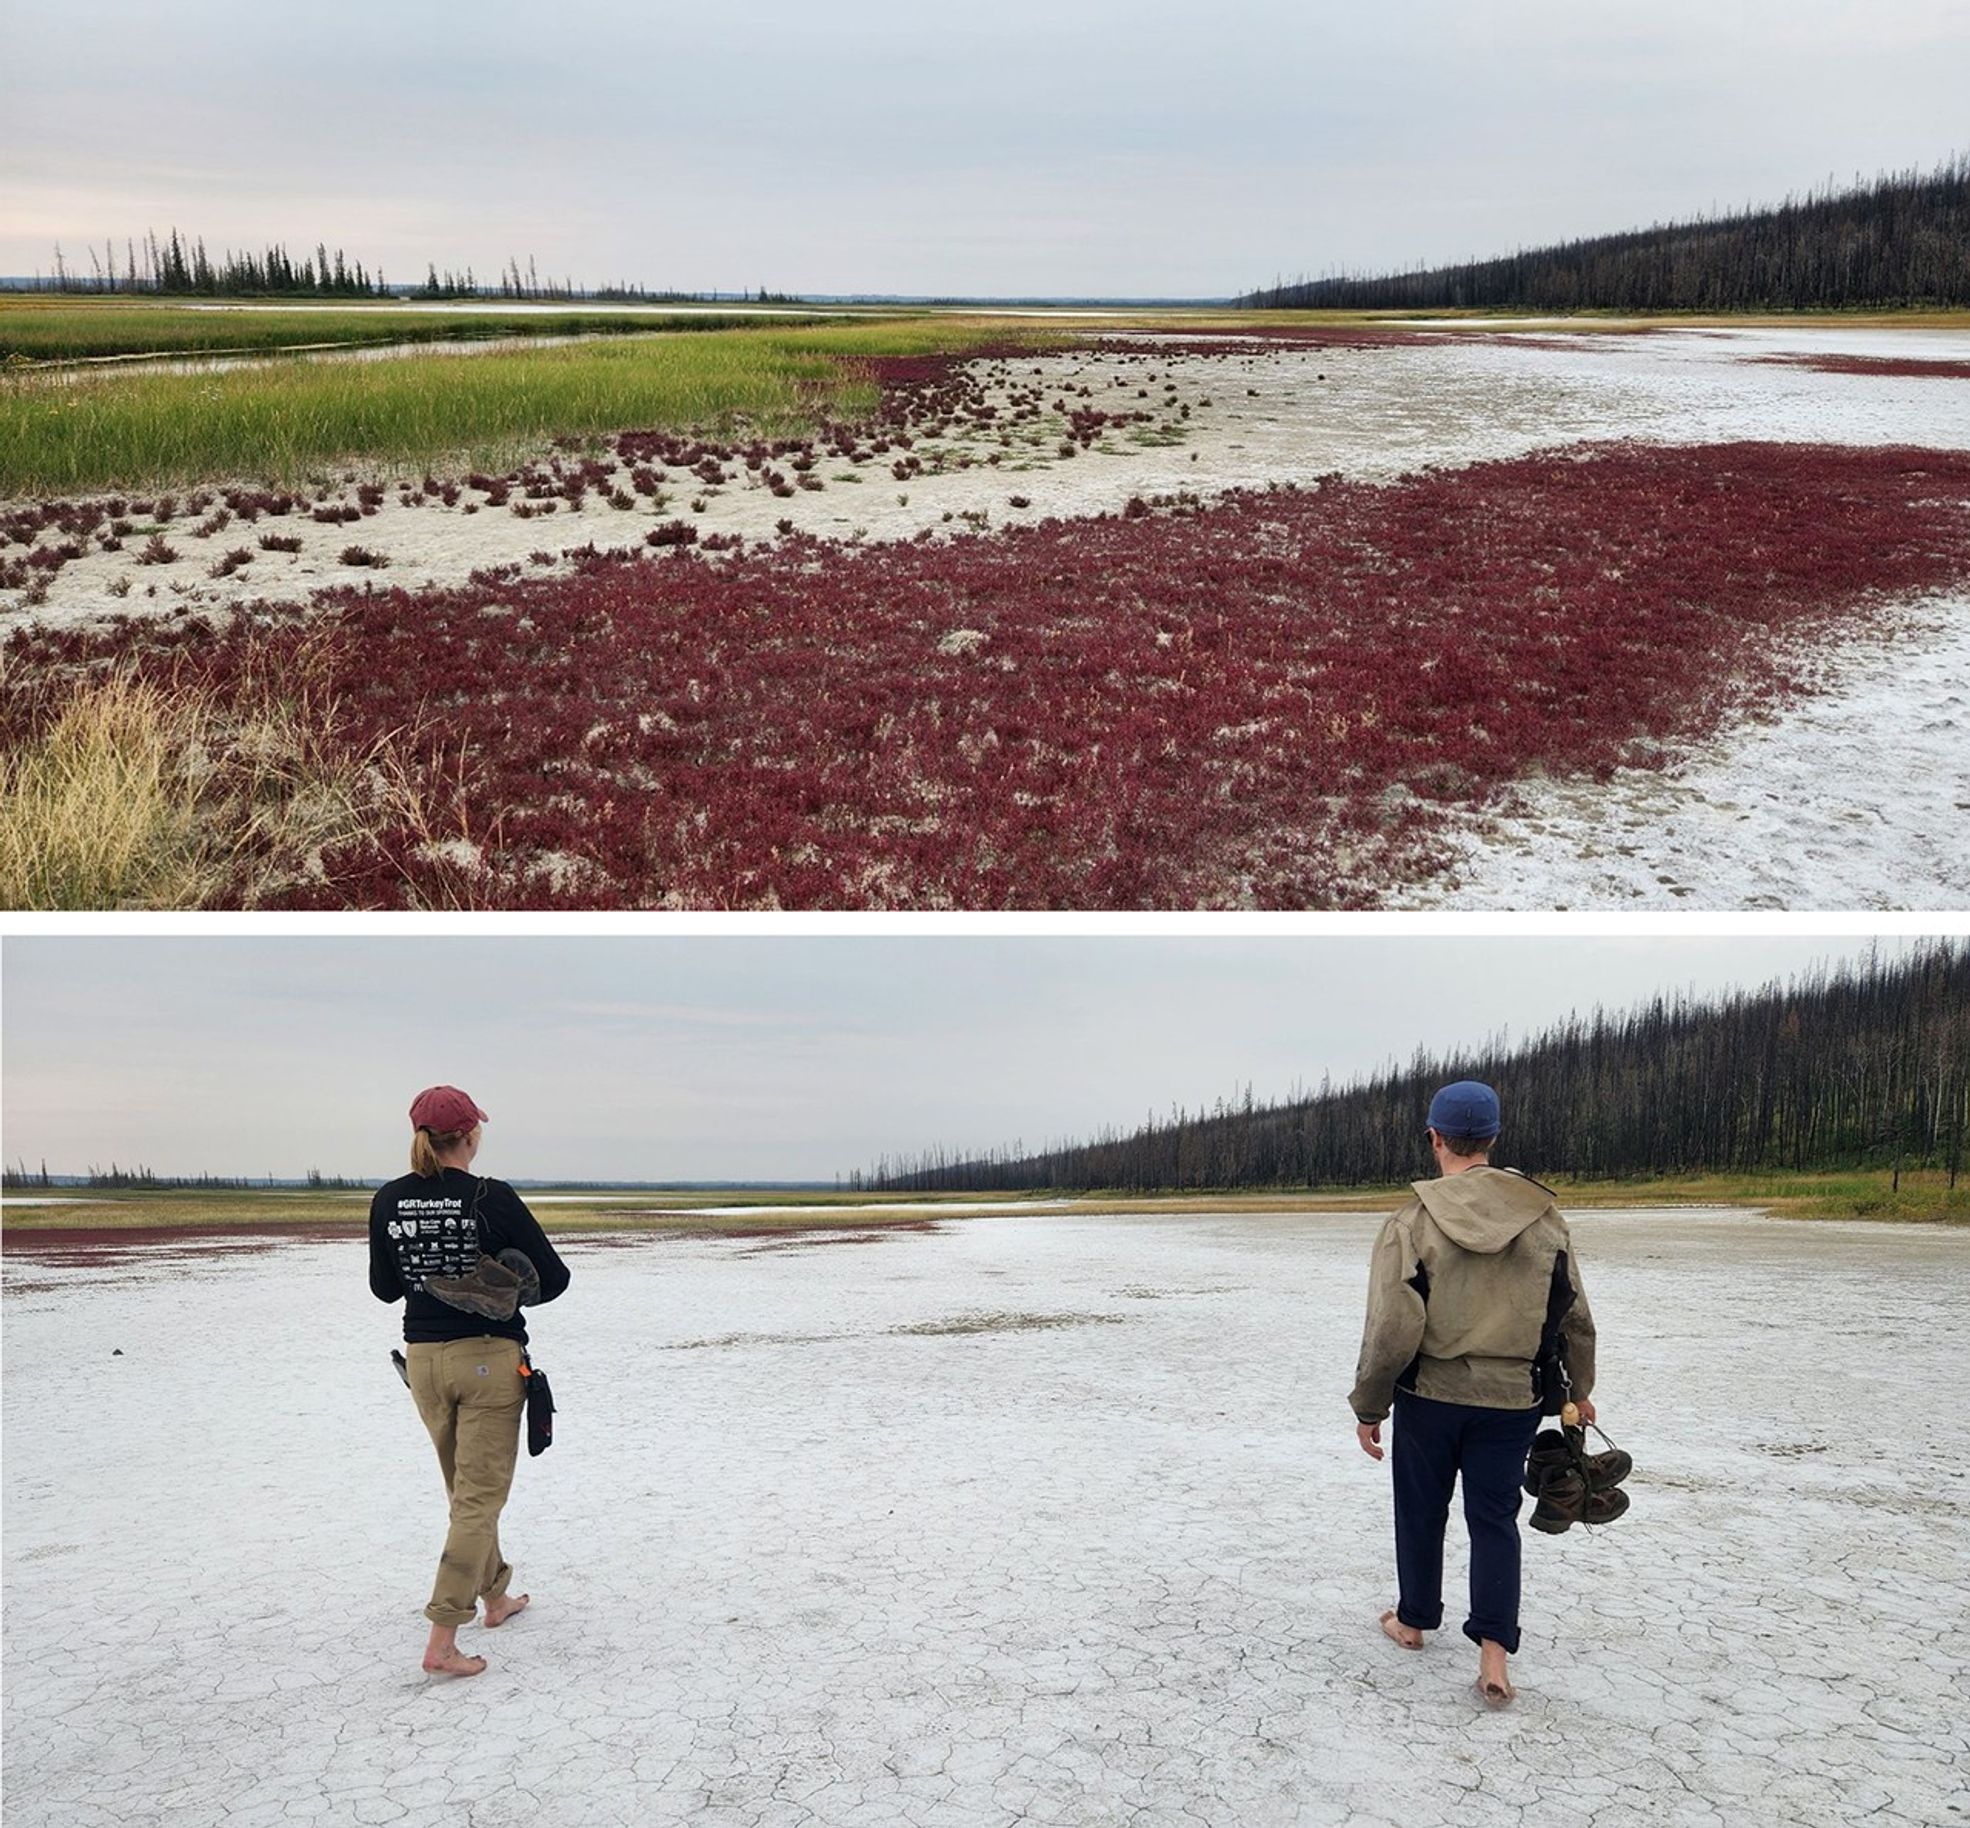
One of our last sites near Fort Smith this day was near the Salt Flats in Wood Buffalo National Park. We took a trek down to check them out.
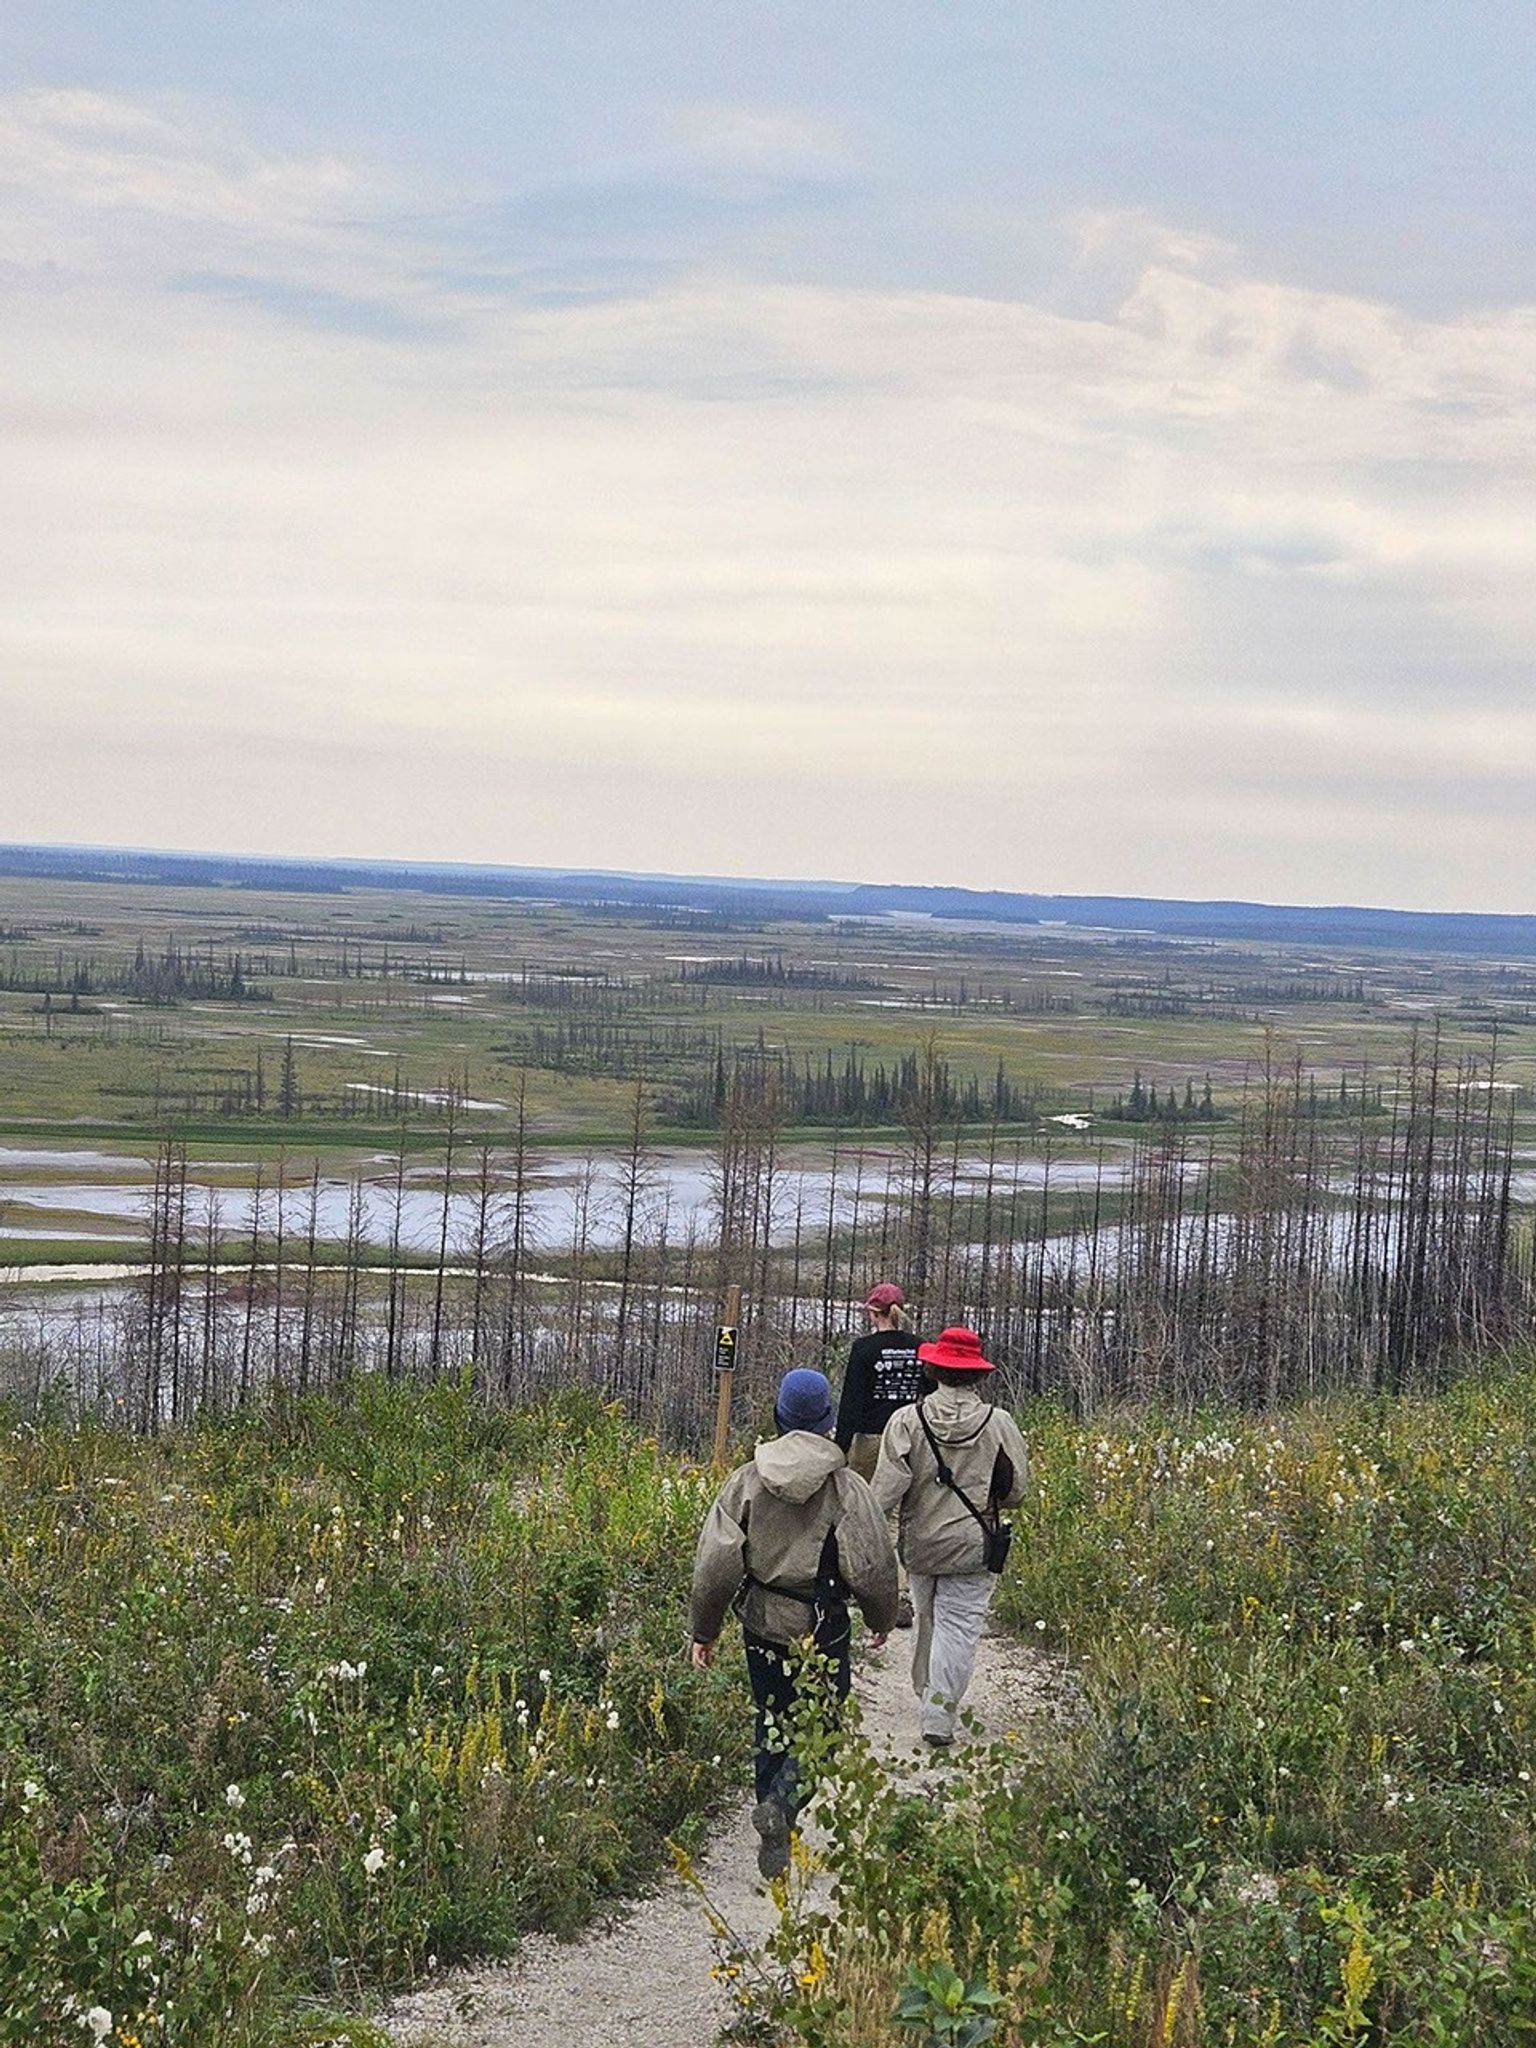
The signage at the pull-off for the salt flat said we should take our shoes off for a foot tactile adventure. Normally this site is wet and squishy, but today it was very dry and crunchy on the feet due to the drought conditions for the past 3 years. So it did not feel very good. It was pointy and sharp on the feet, but that did not stop us! The pull-off for the salt flat had a restroom with running water, and we saw evidence of bears at the structure.
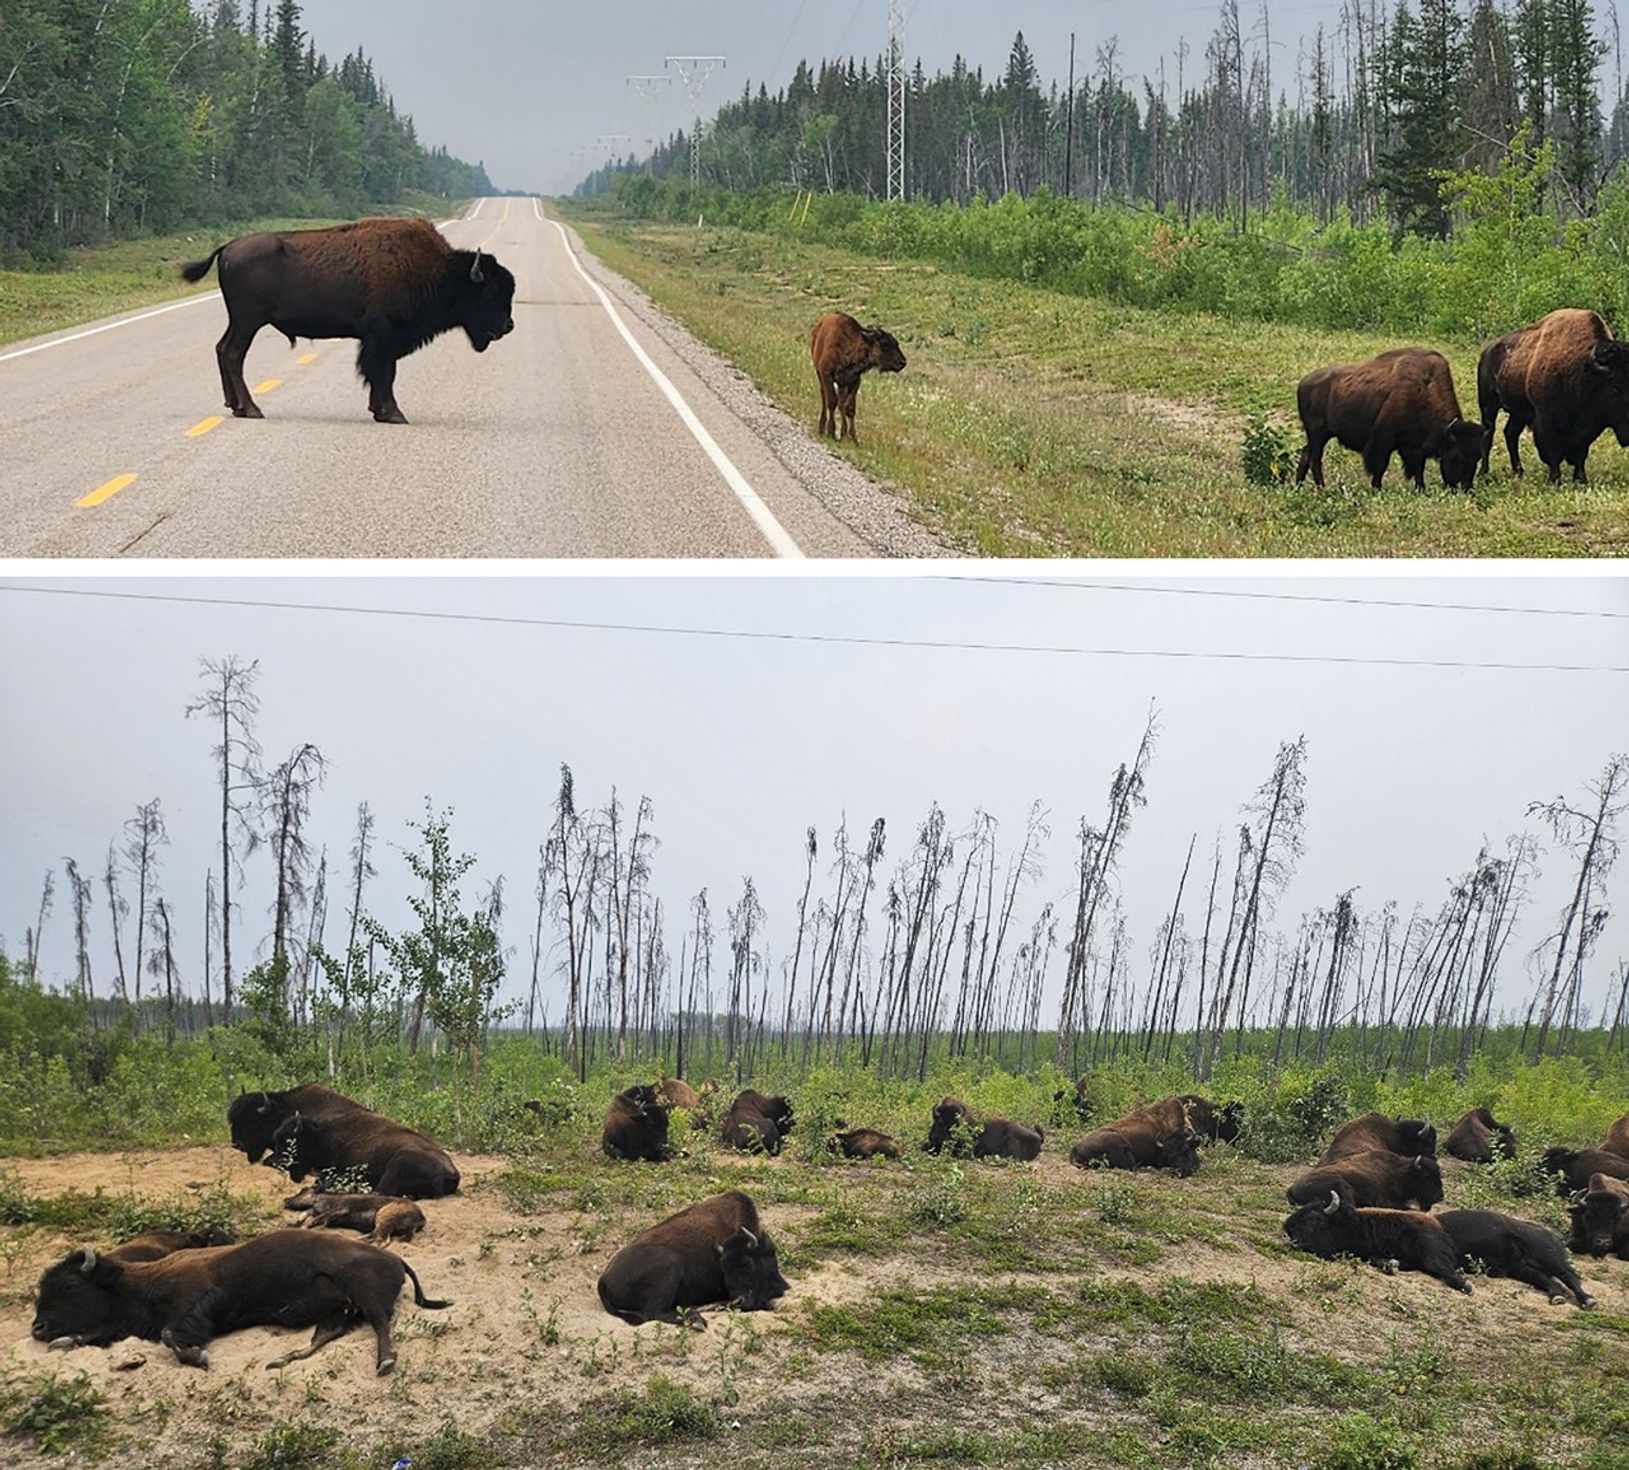
We saw many bison on the road to Hay River. We had learned at the park office that Wood Buffalo National Park has the largest bison herd in the world.
8/4/2025 Hay River to Yellowknife, Day 8
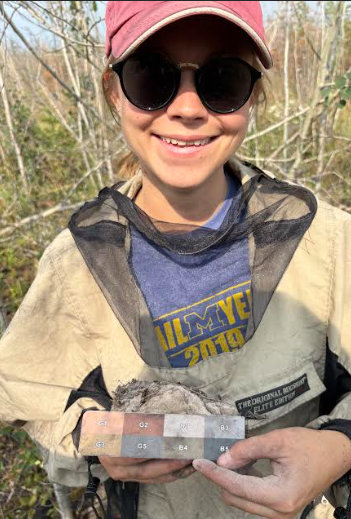
We were mostly out of food, and all the stores were closed because it was a holiday. We had one apple, two oranges, 20 blueberries, peanut butter, carrots, and some deli meat, which had to suffice. We put on our MTU Field Research Team shirts this day, thinking we would stay relatively clean given it was a travel day, and could get good photos for our lab manager. We ate breakfast at the hotel and headed towards Fort Providence. We collected data at four burned peatland sites, two that we had sampled before the fire in 2022, one that had burned in 1996, and one new site that we had never been to before. At each site we sampled in a 1 meter by 1 meter plot in the corner of each 10 meter by 10 meter plot. We recorded what woody vegetation was regrowing.
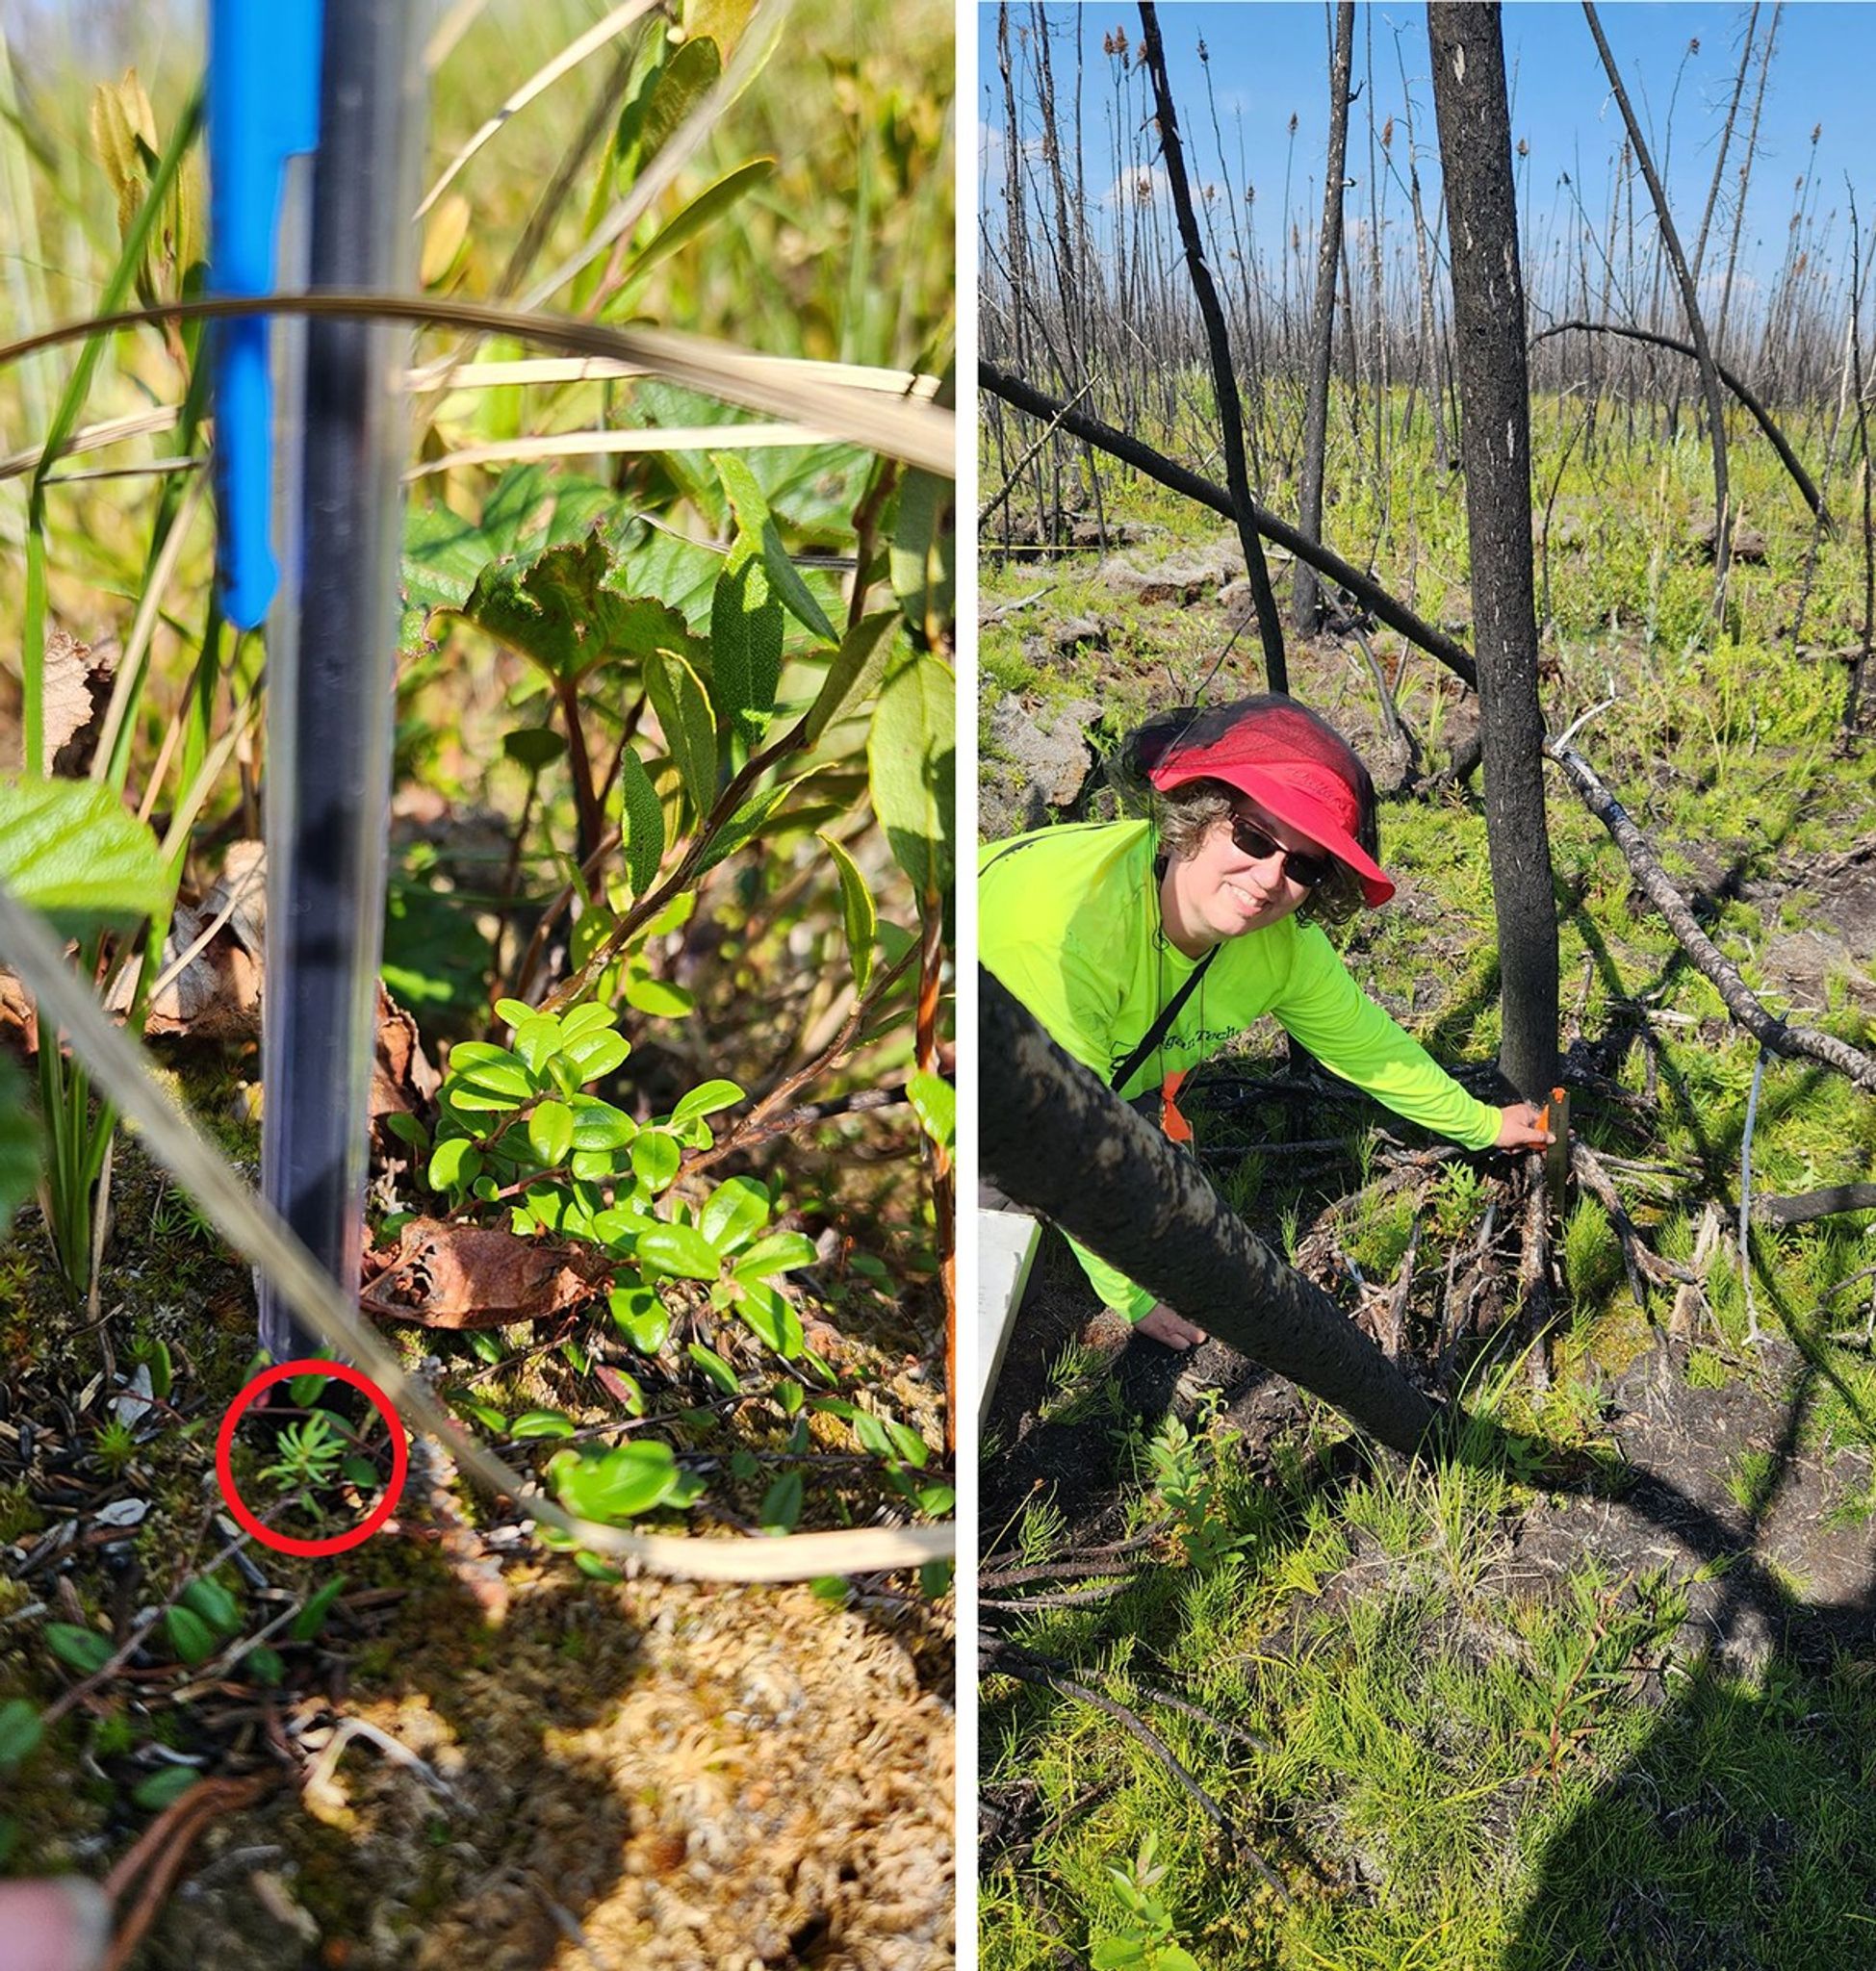
After only two years and continued drought, there were mostly sprouting shrubs. Sometimes we were finding jack pine seedlings, birch, or aspen, but finding black spruce seedlings was difficult as they are tiny. We had to comb through grasses and other herbaceous and shrubby vegetation to find the tiny seedlings (see photo with black spruce at the tip of the pencil). We were very excited when a site had good roots to measure the depth of the burn.
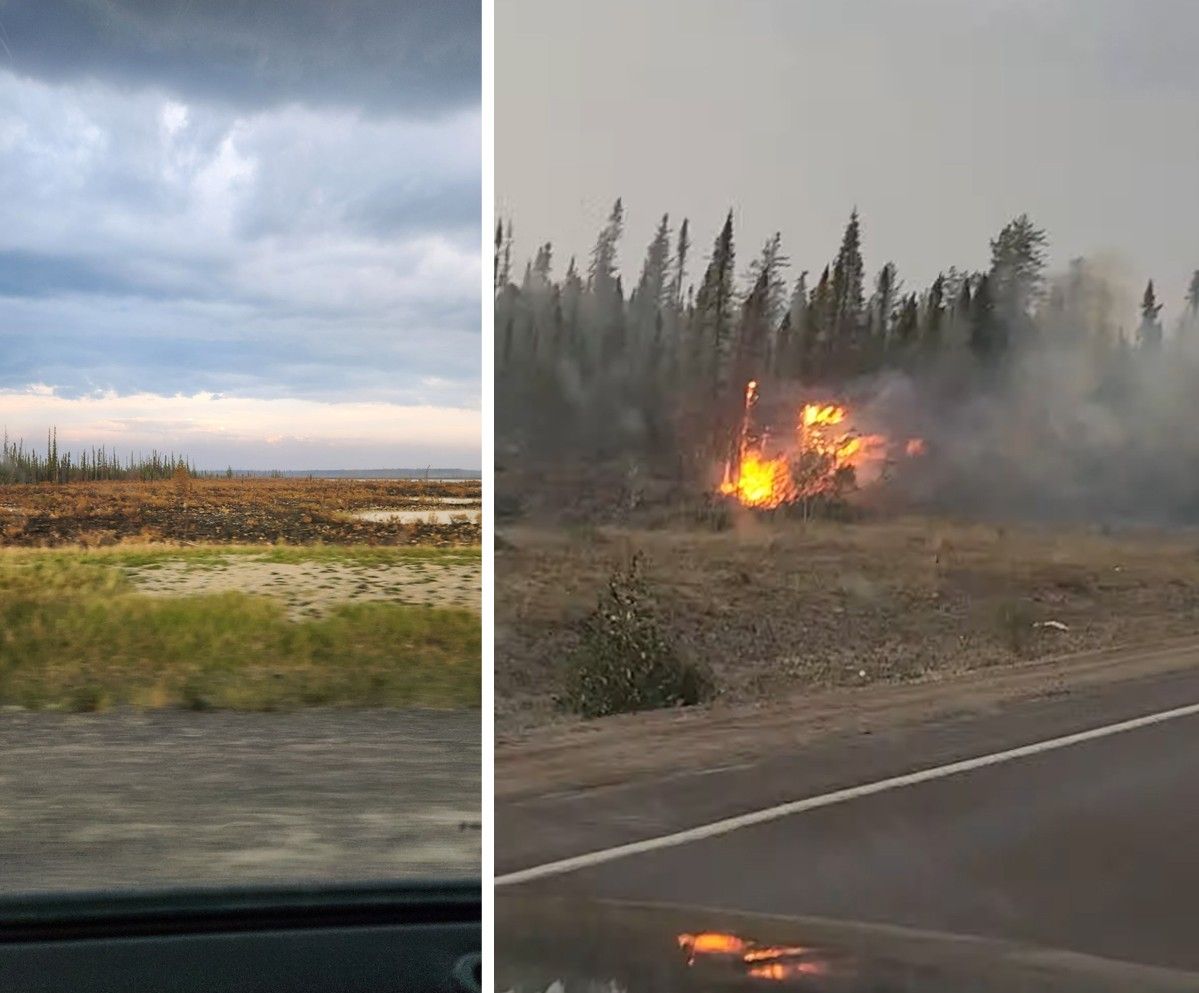
Many of the areas north of Fort Providence that were unburned just a week earlier were now consumed by fire, and we observed torching black spruce along the road edges.
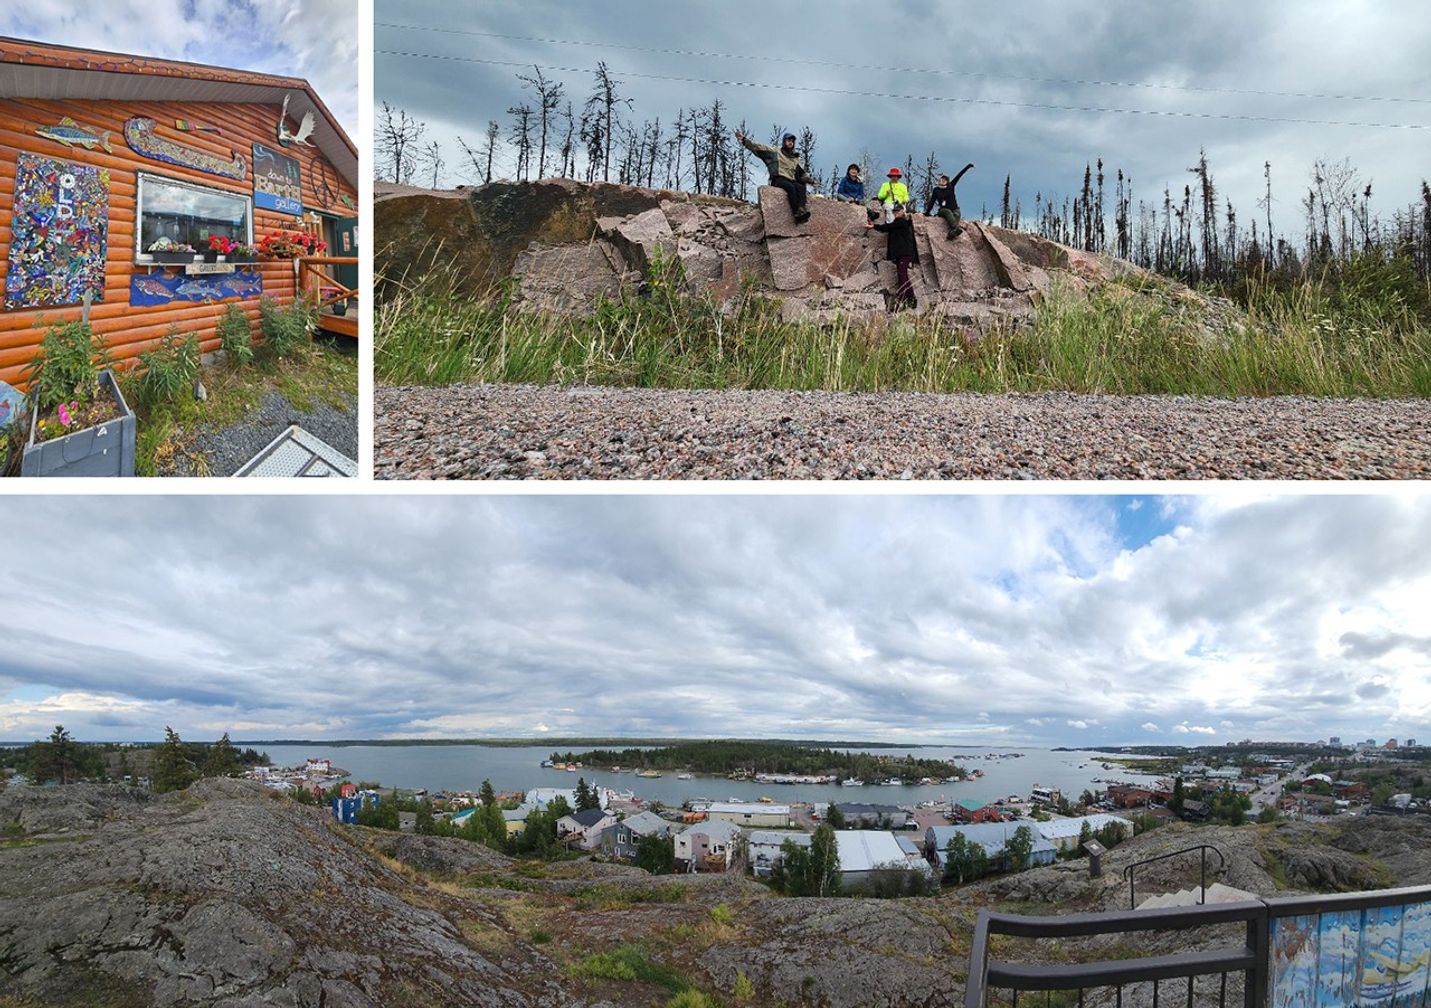
8/5/2025 Yellowknife, Day 9
We spent the morning capturing two more burned sites on the Canadian Shield. Then we had our last field lunch of the trip on a nice rock outcrop. We went back into town to ship our tree cookies back home for processing by counting rings, to age the stands we visited. We had just a short time to shop for souvenirs from Old Town, Yellowknife, and pay a visit to the bush pilot’s monument, with a view of Great Slave Lake and all the houseboats, then a final dinner at the Flamecraft by the water. Early the next day we flew out to Michigan.