


Ice Sheets - Earth Indicator
Key Takeaway:
Ice sheets, which store large amounts of fresh water on land, are melting as Earth’s air and ocean temperatures warm. Antarctica is losing ice mass at an average rate of about 135 billion tons per year, and Greenland is losing about 266 billion tons per year. As ice melts, the resulting water drains into the ocean and contributes to sea level rise.
Antarctica Mass Variation since 2002
135 billion metric tons per year since 2002
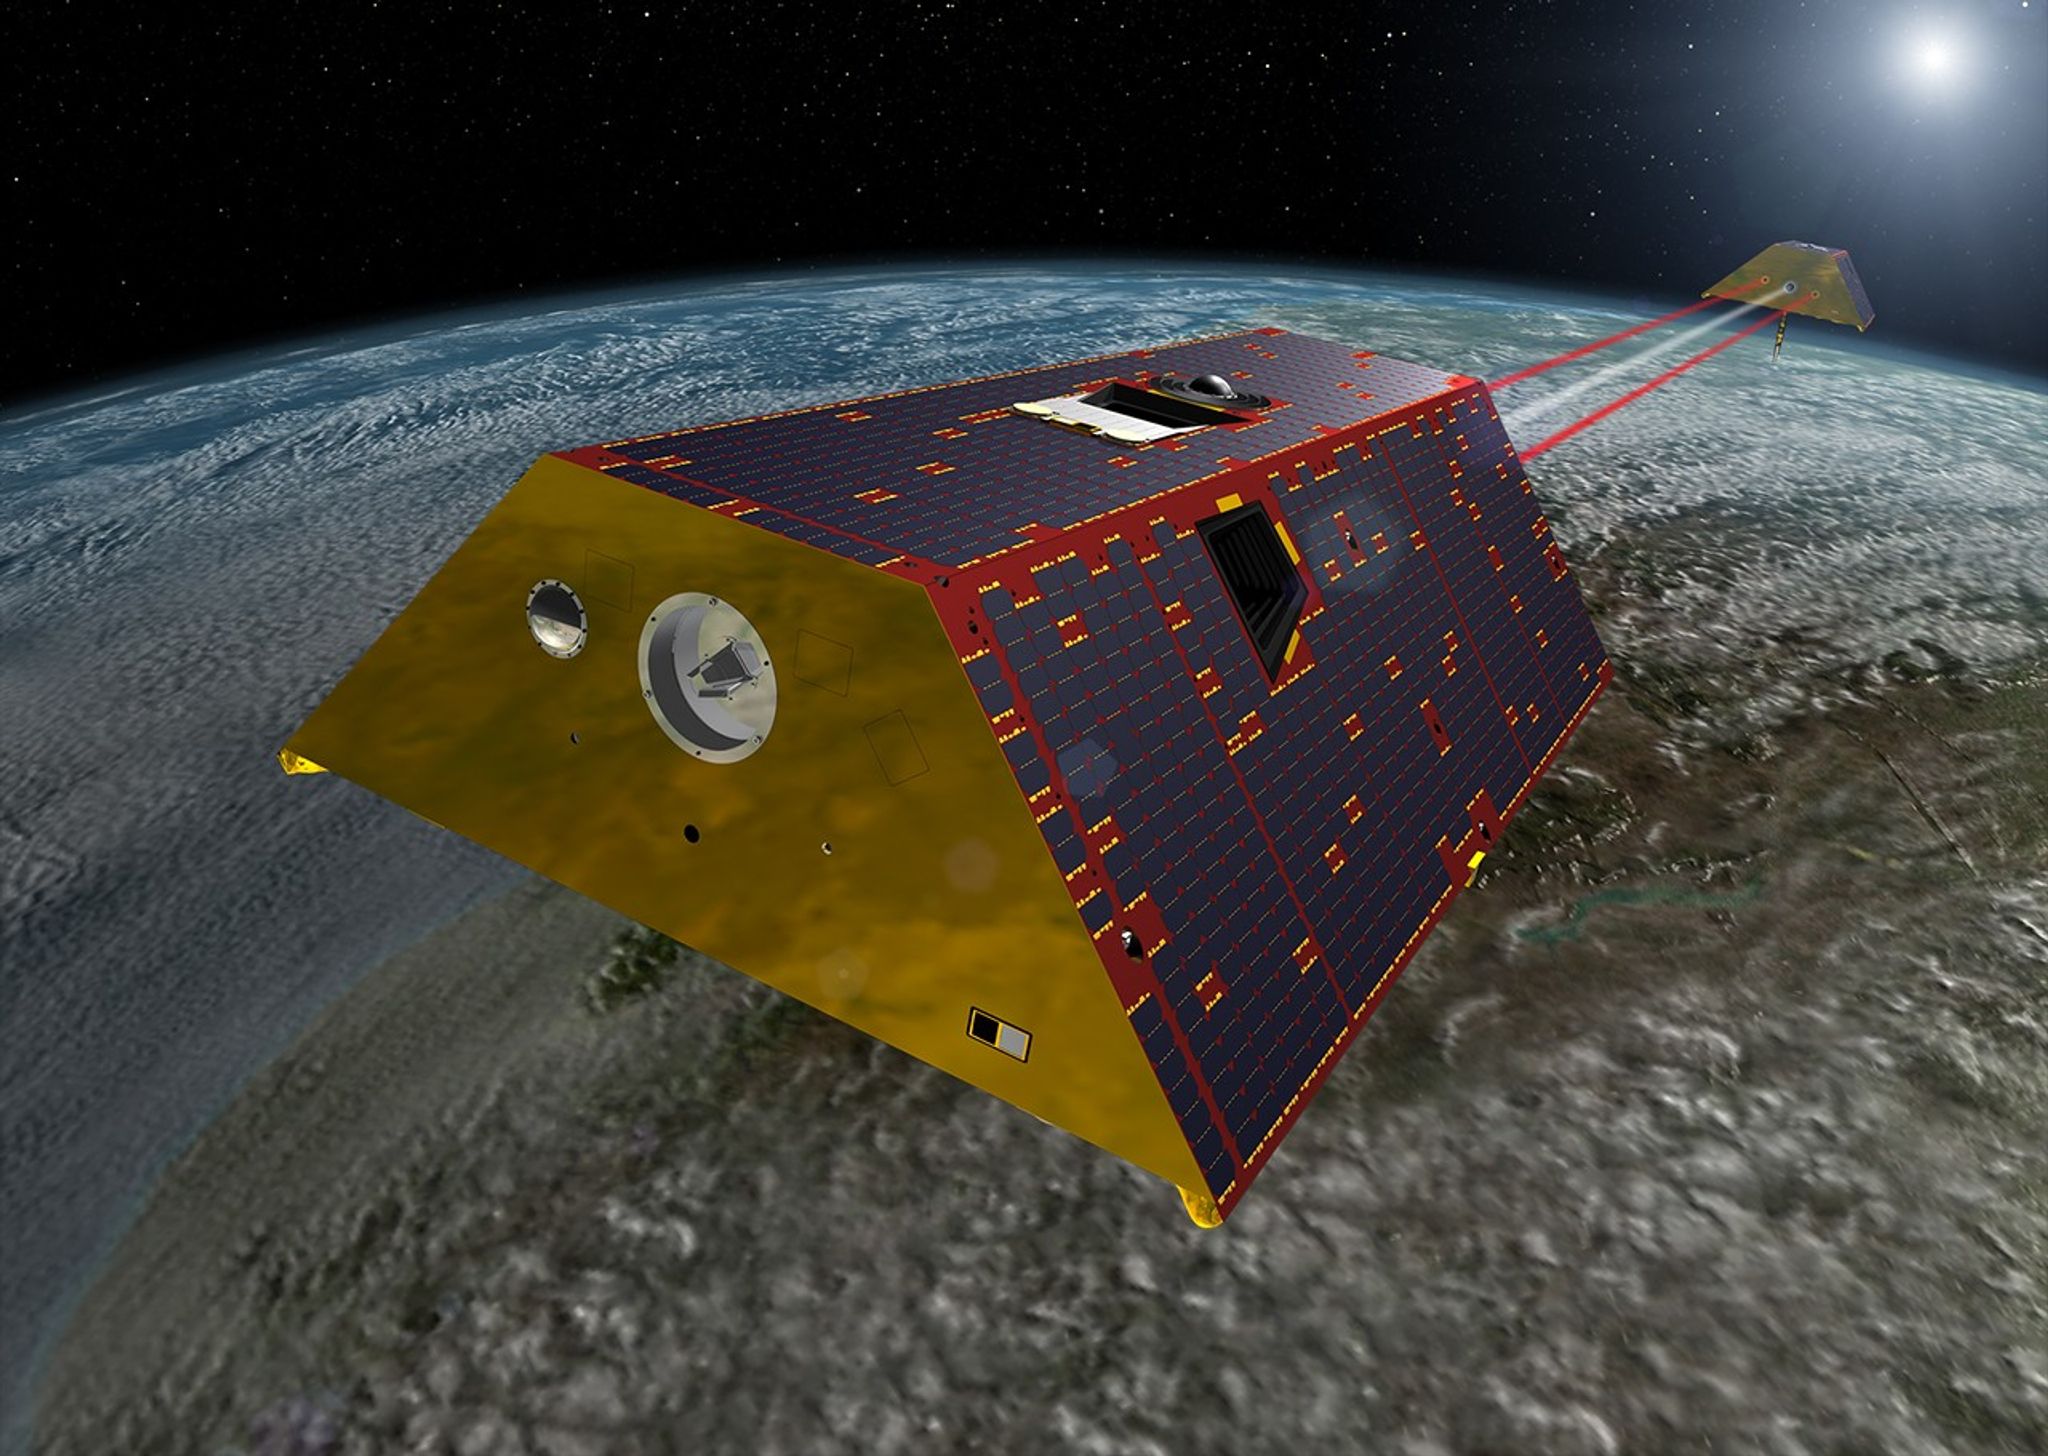
The ice sheets atop Greenland and Antarctica store about two-thirds of all the fresh water on Earth. Data collected since 2002 by the NASA-German GRACE and GRACE Follow-On satellites show that the ice sheets in both Antarctica (upper chart) and Greenland (lower chart) have been losing mass. Antarctica is losing ice mass at an average rate of about 135 billion tons per year, and Greenland is losing about 264 billion tons per year.
The GRACE mission collected data from 2002-2017. After a brief break between missions, measurements resumed with the GRACE Follow-On mission starting in June 2018. This record is continually updated as observations are available.
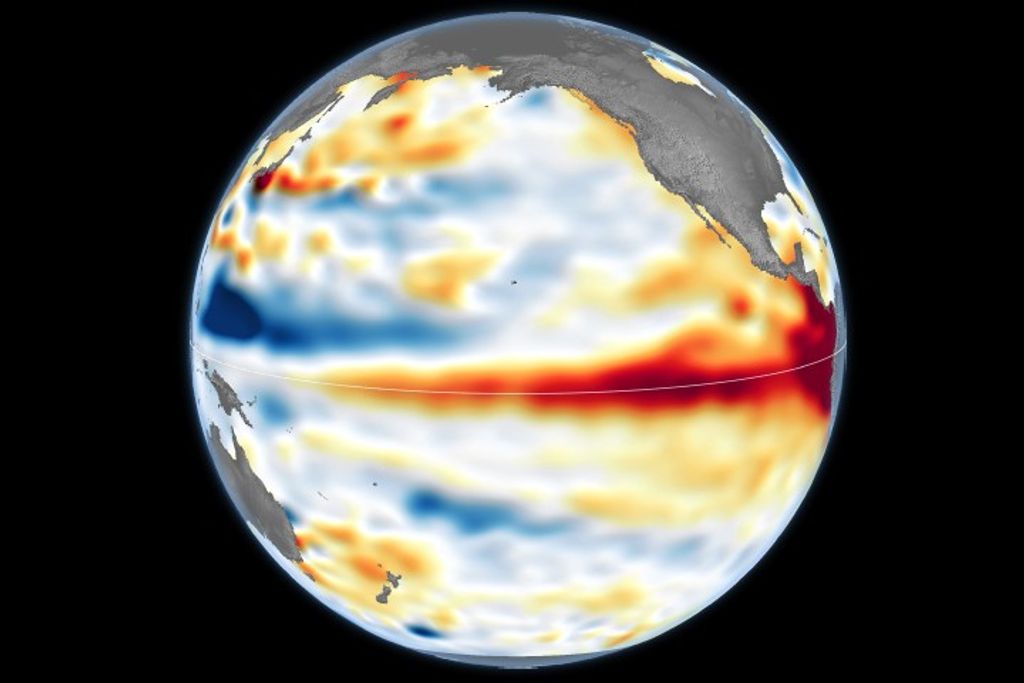
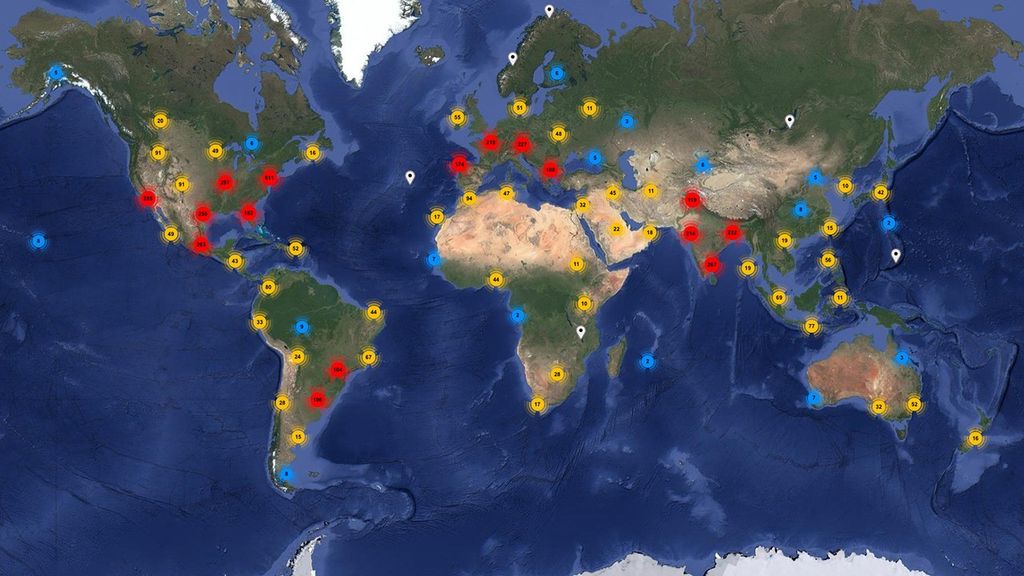
The animated map shows changes in polar land ice mass since 2002. Orange and red shades indicate areas that lost ice mass, while light blue shades indicate areas that gained ice mass. White indicates areas where there has been very little or no change in ice mass since 2002. The average flow lines (grey; created from satellite radar interferometry) of the icesheets converge into the locations of prominent outlet glaciers, and coincide with areas of highest mass loss. This supports other observations that warming ocean waters near polar icesheets play a key role in contemporary ice mass loss.
Note: You will need to create an Earthdata account to access NASA's ice sheet data. Register here for free. Once logged in, click "HTTP" under the charts on this page to access the data.