


Sea Level - Earth Indicator
Key Takeaway:
As Earth warms, melting land ice and warming oceans are causing sea level to rise. Satellite measurements have shown that the global sea level has risen around 3.6 inches (91 millimeters) since 1993.
Latest Measurement
97.9 (± 4.0) mm
Latest Measurement Date
May 2026
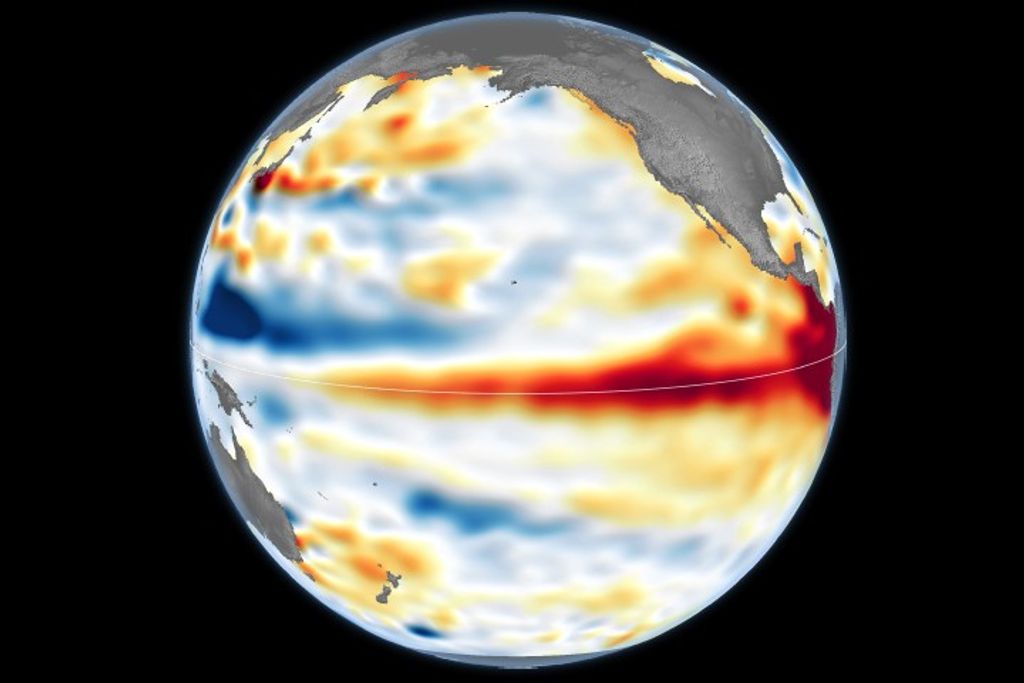
Global sea level rise is caused primarily by two factors: added fresh water from melting ice sheets and glaciers, and the expansion of seawater as it warms. Currently, about two-thirds of global sea level rise is caused by melting land ice and one-third is from ocean warming.
The graph tracks the change in global sea level since 1993, as observed by satellites. This data includes the seasonal cycle of global sea level, visible as a rise and fall each year. This seasonal cycle is caused by the movement of water between the oceans and the land as part of the water cycle.
As the wind blows over the ocean, it picks up moisture and drops it on the land in the form of rain and snow. It takes time for this water to run back off into the oceans, so for a while, the ocean level gets lower. Then as the water makes its way back by way of rivers, the ocean level rises again. Since most of Earth’s land is in the Northern Hemisphere, the pattern in the data follows Northern Hemisphere winter and summer.
On top of the seasonal cycle, though, is the long-term trend which shows an overall rise in global sea level. Satellite measurements have shown that the global sea level has risen around 3.6 inches (91 millimeters) since 1993. More limited measurements made with coastal tide gauges have shown seas rising for at least a hundred years at most locations across the planet.
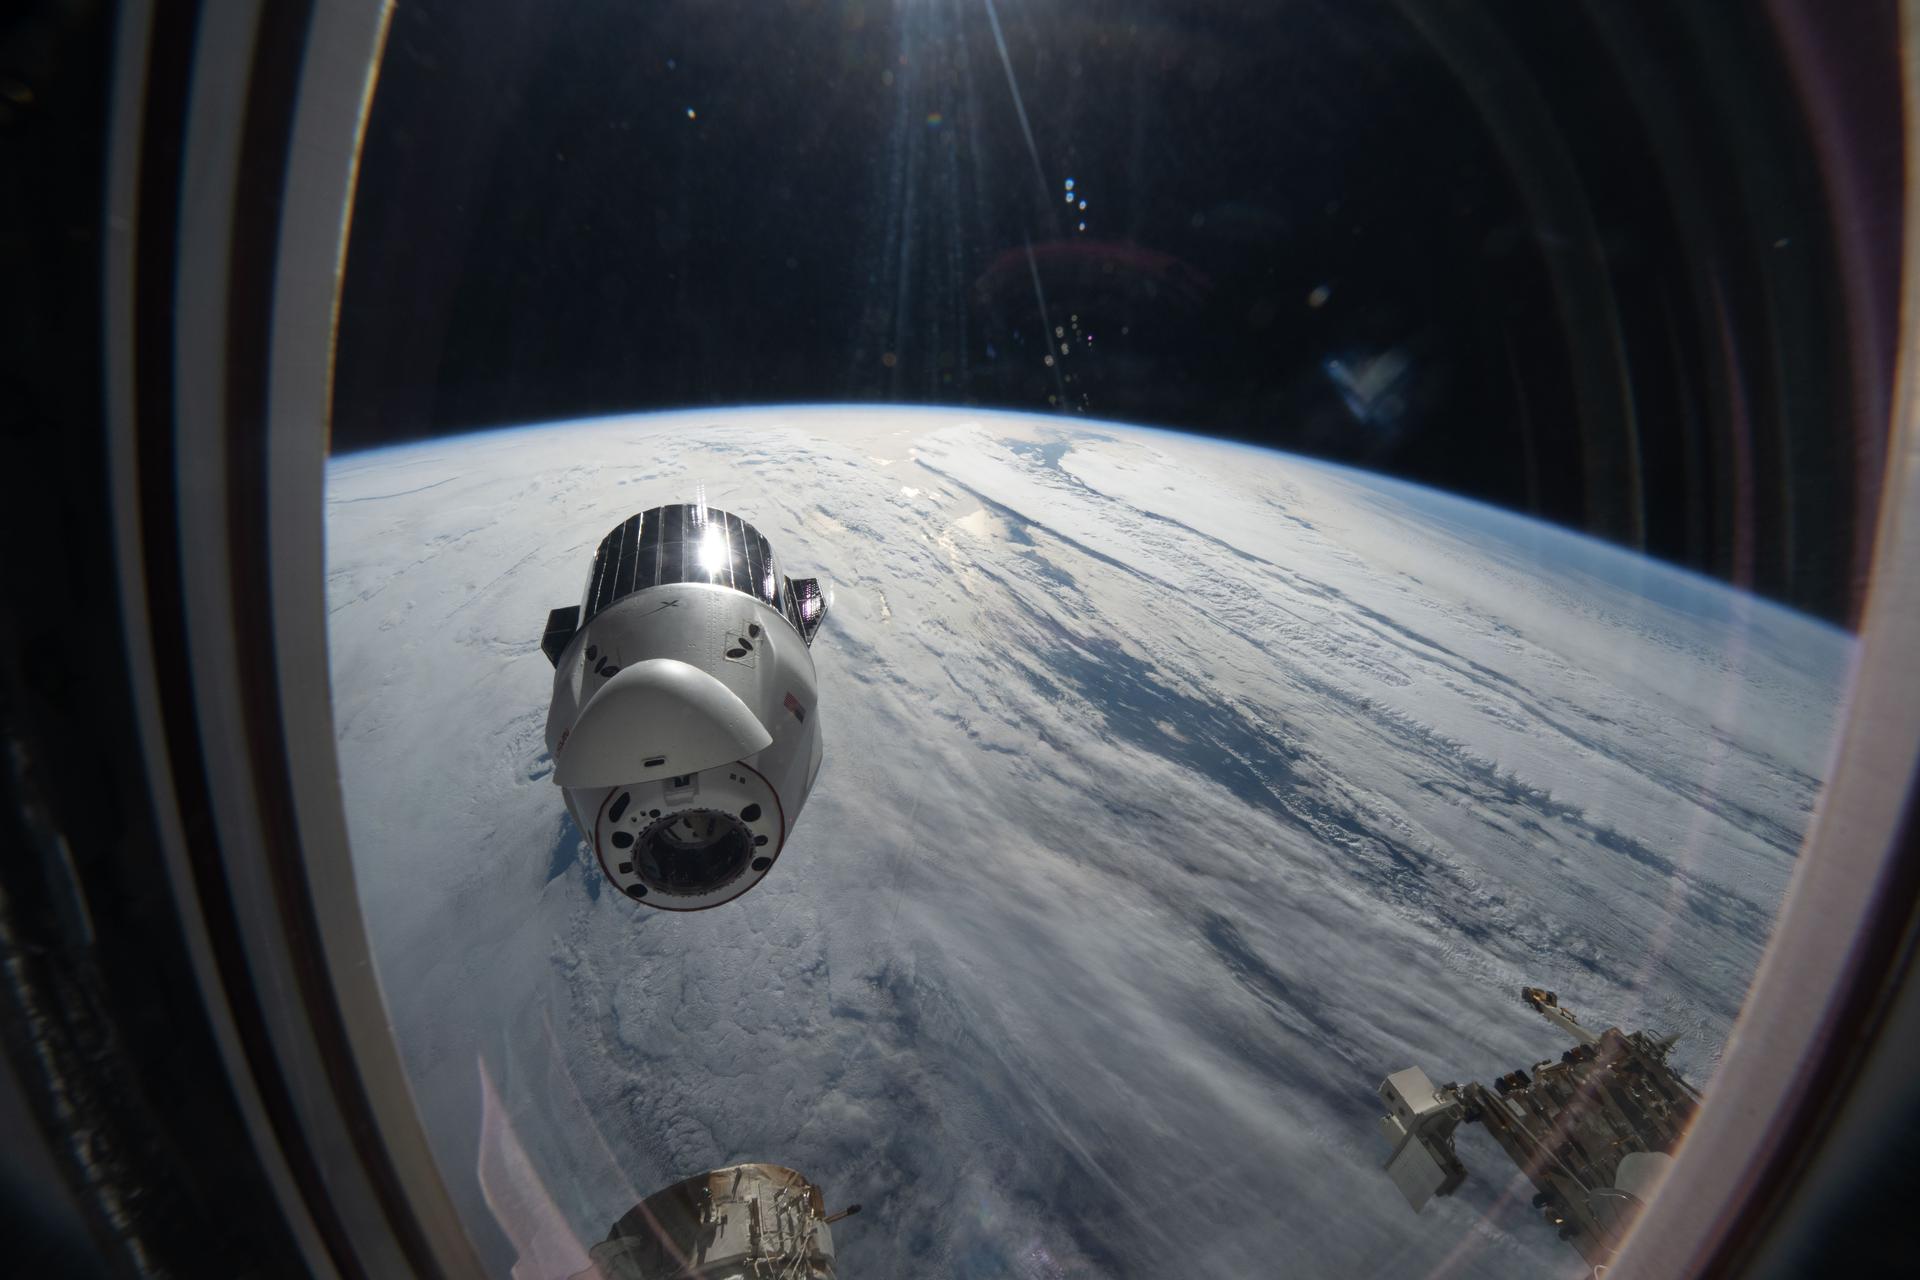
The video shows the global average sea level rise as viewed through a porthole window.
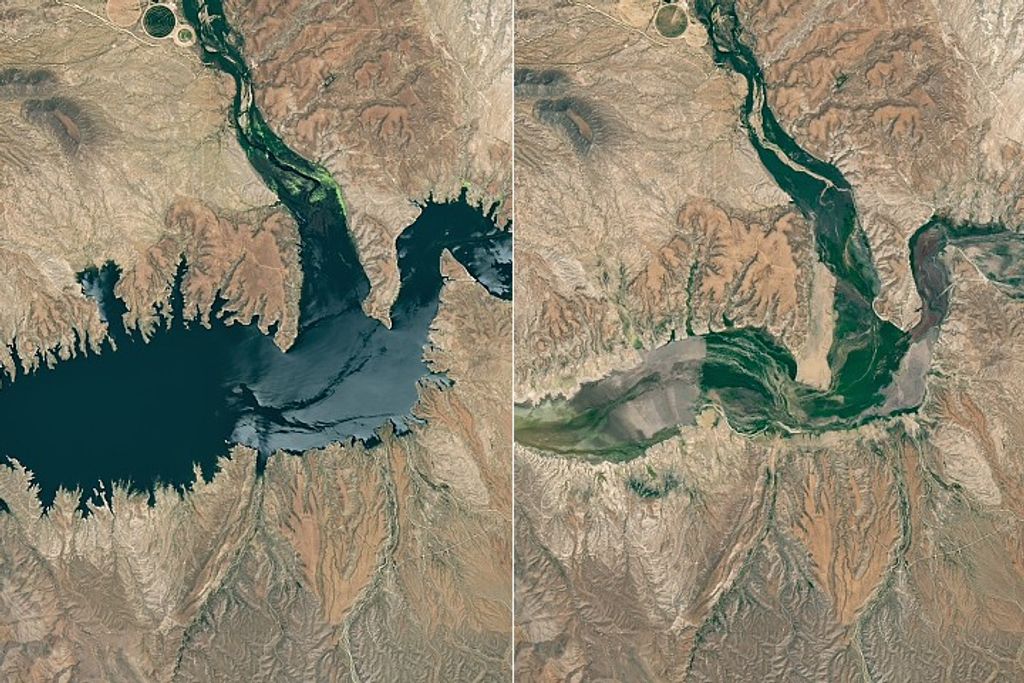
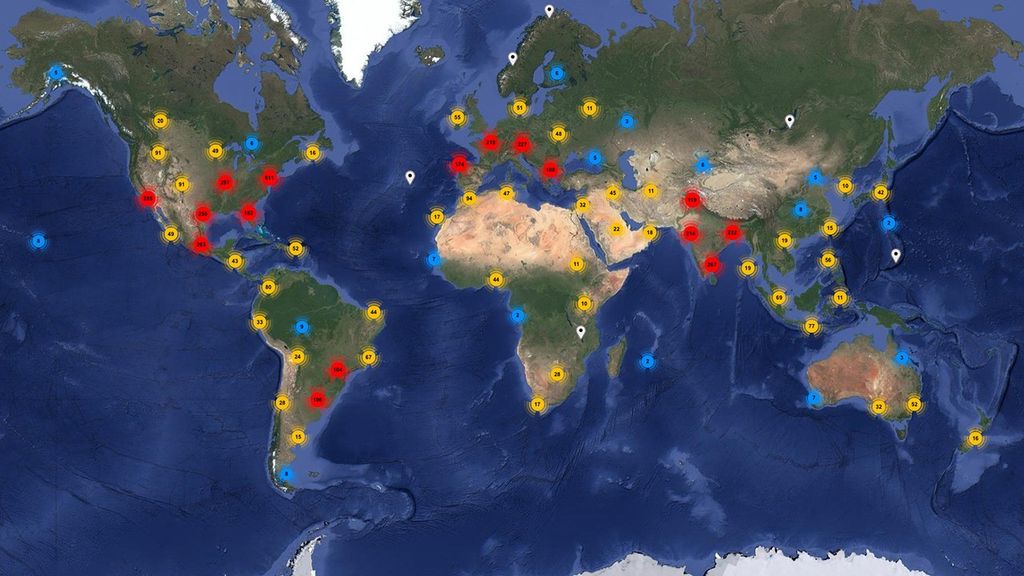
Local sea level change may vary from global changes. In addition to the overall global rise, local sea level change depends on several factors, including the rising and sinking of coastal land and changes in ocean currents. These factors mean that some locations will experience sea level rise that is greater than the global average, whereas others will experience less. Select locations, often closest to melting ice sheets or glaciers, may even experience a sea level that is dropping instead of rising.
Note: You now need to create an Earthdata account to access NASA's ice sheet data. Register here for free. Once logged in, click "HTTP" under the charts on this page to access the data.
Related Missions
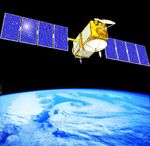
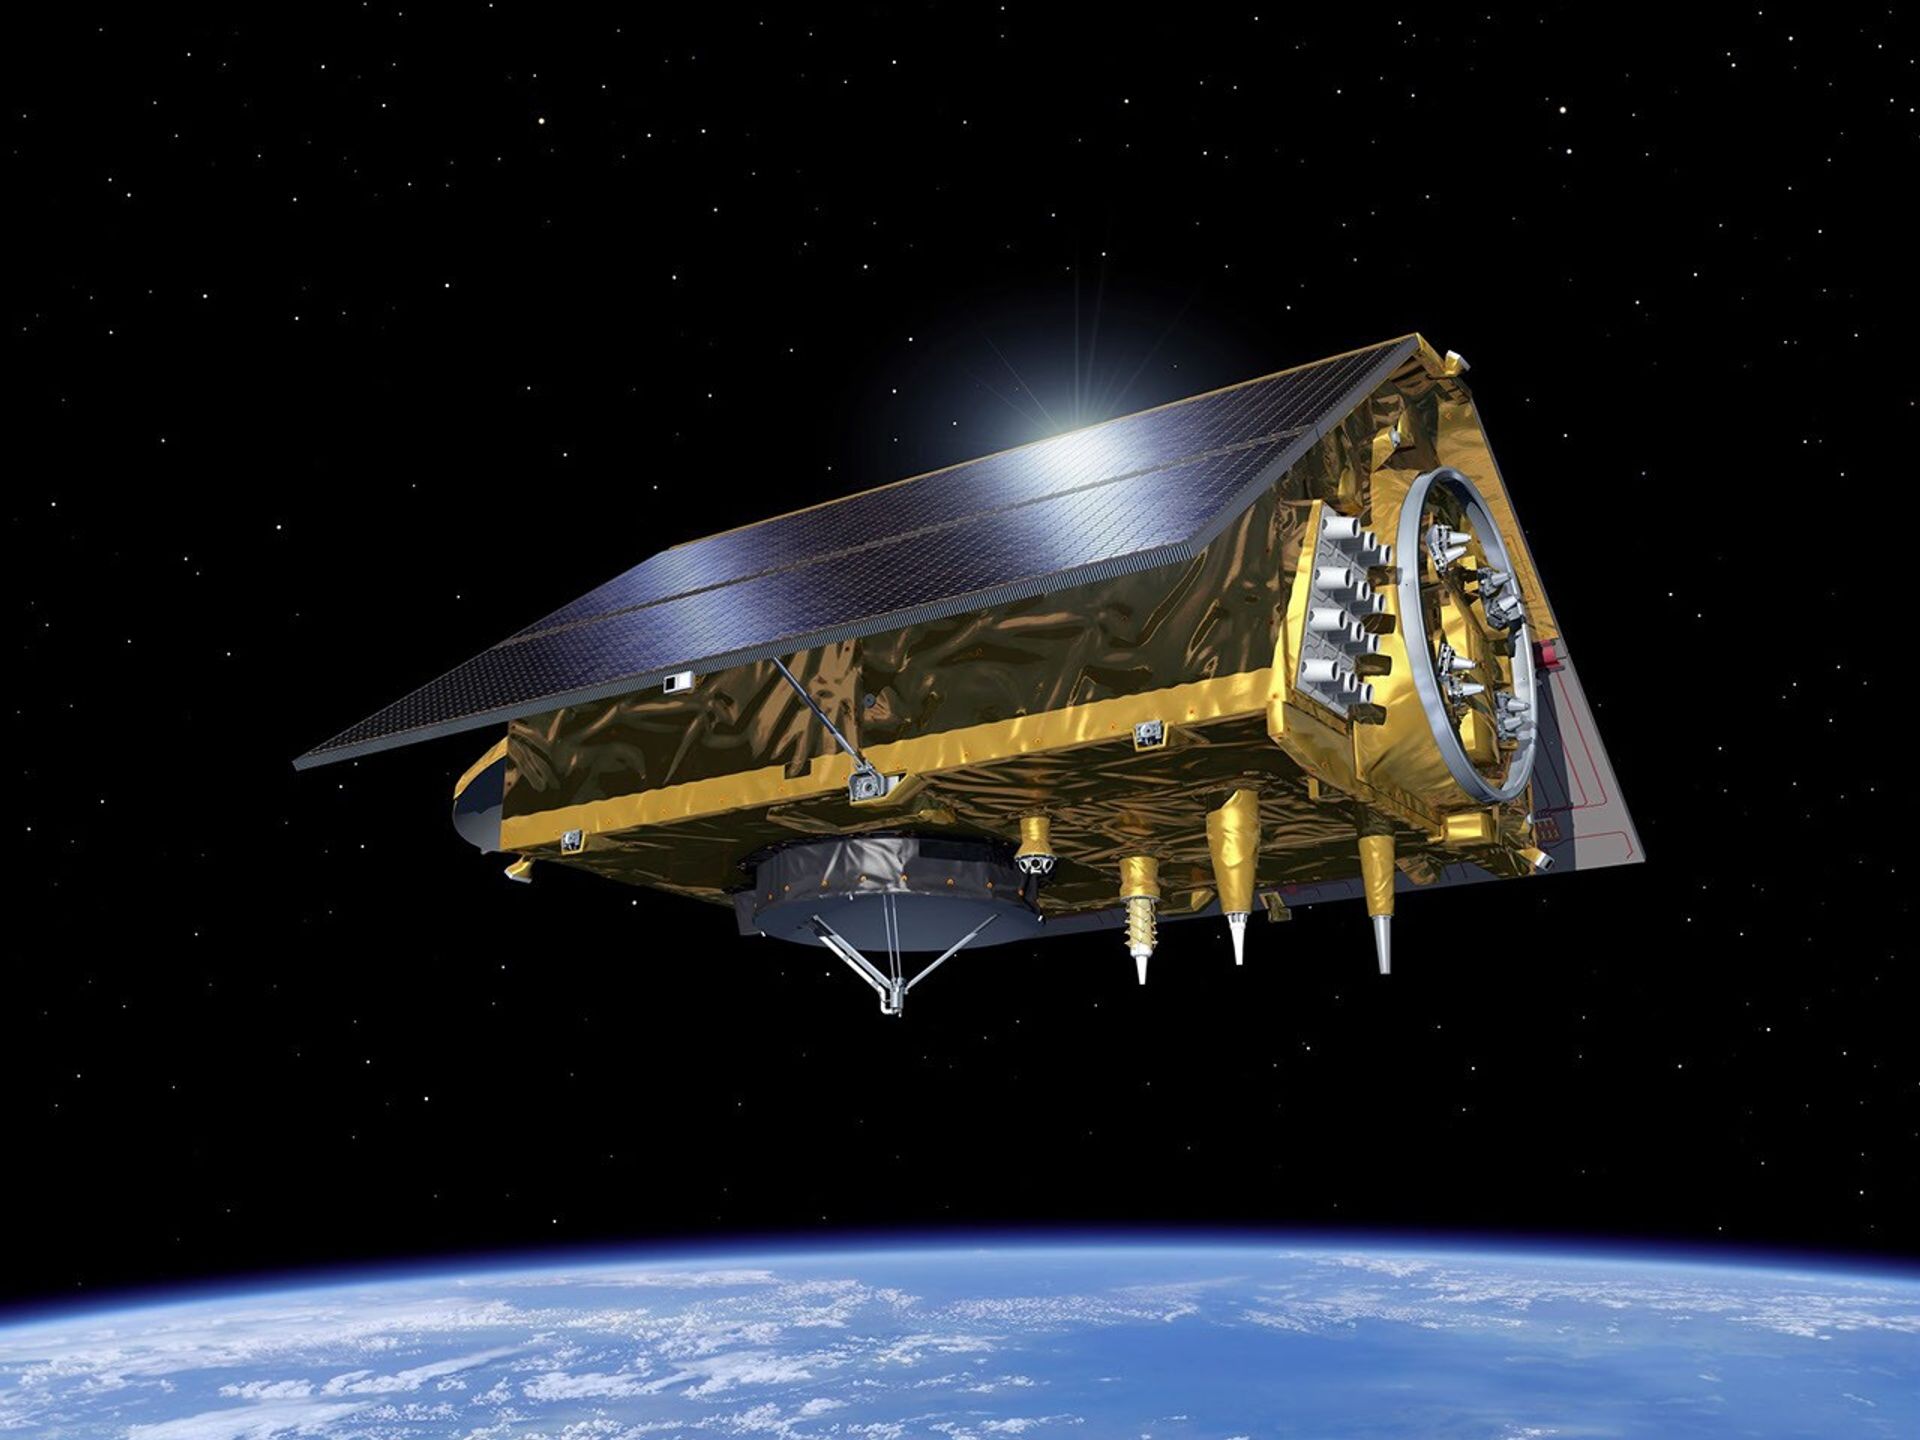
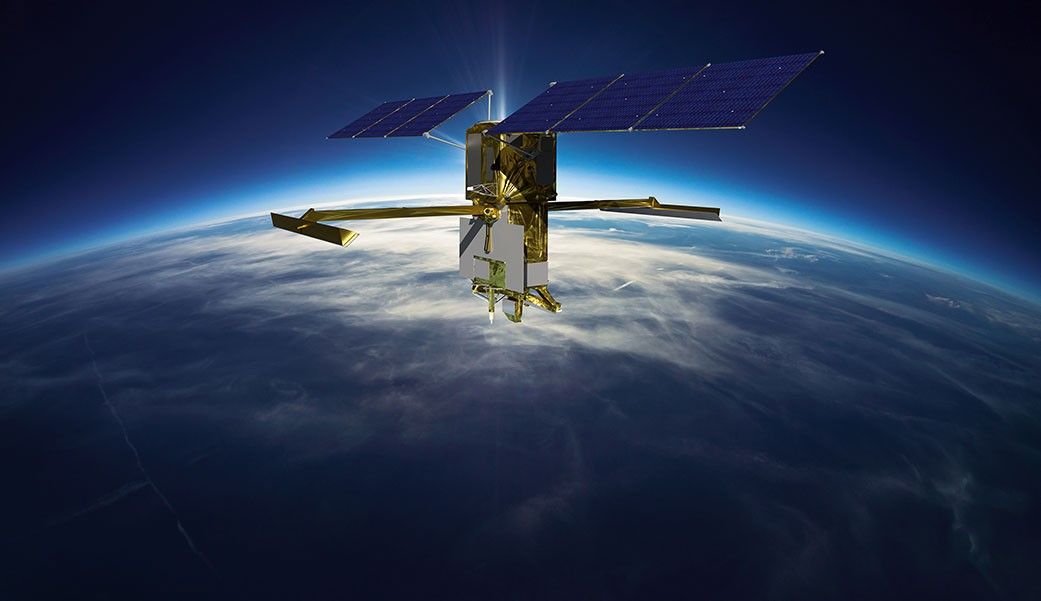
Surface Water and Ocean Topography (SWOT)
U.S. and French oceanographers and hydrologists and international partners have joined forces to develop this satellite mission to make the first global survey of Earth's surface water, observe the fine details of the ocean's surface topography, and measure how water bodies change over time.