Heliophysics Audified: Resonances in Plasma (HARP)

Our Sun ejects a steady stream of charged particles. Some of these particles impact Earth’s magnetic field, which rebounds, flexing and dancing. The HARP project invites you to help study the strumming of this magnetic field and the waves and vibrations that result.
 
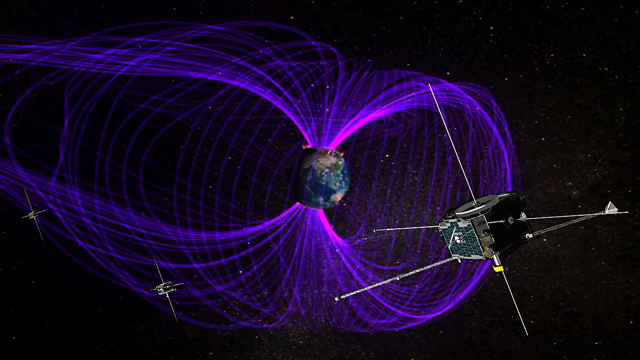
The project examines data from three NASA THEMIS mission satellites orbiting Earth. These satellites, part of the “Time History of Events and Macroscale Interactions during Substorms (THEMIS)” mission, measure motions of the Earth’s magnetic field, which can teach us about the space weather. The HARP project converts these measurements to sound and asks you to help look for patterns amid the noise.

Go to Project Website

ages

18 and up

division

Heliophysics

where

Online

launched

2023

What you'll do

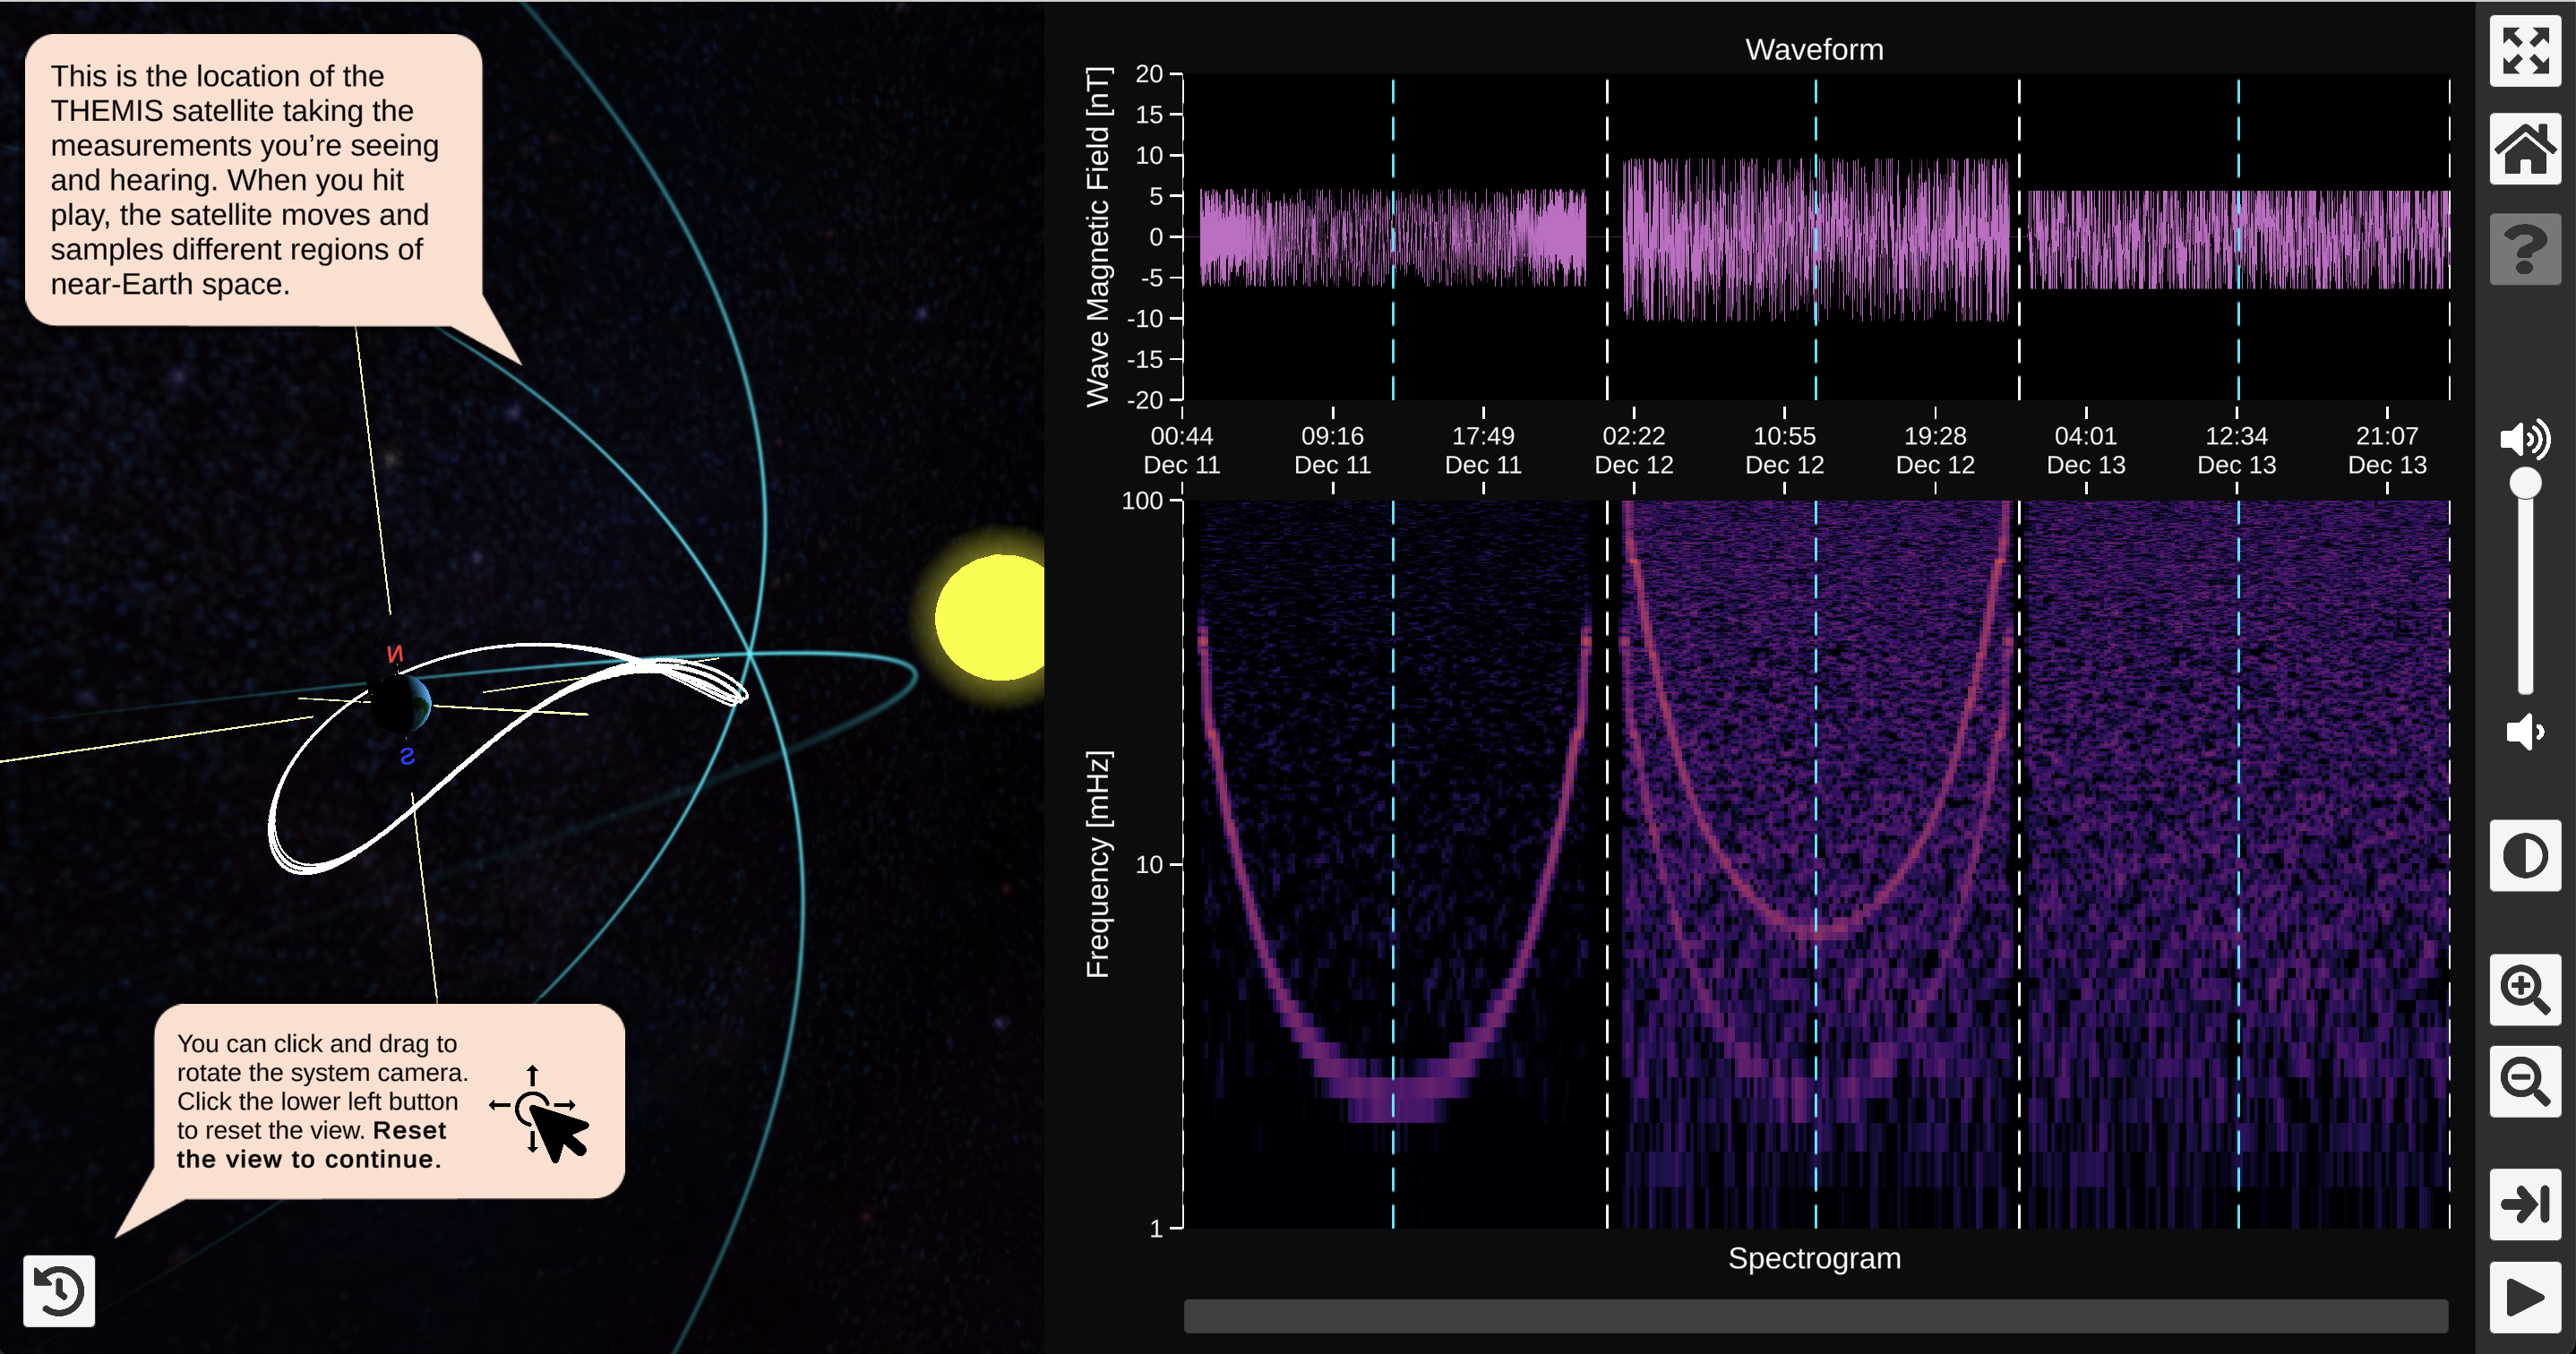
  • View satellite data and listen to sounds of waves in the Earth’s magnetic field.
  • Learn how to recognize patterns within the sounds and data visualizations.
  • Place markers on the data to show where you hear pure tones and mixes of tones. You’ll start with a few practice runs, then move on to new data.

Requirements

  • Time: 5-15 minutes to complete the tutorial
  • Equipment: Web-connected computer
  • Knowledge: None. An online tutorial provides all instruction needed.

Get started!

  1. Visit the project website.  
  2. Click on the grey bar that says “Click here to sign up and get started!” and create a user profile.
  3. Complete the practice module. 
  4. Start your exploration of sounds from space!

Learn More

Visit the project website to learn more about the HARP project and the physics and phenomena we are studying. Want to go even deeper into the science? Check out our About HARP Science page.

The project interface has a divided screen, all on a black field. On the left, we see Earth surrounded by the elliptical path THEMIS spacecraft travel, depicted in bright white. The Sun, which appears as a bright yellow circle, is outside of this path and to the right. On the right hand side of the interface, we see two graphs. The graph on top visualizes the waveform, which appears as a highly jagged purple line that oscillates rapidly between -6 and 6 nT (nanoteslas) through a roughly three-day period of time. Below this graph and sharing the same x-axis of time we see the spectrogram of the sound, which appears to have three distinct parts. The first shows one large “u” shaped line in dark pink. The second shows the same “U” shaped line with a second, pinker U-shaped line above it, with purple splotches of data noise behind. The third shows just the purple splotches of noise.
The main project interface. On the right are controls for playing a sound clip, and a graphical representation of the sound. On the left, a cartoon depicts the location of a THEMIS spacecraft relative to Earth and the Sun as it recorded the sound being played. The text bubbles are part of the tutorial.
Credit: HARP Project website
A THEMIS spacecraft, which look like a big box with solar panels on the left side and long poles extending out from each of its six faces, is in the lower right. Behind it is Earth, recognizable by its pattern of land masses and oceans. Jutting out from each pole are bright purple lines that loop in deformed arcs before rejoining the opposite pole. On the right side of Earth in this view the arcs are nearly circular. To the left, they are extended into oblong loops.A THEMIS spacecraft, which look like a big box with solar panels on the left side and long poles extending out from each of its six faces, is in the lower right. Behind it is Earth, recognizable by its pattern of land masses and oceans. Jutting out from each pole are bright purple lines that loop in deformed arcs before rejoining the opposite pole. On the right side of Earth in this view the arcs are nearly circular. To the left, they are extended into oblong loops.
An artist’s rendition of one of the three THEMIS spacecraft that orbit the Earth measuring the magnetic field. The purple looping lines that connect at the Earth’s poles and extend out to space are an artistic visualization of the Earth’s magnetic field lines.
Credit: NASA
Portrait photo of a smiling man in a black shirt

Mike Hartinger

Physicist, Principal Investigator of HARP

Portrait photo of a smiling man wearing glasses and a burgandy sweater

James Harold

Director, National Center for Interactive Learning

Portrait photo of a smiling woman with long dark hair wearing a turquoise colored shirt.

Anne Holland

Senior Education Associate, National Center for Interactive Learning

Portrait photo of a smiling bald man in a dark shirt.

Robert Alexander

Entrepreneur, Auralab Technologies

Portrait photo of a smiling bearded man.

Martin Archer

Physicist, Imperial College London

Portrait photo of a man with grey hair, a beard and glasses wearing a pink shirt.

Robert M. Candey

Project Scientist, NASA

Portrait photo of a bald man with a slight smile wearing a black and white checkered collared shirt under a black sweater.

Shane Coyle

PhD Candidate, Virginia Tech

Photo of a man wearing glasses wearing an astronaut suit.

Emmanuel Masonsong

Musician, Program Manager, UCLA

Portrait photo of a smiling woman with large glass frames and long hair.

Alexandra "Ale" Pacini

Heliophysics Scientist, NOAA’s National Centers for Environmental Informaton

Selfie photo of a woman wearing glasses, a ball cap and standing outside with the sun behind her.

Xuelng Shi

Engineer,  Virginia Tech

Portrait photo of a man with a slight smile and a shaved head.

Evaldas Vdugiris

Software developer, Space Science Institute

y