


.png?w=1024)


A Year in Review: New Earth Discoveries in 2019
The Earth Science Division’s Research and Analysis Program combines observations from space, airborne and ground-based systems with modeling and data analysis to teach us new things about the Earth every day.
Download: Year in Review - New Earth Discoveries 2019 - PDF
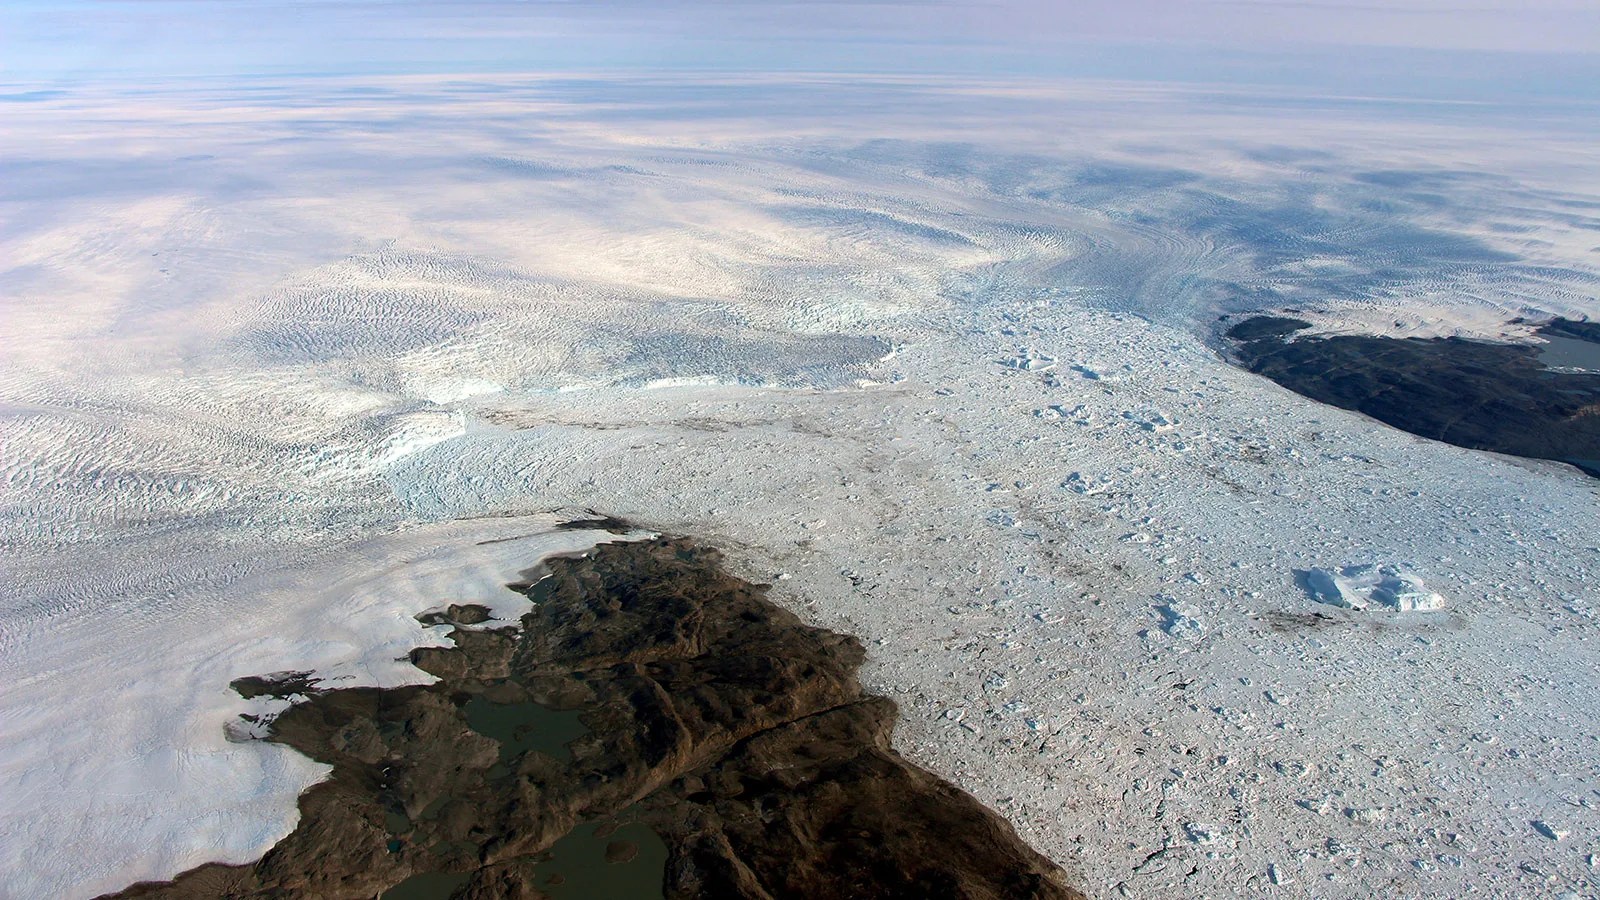
Cold water currently slowing the fastest-thinning Greenland glacier
Altimetry measurements taken during two different NASA campaigns, Operation IceBridge and Oceans Melting Greenland, both show the Jakobshavn Glacier, which has been Greenland’s fastest-flowing and fastest-thinning glacier for the past 20 years, is now flowing more slowly, thickening, and advancing toward the ocean instead of retreating farther inland. Researchers concluded that the slowdown occurred due to cooler ocean currents since 2016. Water temperatures in the vicinity of the glacier are now colder than they have been since the mid-1980s.
Associated Publication: Khazendar, A., Fenty, I.G., Carroll, D. et al. Interruption of two decades of Jakobshavn Isbrae acceleration and thinning as regional ocean cools. Nat. Geosci. 12, 277–283 (2019) doi:10.1038/s41561-019-0329-3
Observed slowdown in CFC-11 decline suggests global emissions have increased
Trichlorofluoromethane (CFC-11) is a potent greenhouse gas, which countries agreed to begin phasing out in 2010. However, recent observations from NASA, NOAA, Korea, and Japan have shown a notable slowdown in the decline of CFC-11 over eastern Asia. Models point to emissions from eastern mainland China, which were more than 3 gigagrams per year higher from 2014 to 2017 than they were from 2008 to 2012. This increase accounts for 40% to 60% of the global rise in CFC-11 emissions.
Associated Publication: Rigby, M., Park, S., Saito, T. et al. Increase in CFC-11 emissions from eastern China based on atmospheric observations. Nature 569, 546–550 (2019) doi:10.1038/s41586-019-1193-4
Taking a volcano’s temperature from space
NASA scientists have developed a first-of-its-kind ASTER Volcanic Thermal Output Database to identify and collect data on volcanic thermal output over large areas. Of the 330 potentially active volcanoes catalogued, 88 were found to have some type of volcanic thermal feature, including 16 that had never before been detected from space. The database will provide new insight into volcanic activity, including a data-driven approach to improving space-based volcanic monitoring.
Associated Publication: Reath et al. The AVTOD (ASTER Volcanic Thermal Output Database) Latin America archive. Journal of Volcanology and Geothermal Research. Vol 376, 62-74 (2019)
Declining spring snow cover in the Northern Hemisphere
Persistent changes to regional snowpack in a changing climate can have disruptive societal and economic impacts, including on water supply, agriculture, and flooding. A new study using NASA data found that the Northern Hemisphere has been experiencing declines in spring snow cover since the mid-1980s, as a response to recent warming. Current limitations within existing satellite systems inhibit our ability to accurately monitor snow cover trends in mountainous regions, making the severity of these trends unclear.
Associated Publication: Bormann, K.J., Brown, R.D., Derksen, C. et al. Estimating snow-cover trends from space. Nature Clim Change 8, 924–928 (2018) doi:10.1038/s41558-018-0318-3
Winter carbon emissions shift permafrost region from a sink to a source
NASA data show the circumpolar boreal-Arctic region is a significant net source of carbon. CO2 emissions from microbial decomposition in the winter are currently outpacing the uptake of CO2 of plants in the summer. The results also indicate that enhanced loss of soil-based CO2 due to future winter warming will increasingly exceed carbon uptake during the growing season. These significant winter emissions are currently not included in Earth system models nor in IPCC assessments, which could have a large impact on global climate predictions.
Associated Publication: Natali, S.M., Watts, J.D., Rogers, B.M. et al. Large loss of CO2 in winter observed across the northern permafrost region. Nature Climate Change. 9, 852–857 (2019) doi:10.1038/s41558-019-0592-8
When zooplankton migrate, they take carbon with them
Zooplankton that live below 200m depth make a daily migration up to the upper layers of the ocean at night, and back down to the mesopelagic zone (200-1000m depth) during the day. The effect of this vertical migration on carbon transport is still largely unquantified. NASA observations during the NAAMES campaign informed new models that show how vertical migration is a significant contributor of carbon export out of upper part of the ocean – about 16% of total global export, and even more in the subtropics.
Associated Publication: Archibald, Siegel, Doney, (Jan 2019), “Modeling Impacts of Zooplankton Diel Vertical Migration on Ocean Biological Carbon Export”, Global Biogeochemical Cycles, doi: 10.1029/2018GB005983
Climate change spells trouble for species that depend on snow cover for warmth
Although typically associated with warming, climate change is predicted to make winters much colder for certain niche species. The subnivium—the interface between snowpack and the ground—is an important seasonal refuge for diverse species when extreme winter temperatures make the surface uninhabitable. New NASA research shows climate change is expected to drastically shorten the subnivium’s duration from 126 days to 110 days in the mid-latitudes. This shortened period will force vulnerable species back out into the harsher surface environment before they’re ready.
Associated Publication: Zhu, L., Ives, A.R., Zhang, C. et al. Climate change causes functionally colder winters for snow cover-dependent organisms. Nat. Clim. Chang. 9, 886–893 (2019) doi:10.1038/s41558-019-0588-4
Ocean surface salinity measurements help improve rainfall predictions on land
The ocean, which makes up 97% of all water on Earth, is the ultimate source of all precipitation on land. A new NASA study explores this connection further, using data from the Soil Moisture Active-Passive (SMAP) satellite to examine the connection between sea surface salinity and rainfall in the southwestern United States. The study found that abnormally salty (more evaporation) or fresh (more precipitation) patches of the ocean can be used to predict rainfall on land one season ahead. Therefore, incorporating salinity data into models can improve forecasts necessary for managing water resources.
Associated Publication: Liu, T., R. W. Schmitt, and L. Li (2018), Global search for autumn-lead sea surface salinity predictors of winter precipitation in Southwestern United States, Geophysical Research Letters, doi:10.1029/2018gl079293
Combining models to find a better “truth” for the atmosphere
NASA’s GEOS Earth system model (ESM) is a forefront model used to simulate many physical, chemical, and biological quantities observed with NASA satellites. Until now, however, GEOS-ESM did not include high-quality atmospheric chemistry data. Collaborative research and development between Harvard University and NASA has extended GEOS to include the GEOS-Chem atmospheric chemistry mechanism, which is continuously updated with developments from its vast user network. This combination greatly enhances GEOS’s ability to precisely characterize Earth’s atmosphere in simulated model runs: a year-long global simulation of 158 tropospheric chemical species using this model was sufficiently realistic to serve as the Nature Run – or truth – for future potential atmospheric composition satellite missions.
Large earthquakes can speed up relative sea level rise
The Samoan Islands, an archipelago home to a quarter million people, experienced sea level rise rates of 2-3mm per year during the last half century. However, following a magnitude-8.1 earthquake in 2009, rates of relative sea level rise increased for the islands. Using GPS and GRACE data, NASA scientists have found that land subsidence intensified following the earthquake as the previously stressed upper mantle relaxed, resulting in relative sea level rise rates 3-6 times faster than previously observed. This study illustrates the need to include solid Earth deformation data into local sea-level rise projections.
Associated Publication: Han, S. C., et al. (2019), Sea level rise in the Samoan Islands escalated by viscoelastic relaxation after the 2009 Samoa‐Tonga earthquake, J. Geophys. Res., 124, 1-15, https://doi.org/10.1029/2018JB017110.
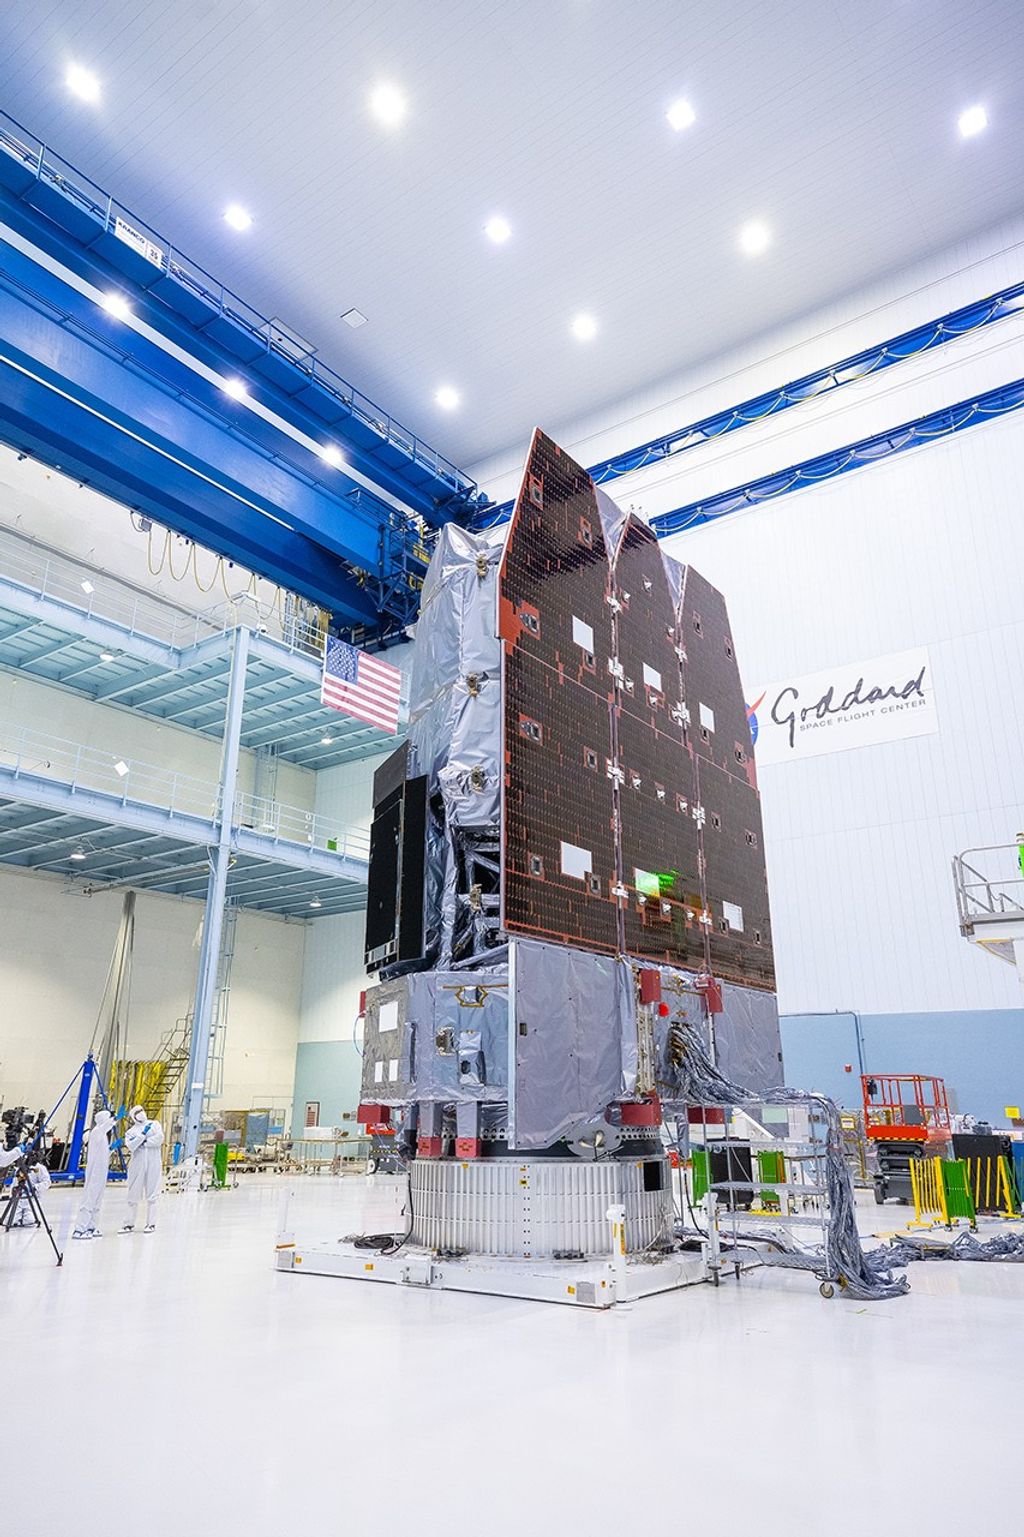
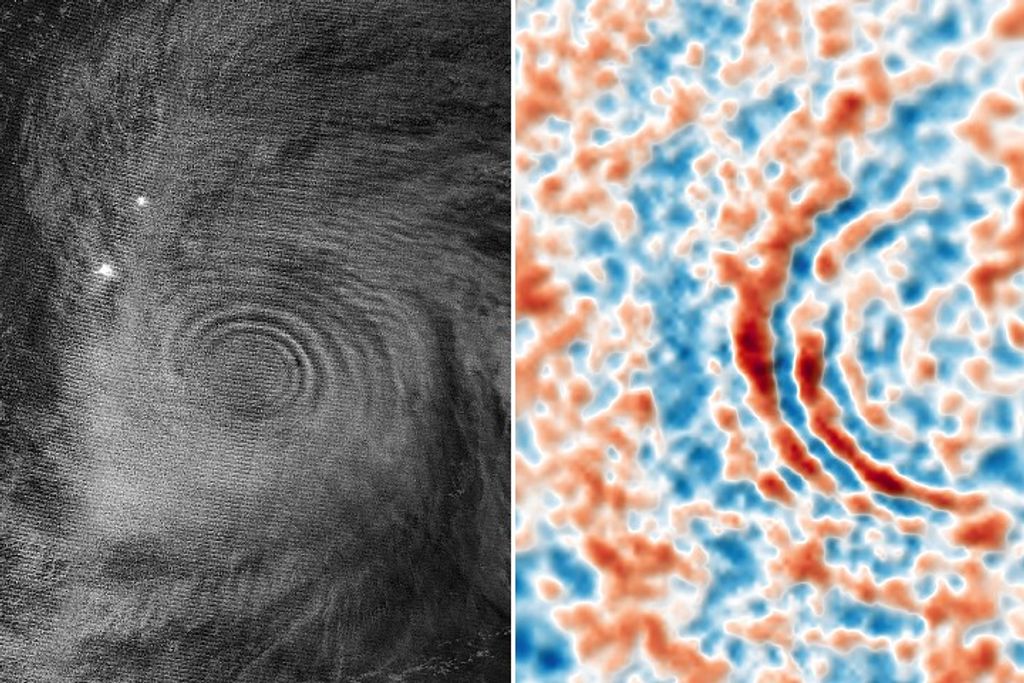
New geostationary satellites bring high frequency MODIS-like capability to rapid response during severe storms
The Geostationary Operational Environmental Satellite Program series R (GOES-R) satellite provides high frequency MODIS-like observations that help meteorologists observe and forecast local weather events, including severe weather. New GOES satellite imagery is helping NASA scientists quickly identify dangerous storms using unique cloud patterns. Results show that severe storm updrafts inject cirrus plumes high into the stratosphere that alert forecasters to dangerous conditions. This method was recently put to the test when NOAA issued a tornado warning in Colorado based on a GOES image when a weather radar malfunctioned, saving lives and property.
Associated Publication: Bedka, K., et al. The Above-Anvil Cirrus Plume: An Important Severe Weather Indicator in Visible and Infrared Satellite Imagery. Weather and Forecasting. 2018.
As cities become richer, their air becomes cleaner
A recent NASA study examined the relationship between economic growth and air quality in the 100 most populated cities. Satellite-based nitrogen dioxide (NO2) data from the Ozone Monitoring Instrument showed that from 2005 to 2011, lower-income cities’ NO2 levels increased, while higher-income cities’ NO2 levels decreased. The disparity is likely due to increased industrialization, urbanization, and energy consumption in lower-income cities, while higher-income cities likely enacted pollution controls.