


A Year in Review: New Earth Discoveries in 2020

Each year, the Earth Science Division’s Research and Analysis Program combines space, airborne, and ground-based observations with data processing from high-tech computer models and algorithms to uncover new things about the Earth. Explore some of our top discoveries of 2020, ranging from the coronavirus pandemic’s effect on the environment to a new understanding of the blue shark’s hunting patterns.
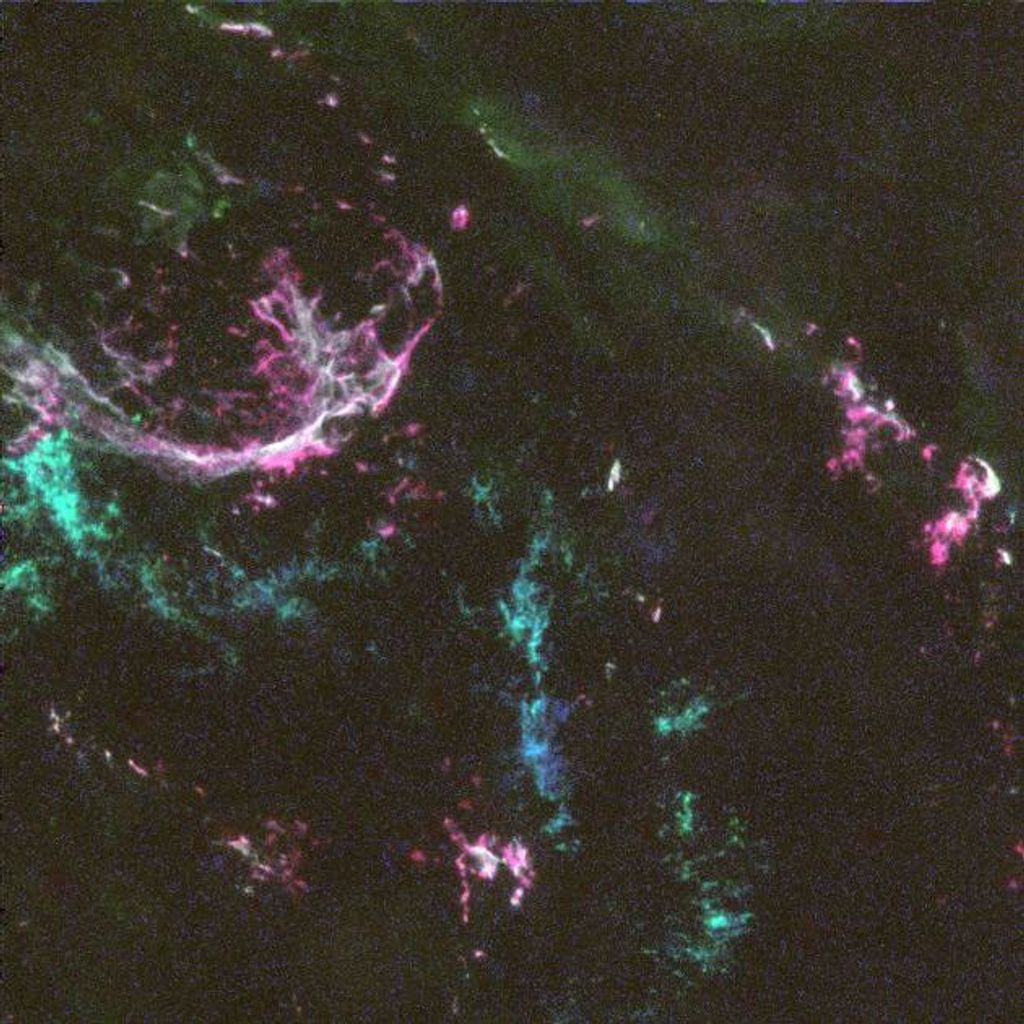
Measuring a large oceanic migration from space
Each night, marine organisms around the world migrate hundreds of meters to the surface to feed, only to return once day breaks. This cycle, known as diel vertical migration (DVM), is thought primarily to be an adaptation to avoid predators near the sunlit surface and is responsible for transporting large amounts of nutrients and carbon throughout the ocean. While ships have observed DVM locally for decades, satellites have struggled to observe DVM on a global scale – until now. Scientists analyzed ten years of data from NASA’s Cloud-Aerosol Lidar with Orthogonal Polarization (CALIOP) sensor to reveal a global picture of DVM for the first time. They found that some areas, such as subtropical gyres, contained significantly more migrators than others and that variations in the number of organisms correlated to surface productivity. These results provide important insight into ocean biological and biogeochemical activities, as well as a path forward for improving our understanding of the ocean as a whole system.
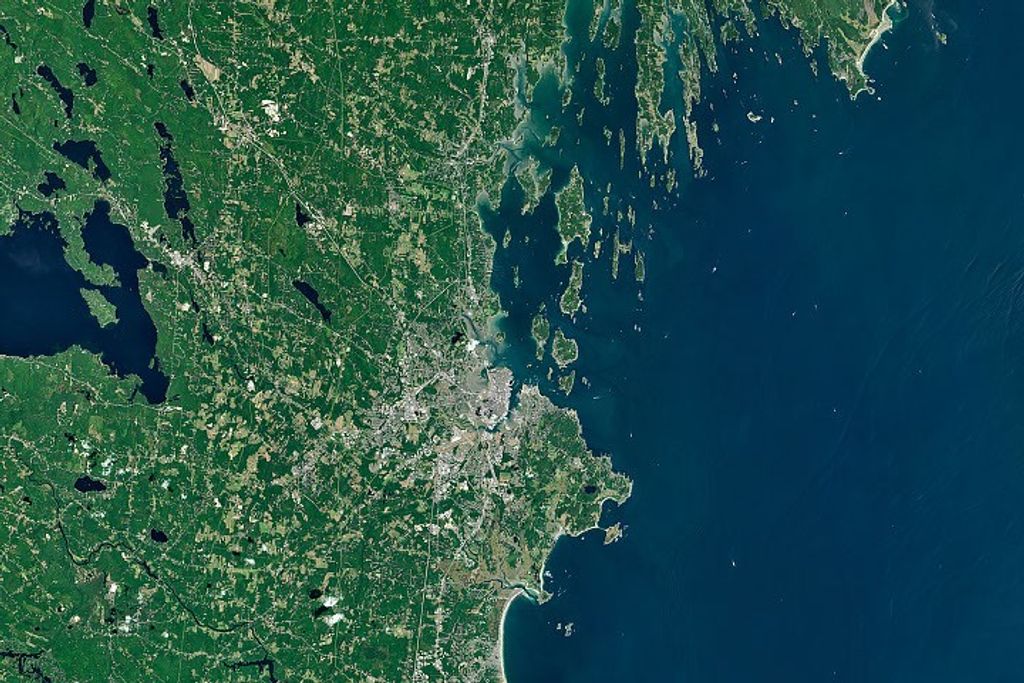
Defining causes of mangrove loss
Mangroves are small trees or shrubs that grow along coastal shorelines. They prevent erosion and serve as an important habitat for many species. Human activities, such as shoreline development, have historically been responsible for global declines in mangrove ecosystems. However, new research has shown that human-driven mangrove loss is beginning to decline. Scientists analyzed more than one million images from NASA’s Landsat satellite from 2000-2016 to capture natural and human-induced sources of global mangrove deforestation. They found that direct human-driven mangrove loss dropped by 73% during the study period, and they created the first ever high-resolution global mangrove loss map. This research demonstrates future mangrove resilience will depend primarily on sea level rise and extreme events, such as hurricanes.
Associated Publication: Goldberg, L., Lagomasino, D., Thomas, N. and Fatoyinbo, T. (2020). Global Declines in Human‐Driven Mangrove Loss. Glob Change Biol. Accepted Author Manuscript. DOI: 10.1111/gcb.15275.
Understanding when hurricanes will strengthen
Hurricane damages account for more than half the cost of all U.S.-based natural disasters combined. Although scientists can predict where hurricanes will strike with good accuracy, they are less successful at predicting when and how they will strengthen. The probability that a hurricane will suddenly increase in strength depends on many factors, including the internal structure of the storm. NASA Earth-observing satellites can peek inside storms to assess storm structure. Scientists combined NASA observations with IBM Watson Studio to develop a novel machine learning model to study hurricane lifecycle. The study showed that inner-core precipitation, ice water content, and outflow temperature correlate well with storm intensification.
Determining the effect of dust on clouds
When it comes to cloud formation, global climate models typically struggle to differentiate between the effects of aerosol interactions and normal meteorology. New research is shedding light on how aerosols like dust affect cloud formation – especially deep convective clouds (DCCs). DCCs are commonly associated with severe weather near the equator and play a large role in Earth’s climate. By combining cloud observations from NASA’s CloudSat satellite with MERRA-2 reanalysis products, scientists were able to isolate dust’s effects on DCC formation. They found the presence of dust led to a 54% increase in DCCs when compared to dust-free conditions. Further, marine, sulfate, and combustion aerosols are associated with even more prevalent DCCs. A better understanding of DCC formation will help improve global climate projections.
Characterizing how landslides move
Landslides destroy property and contribute to loss of life. Understanding how landslides respond to ongoing climate shifts, such as increased precipitation, is essential for predicting when they will occur. Although commonly associated with fast-moving, catastrophic events, most landslides are relatively slow. Scientists studied the Slumgullion landslide in Colorado – a large, slow-moving landslide – from 2011-2018 to better characterize landslide behavior. Combined measurements from airborne uninhabited aerial vehicle synthetic aperture radar (UAVSAR) and ground-based instruments confirmed mobility rates at the edges of landslides and how fluid from snowmelt and rainwater can trigger movement. These results shed new light on landslide boundaries and subsurface flow. This research will help communities better prepare for landslide events.
Ranking mountains’ ability to store water
Mountains are the water towers of the world, storing and supplying a significant portion of water to meet natural and societal needs. However, how much water they store and how vulnerable they are to climate change is still unknown – especially on a global scale. Scientists leveraged NASA data and models to develop a new global system to help rank mountains based on their storage capacity and dependent groups, such as communities and ecosystems. Using this Water Tower Index (WTI), scientists found the highest ranked WTI mountains were also the most vulnerable to climatic or socioeconomic shifts.
Associated Publication: Immerzeel, W.W., Lutz, A.F., Andrade, M. et al. (2020). Importance and Vulnerability of the World’s Water Towers. Nature, 577, 364–369. DOI: 10.1038/s41586-019-1822-y.
Constraining Earth’s climate sensitivity
NASA scientists have more closely constrained Earth’s “climate sensitivity,” or the amount of global temperature rise associated with a doubling of pre-industrial atmospheric carbon dioxide (CO2). Previous studies identified the range to be between 1.5°C and 4.5°C. NASA participated in research that re-examined these findings, along with new lines of evidence and advanced computer modeling, to determine with more confidence that Earth’s climate sensitivity is closer to the middle or upper part of this range. This means society is unlikely to avoid substantial climate change (more than 2°C) under a high-emission future, and global temperatures could rise by as much as 4.5°C by about 2060.
Associated Publication: Sherwood, S. C., et al. (2020). An Assessment of Earth's Climate Sensitivity Using Multiple Lines of Evidence. Reviews of Geophysics, vol. 58, no. 4. DOI: 10.1029/2019rg000678.
Observing COVID-19 impacts on air pollution
During the initial onset of COVID-related shutdowns, satellites observed significant declines in global concentrations of nitrogen dioxide (NO2), an air pollutant associated with economic activity and fossil fuel combustion lower in the atmosphere. NASA scientists evaluated the reduction in satellite measurements of NO2 over China before and after the 2020 Lunar New Year, when NO2 levels are typically low. Scientists found that observed reductions in 2020 were more then 20% greater than typical holiday-related reductions. This research reinforces how human activity influences the environment.
Associated Publication: F. Liu et al, (2020) Abrupt Decline in Tropospheric Nitrogen Dioxide over China after the Outbreak of COVID-19. Sci. Adv. DOI: 10.1126/sciadv.abc2992.
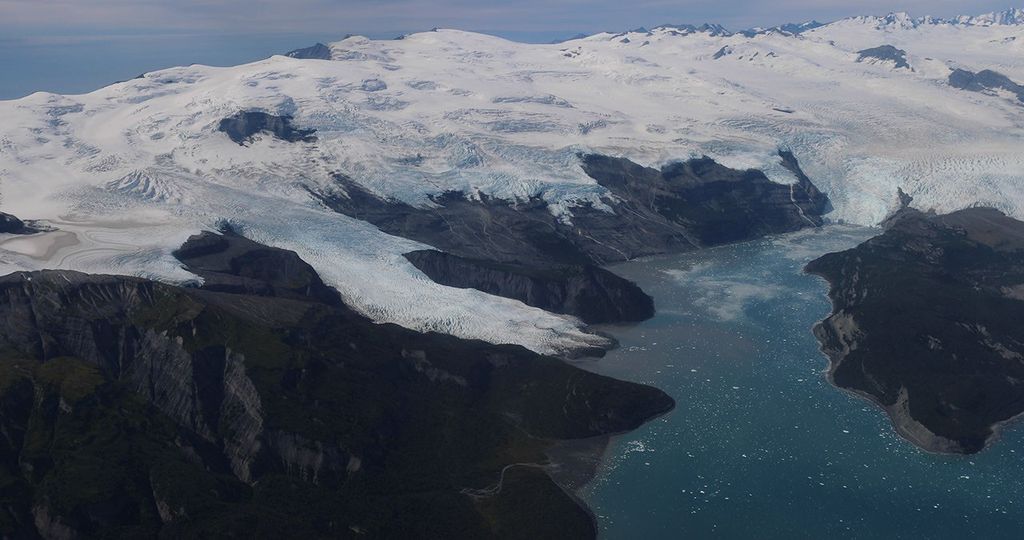
Examining the causes of ice sheet melt
Melting ice sheets account for almost a third of current global sea level rise. As climate continues to change, NASA scientists are trying to better understand which processes – atmospheric or oceanic – contribute most to ice sheet melt. Surface height measurements from NASA’s ICESat (2003-2009) and ICESat-2 (2018-current) satellites revealed that enhanced ice melt driven by atmospheric and oceanic warming in Greenland and by oceanic warming in Antarctica contributed nearly 1 millimeter per year to sea level rise from 2003-2019. Greenland, where both oceanic and atmospheric processes worked together to thin the ice sheet, contributed nearly double the amount of sea level rise as Antarctica, where slow but widespread thickening due to atmospheric processes partially offset dramatic losses due to oceanic warming.
Associated Publication: Smith, Ben, et al. (2020). Pervasive Ice Sheet Mass Loss Reflects Competing Ocean and Atmosphere Processes. Science, vol. 368, no. 6496, pp. 1239–1242. DOI: 10.1126/science.aaz5845.
Consolidating NASA’s understanding of sea level rise
NASA released a comprehensive review of its current understanding of both natural and human-induced regional sea level variation. These include changes in ocean thermodynamics, vertical land motion near the coasts, changes in ice sheet and glacier mass, and variability in land-based water storage and distribution. The study also takes into account high-frequency sea level variability associated with things like tides and storm surge. The study presents updated estimates for major components of sea level rise. For example, the study refines our understanding of average global sea level rise of 3.3 ± 0.4 mm/year over the past three decades and explains why some coastal seas are rising faster than others in response to different physical processes.
Associated Publication: Hamlington, B. D., et al (2020), Understanding of Contemporary Regional Sea-Level Change and The Implications for The Future. Reviews of Geophysics, 58(3). DOI: 10.1029/2019RG000672
Understanding shark hunting patterns
Scientists combined satellite tracking with ocean remote sensing and numerical models to better understand pelagic blue shark movements and migration in the Atlantic Ocean. The pelagic zone is a region within the ocean that encompasses about 333 million cubic miles. Scientists found the sharks used warm swirling water masses called eddies to hunt beyond the pelagic zone into the twilight zone – a region of the deep ocean that lies beyond the reach of sunlight about 650-3,300 feet below the surface. Large eddies in the ocean serve as an internal weather system, mixing the water column and occasionally trapping and transporting smaller prey species, including plankton, for hundreds of miles. This research helps reveal the connection between predators and deep ocean prey resources.
Associated Publication: Braun, C., et al (2019). Mesoscale Eddies Release Pelagic Sharks from Thermal Constraints To Foraging In The Ocean Twilight Zone. PNAS, 116 (35) 17187-17192. DOI: 10.1073/pnas.1903067116.
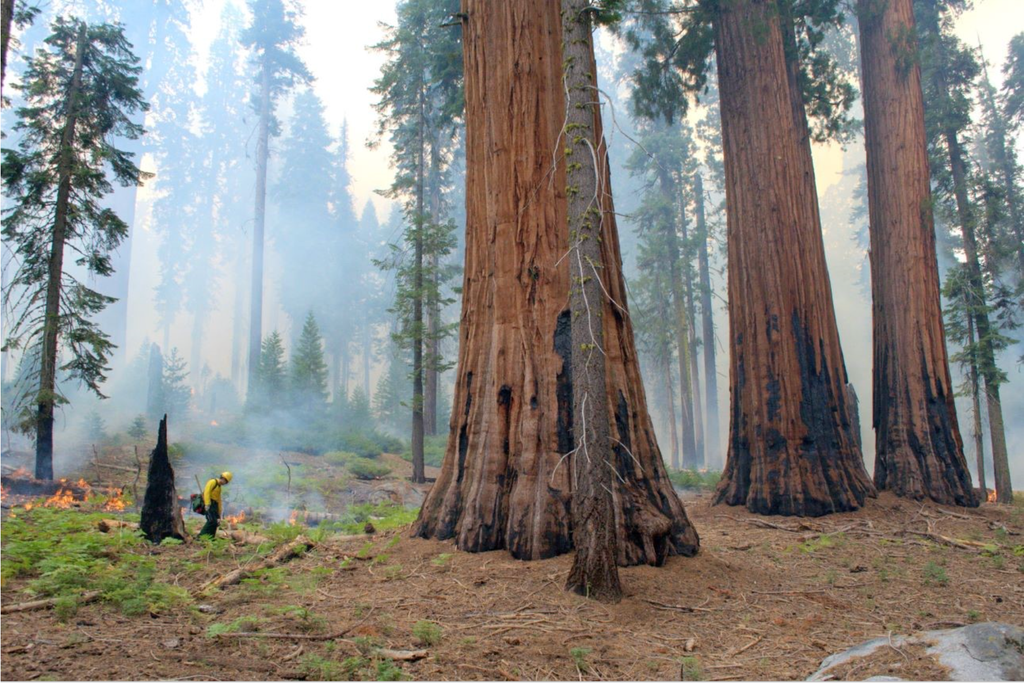
Discovering degradation exceeds deforestation in the Brazilian Amazon
Forest degradation is a common form of human disturbance, including activities like selective logging and extraction. While forest degradation falls short of total deforestation, it can still lead to biomass loss and fragmentation. Although deforestation rates in the Brazilian Amazon are well known, the extent of forest degradation is not. Scientists analyzed the extent of forest degradation across the entire Brazilian Amazon over an approximately 22-year period up until 2014 using high-resolution remote sensing data from NASA’s Landsat satellite. They found that the extent and rate of forest degradation was equal to or greater than deforestation, which has important implications for carbon storage, biodiversity, and energy balance.
Associated Publication: Matricardi, E.A.T., Skole, D.L., et al. (2020). Long-Term Forest Degradation Surpasses Deforestation in the Brazilian Amazon. Science, vol. 369, no. 6509, pp. 1378–1382. DOI: 10.1126/science.abb3021.
Mapping a new component of global air quality
NASA scientists have developed a new method to measure isoprene (C5H8), a chemical compound associated with ozone (O3) formation and poor air quality, using satellite observations. Isoprene is naturally emitted from trees and difficult to measure from space. This is because, once emitted, isoprene reacts rapidly with the surrounding environment to form formaldehyde (HCHO) – a toxic chemical linked to carcinogenic effects. NASA’s new detection method combines machine-learning technology, airborne measurements, and advanced computer modeling to create and validate near-global maps of seasonal isoprene concentrations around the world. These new datasets could help communities in forested regions improve local air quality predictions.
Associated Publication: Wells, K.C., Millet, D.B., Payne, V.H. et al. (2020). Satellite Isoprene Retrievals Constrain Emissions and Atmospheric Oxidation. Nature, 585, 225–233. DOI: 10.1038/s41586-020-2664-3