A Year in Review: New Earth Discoveries in 2018
The Earth Science Division’s Research & Analysis element discovers new things about Earth every day from an array of space, airborne and ground-based observations, along with data processing from highly advanced computer models and algorithms.
- Satellites detect undiscovered penguin populations
- Warm ocean waters off Greenland put glaciers at more risk
- Local land subsidence increases flood risk in San Francisco Bay
- Cold-intolerant plants are creeping farther north
- Linking ocean circulation and riverine carbon flux
- First look at changes in global terrestrial water storage
- India overtakes China as top emitter of sulfur dioxide
- Ice losses from Antarctica have tripled since 2012
- Climate change changing ENSO
- Sea surface salinity could provide new insight into severe storms
- Climate change is speeding up the water cycle
- Accounting for internal variability
- Seeing the connection between neighboring volcanoes at depth
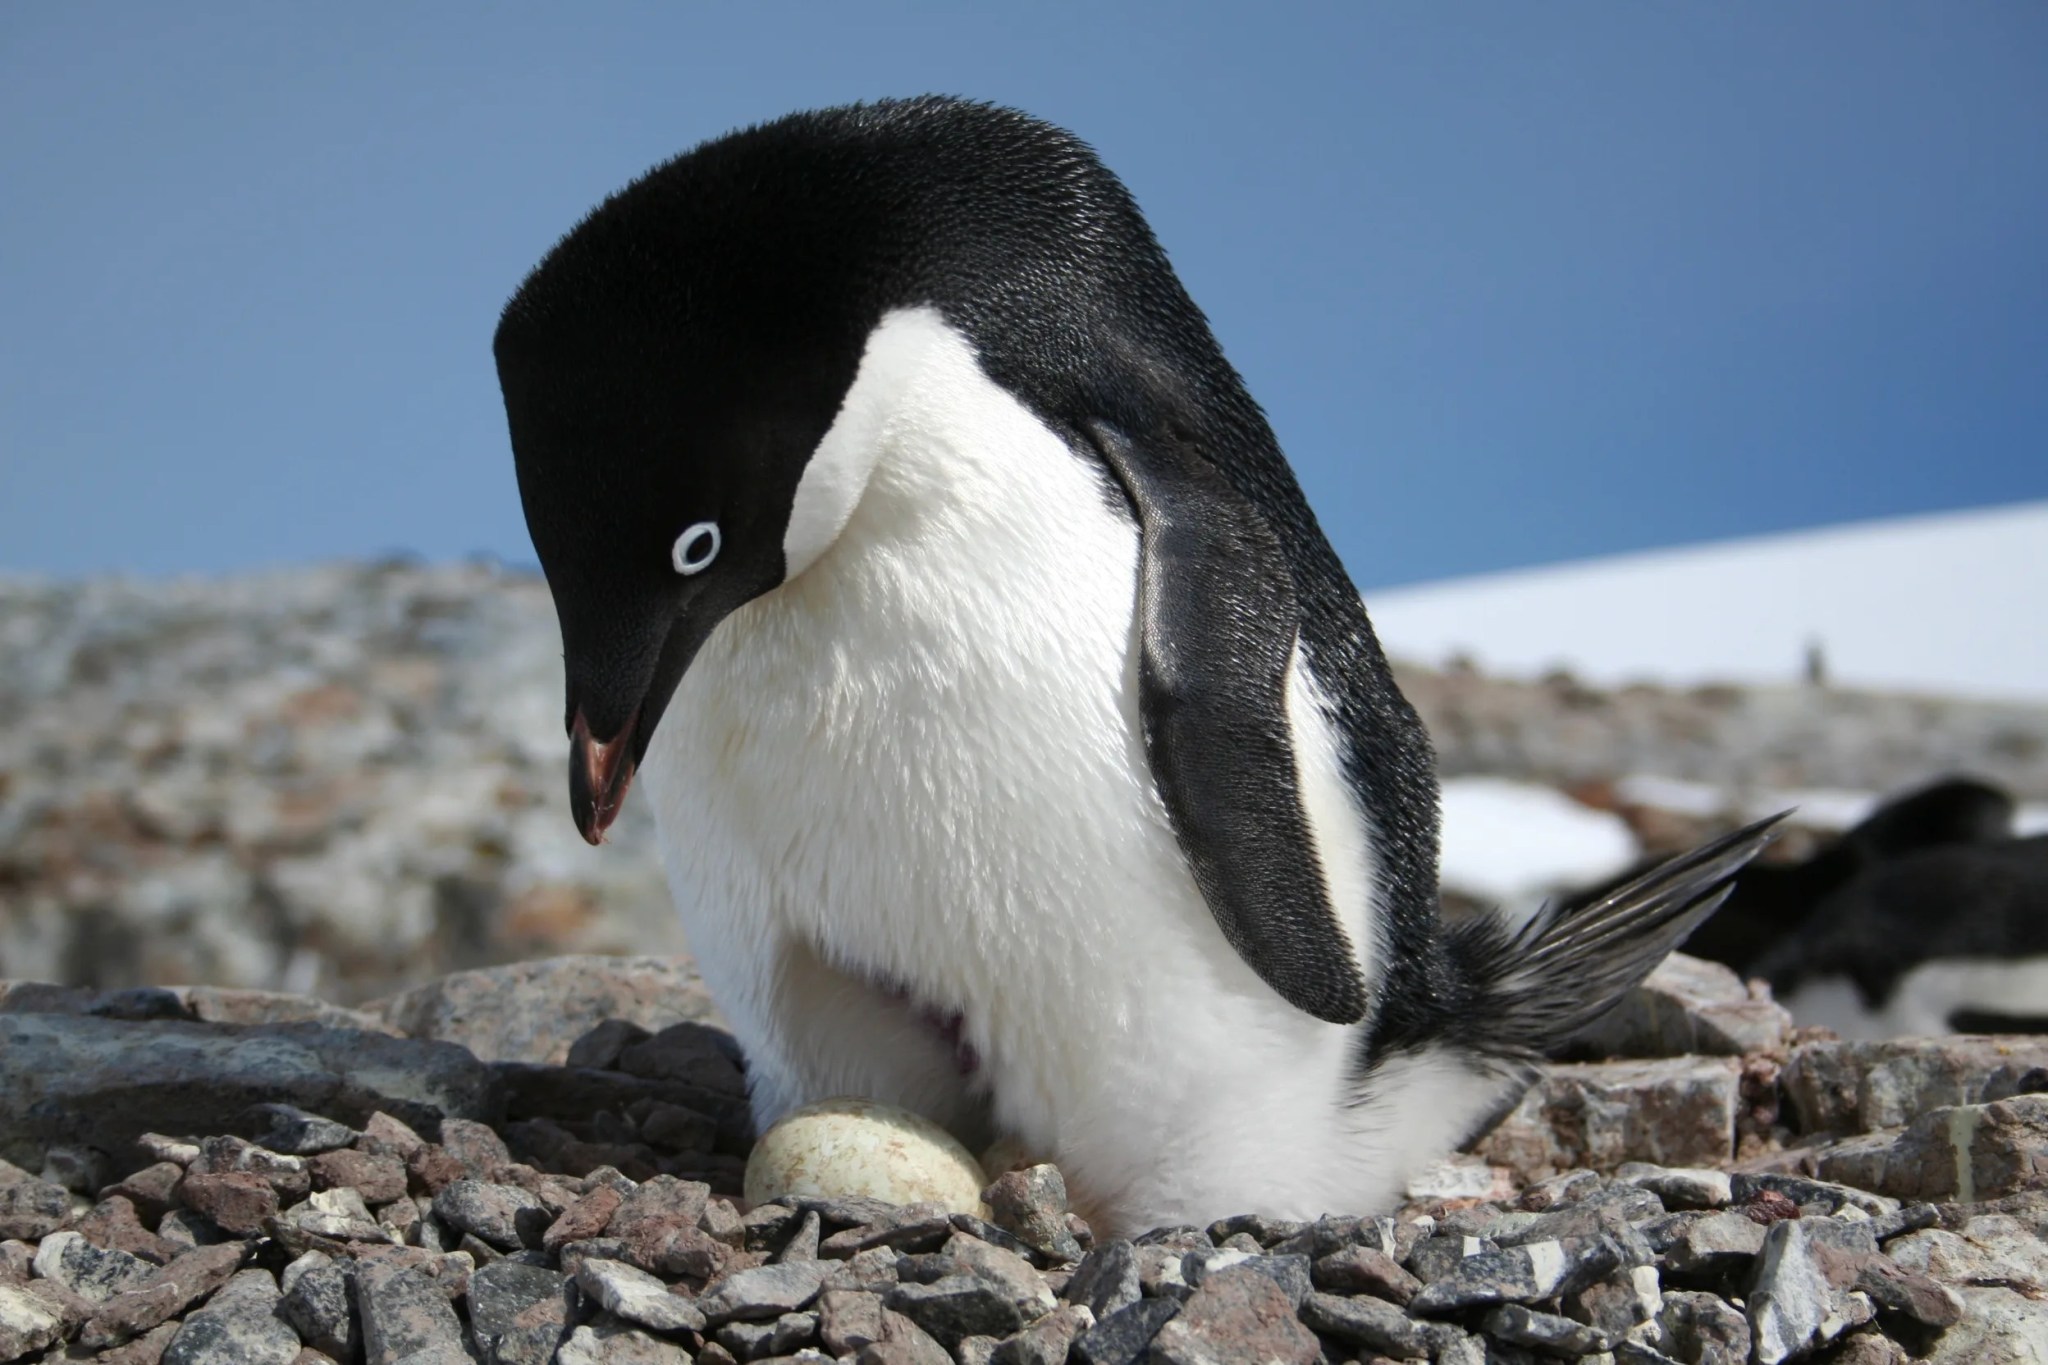
Satellites detect undiscovered penguin populations
Penguin populations are a key environmental indicator of overall ecosystem health that help guide Antarctic conservation policy. When researchers using Landsat imagery detected a previously unknown colony of Adélie penguins off the coast of Antarctica, the robustness of the colony helped inform new species abundance and distribution models in the region, and led to the revision of the boundaries of a regional protected area.
Warm ocean waters off Greenland put glaciers at more risk
The Oceans Melting Greenland airborne campaign has found that warming ocean temperatures around Greenland are partly responsible for accelerated ice loss and thinning glaciers, and that marine-terminating glaciers, or those that protrude into the ocean, are more susceptible to disappearing.
Local land subsidence increases flood risk in San Francisco Bay
Scientists used a host of remote sensing tools to draw a new 100-year inundation map of the San Francisco Bay area. The revised map, considering both future sea level rise and spatially varying local land subsidence, revealed that inundation maps solely based on sea level rise underestimated the flood prone area of San Francisco Bay by 3.7 to 90.9%.
Cold-intolerant plants are creeping farther north
NASA satellites and modeling studies found that rising temperatures across the Arctic are enabling once cold-intolerant plant species to take root. As these plants encroach farther north, they are causing an overall “greening” of the region, which could have lasting effects on how the ecosystem responds to future environmental change.
Linking ocean circulation and riverine carbon flux
Oceanic overturning circulation transports water globally via the ocean’s surface and deep-water currents. This dynamic flow plays a significant role in the redistribution of carbon and heat across the ocean, as well as in the uptake of CO2 from the atmosphere. Rivers link the land and ocean, but riverine input of carbon-rich waters to the ocean is not well constrained: new research shows that global carbon flux models may underestimate the amount of carbon that is transported by the ocean and rivers by 20-100%. This new finding may reshape the way scientists think about land-based carbon storage, reducing the overall role it may play in Earth’s global carbon cycle.
Changes in global terrestrial water storage
Scientists used GRACE satellite data to determine the global response of the terrestrial water system to human activity and climate change. In the Arctic, warming temperatures continue to drive rapid ice sheet and glacier loss. Freshwater gains were seen across northern North America, Eurasia and the Tropics, while regions in southern North America and the Middle East are losing freshwater.
India overtakes China as top emitter of sulfur dioxide
Measurements from the Ozone Monitoring Instrument (OMI) on the Aura satellite conclude that after decades of being the top emitter of toxic sulfur dioxide (SO2), China has been surpassed by India. NASA’s measurements helped confirm that strict policies and pollution control measures put into place in China beginning in the early 2000s have reduced its SO2 emissions by 75%, whereas India’s emissions grew by 50% during the same time.
Ice losses from Antarctica have tripled since 2012
NASA and the European Space Agency teamed up for the Ice Sheet Mass Balance Intercomparison Project to assess Antarctic ice loss and the impact on global sea level rise. They found that ice losses from Antarctica have tripled since 2012, increasing global sea levels by 0.12 inches (3 mm) in that timeframe alone.
Climate change changing ENSO
NASA continues to study the relationship between changing global temperatures and their impact on global weather patterns. New studies this year used decades’ worth of comprehensive, independent satellite observations along with monthly average climate anomalies of temperature and radiative flux data in an attempt to determine how the hydrological cycle could respond to different climate scenarios. The research showed that warming climates lead to a regional intensification of the tropical hydrological cycle during El Niño Southern Oscillation events: meaning that future El Niño events will likely be much more intense.
Sea surface salinity could provide new insight into severe storms
NASA scientists are looking into the possibility of using remotely sensed sea surface salinity (SSS) data to help improve their understanding of how hurricanes form in the Northwestern Tropical Atlantic – a hotbed of hurricane activity. New studies illustrate how changes in SSS can be used to track Atlantic storms, emphasizing the role of salinity stratification in driving upper-ocean dynamics and hurricane evolution.
Climate change is speeding up the water cycle
A new quantitative framework for characterizing on-land water cycle intensity (WCI) showed that changes in river discharge patterns across the lower United States over the past seven decades are linked to climate change processes driving faster rates of ocean evaporation, terrestrial evapotranspiration, and precipitation. The framework found that WCI increased over most of the U.S. between the time periods of 1945-1974 and 1985-2014, primarily due to increased precipitation. This framework will help improve global water forecasting models.
Accounting for internal variability
NASA continues to study the extent of future warming in climate change scenarios, including Earth’s equilibrium climate sensitivity (ECS), or the eventual warming response to a doubling of atmospheric carbon dioxide (CO2). Estimates of ECS based on recent observations are lower than model estimates, suggesting that model estimates may be wrong. However, when models are constrained with observed recent sea surface temperatures, their ECS estimates are also lower than the unconstrained model estimates. This suggests that the natural variability of the Earth system may be confounding estimates of ECS based on recent observations.
Seeing the connection between neighboring volcanoes at depth
Scientists combined GPS time series and deformation models to determine that the magmatic systems of two neighboring volcanoes were connected at depth. They observed the Aira caldera in southern Japan steadily inflate until rapidly deflating in the period following the eruption of the Kirishima volcano. This deflation, which could not be explained by tectonic or volcanic stress changes, was interpreted as the Kirishima system pulling magma from the Aira system during the Kirishima replenishment phase. Such volcanic interaction processes could play an important role in eruption forecasting models.


