5 min read


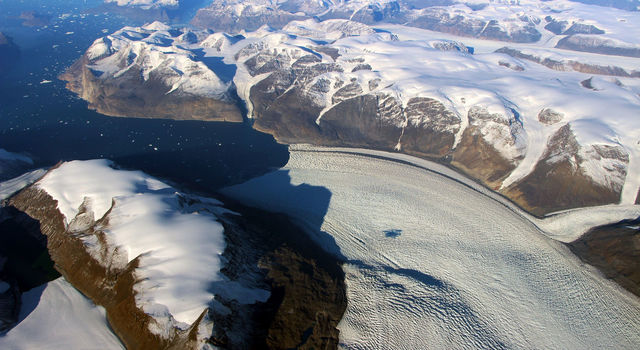
Rink Glacier in western Greenland, with a meltwater lake visible center. Credit: NASA/OIB
A new NASA study finds that during Greenland's hottest summers on record, 2010 and 2012, the ice in Rink Glacier on the island's west coast didn't just melt faster than usual, it slid through the glacier's interior in a gigantic wave, like a warmed freezer pop sliding out of its plastic casing. The wave persisted for four months, with ice from upstream continuing to move down to replace the missing mass for at least four more months.
This long pulse of mass loss, called a solitary wave, is a new discovery that may increase the potential for sustained ice loss in Greenland as the climate continues to warm, with implications for the future rate of sea level rise.
The study by three scientists from NASA's Jet Propulsion Laboratory in Pasadena, California, was the first to precisely track a glacier's loss of mass from melting ice using the horizontal motion of a GPS sensor. They used data from a single sensor in the Greenland GPS Network (GNET), sited on bedrock next to Rink Glacier. A paper on the research is published online in the journal Geophysical Research Letters.
Rink is one of Greenland's major outlets to the ocean, draining about 11 billion tons (11 gigatons) of ice per year in the early 2000s — roughly the weight of 30,000 Empire State Buildings. In the intensely hot summer of 2012, however, it lost an additional 6.7 gigatons of mass in the form of a solitary wave. Previously observed melting processes can't explain that much mass loss.
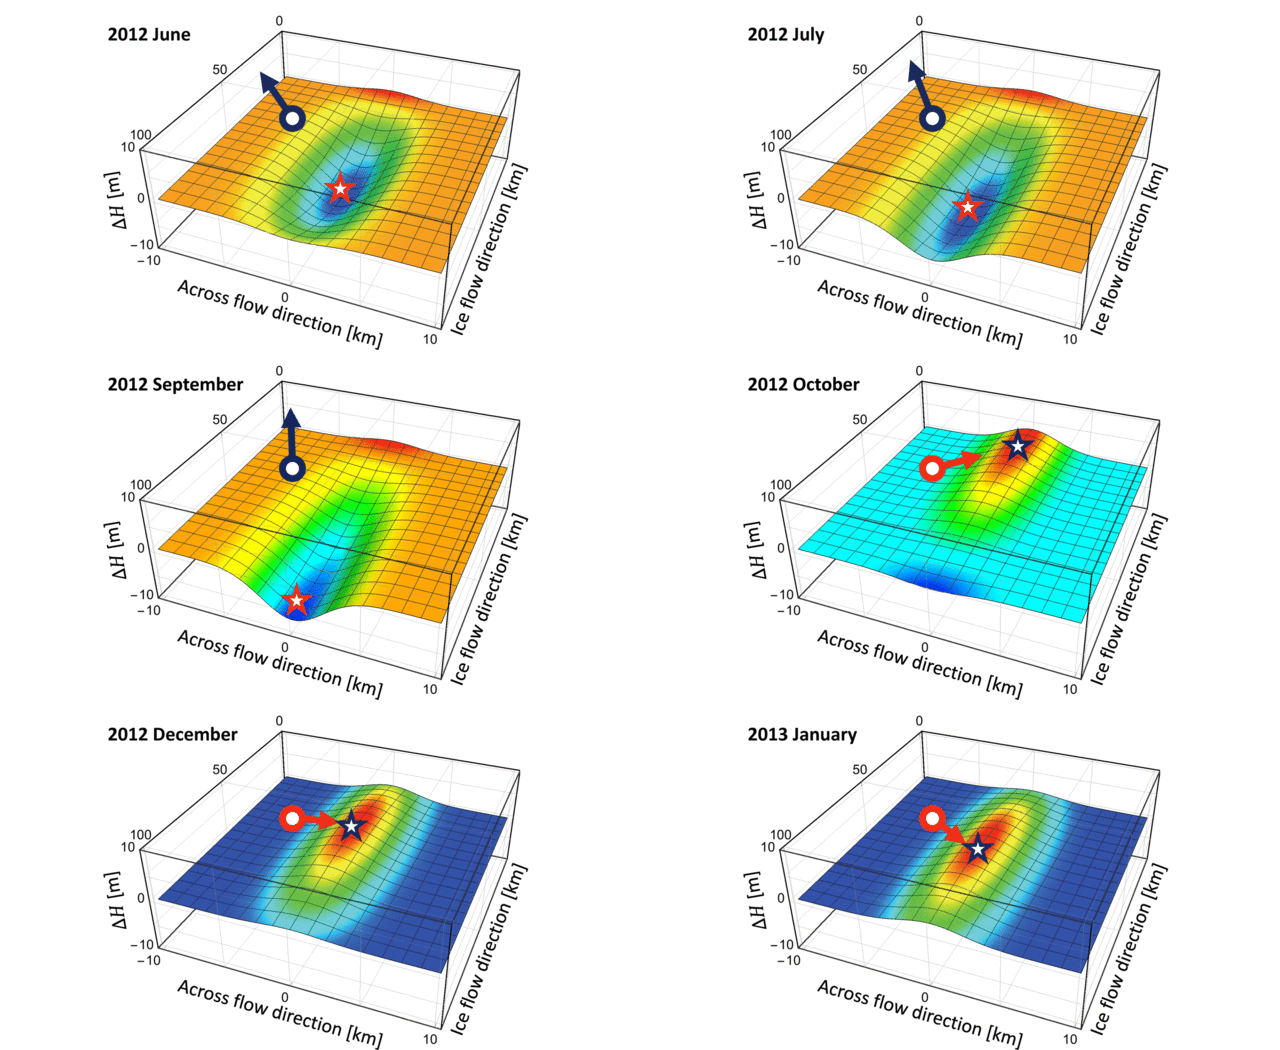
The wave moved through the flowing glacier during the months of June through September at a speed of about 2.5 miles (4 kilometers) a month for the first three months, increasing to 7.5 miles (12 kilometers) during September. The amount of mass in motion was 1.7 gigatons, plus or minus about half a gigaton, per month. Rink Glacier typically flows at a speed of a mile or two (a few kilometers) a year.
The wave could not have been detected by the usual methods of monitoring Greenland's ice loss, such as measuring the thinning of glaciers with airborne radar. "You could literally be standing there and you would not see any indication of the wave," said JPL scientist Eric Larour, a coauthor of the new paper. "You would not see cracks or other unique surface features."
The researchers saw the same wave pattern in the GPS data for 2010, the second hottest summer on record in Greenland. Although they did not quantify the exact size and speed of the 2010 wave, the patterns of motion in the GPS data indicate that it must have been smaller than the 2012 wave but similar in speed.
"We know for sure that the triggering mechanism was the surface melting of snow and ice, but we do not fully understand the complex array of processes that generate solitary waves," said JPL scientist Surendra Adhikari, who led the study.
During the two summers when solitary waves occurred, the surface snowpack and ice of the huge basin in Greenland's interior behind Rink Glacier held more water than ever before. In 2012, more than 95 percent of the surface snow and ice was melting. Meltwater may create temporary lakes and rivers that quickly drain through the ice and flow to the ocean. "The water upstream probably had to carve new channels to drain," explained coauthor Erik Ivins of JPL. "It was likely to be slow-moving and inefficient." Once the water had formed pathways to the base of the glacier, the wave of intense loss began.
The scientists theorize that previously known processes combined to make the mass move so quickly. The huge volume of water lubricated the base of the glacier, allowing it to move more rapidly, and softened the side margins where the flowing glacier meets rock or stationary ice. These changes allowed the ice to slide downstream so fast that ice farther inland couldn't keep up.
The glacier gained mass from October through January as ice continued to move downstream to replace the lost mass. "This systematic transport of ice in fall to midwinter had not been previously recognized," Adhikari emphasized.
"Intense melting such as we saw in 2010 and 2012 is without precedent, but it represents the kind of behavior that we might expect in the future in a warming climate," Ivins added. "We're seeing an evolving system."
Greenland's coast is dotted with more than 50 GNET stations mounted on bedrock to track changes below Earth's surface. The network was installed as a collaborative effort by the U.S. National Science Foundation and international partners in Denmark and Luxembourg. Researchers use the vertical motions of these stations to observe how the North American tectonic plate is rebounding from its heavy ice burden of the last ice age. Adhikari, Ivins and Larour were the first to quantitatively explore the idea that, under the right circumstances, the horizontal motions could reveal how the ice mass was changing as well.
"What makes our work exciting is that we are essentially identifying a new, robust observational technique to monitor ice flow processes on seasonal or shorter time scales," Adhikari said. Existing satellite observations do not offer enough temporal or spatial resolution to do this.
The GNET stations are not currently being maintained by any agency. The JPL scientists first spotted the unusual behavior of Rink Glacier while examining whether there were any scientific reasons to keep the network going.
"Boy, did we find one," Ivins said.
Media contact
Alan Buis
Jet Propulsion Laboratory, Pasadena, California
818-354-0474
Alan.Buis@jpl.nasa.gov


