


October 6, 2015
2015 Antarctic Sea Ice Extent

Sea ice atop the Southern Ocean around Antarctica reached its annual maximum extent on October 6, 2015. The extent was less than the previous three years, which brought consecutive years of new record highs.
“After three record-high extent years, this year marks a return toward normalcy for Antarctic sea ice,” said Walt Meier, a sea ice scientist at NASA’s Goddard Space Flight Center.
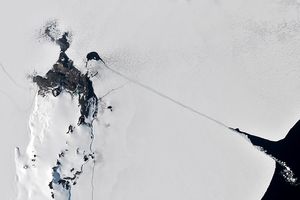
Data for the maps above were acquired by the Advanced Microwave Scanning Radiometer 2 (AMSR2) sensor on Japan’s Global Change Observation Mission 1st–Water (GCOM-W1) satellite. The yellow outline shows the median sea ice extent observed in September from 1981 through 2010. Extent is calculated by considering the area spanned only by pixels that are at least 15 percent covered with ice.
The top map shows sea ice at its annual maximum extent on October 6, 2015. The extent was the sixteenth highest in the 35-year record, measuring 18.83 million square kilometers (7.27 million square miles). The second image shows the annual maximum on September 20, 2014, a record-high extent of 20.14 million square kilometers (7.78 million square miles). Turn on the image comparison tool to see how the extent and location of ice varied between the two years.
In 2015, sea ice coverage was greater than average around the Antarctic Peninsula, the Weddell Sea, and the Wilkes Land coast, according to an analysis by the National Snow & Ice Data Center. The Ross Sea and the Indian Ocean-facing coast had below average sea ice.
Scientists think the strong El Niño could have had an effect on Antarctic sea ice in 2015. El Niño causes higher sea level pressure, warmer air temperature, and warmer sea surface temperature in the seas off west Antarctica—all of which affect the sea ice distribution.
References & Resources
- NASA Ice (2015, October 15) 2015 Antarctic Maximum Sea Ice Extent Breaks Streak of Record Highs. Accessed October 16, 2015.
- National Snow & Ice Data Center (2015, October 15) Antarctic Sea Ice at its 2015 Maximum. Accessed October 16, 2015.
NASA Earth Observatory maps by Jesse Allen, using data from the Advanced Microwave Scanning Radiometer 2 (AMSR2) sensor on the Global Change Observation Mission 1st-Water (GCOM-W1) satellite and the Scanning Multichannel Microwave Radiometer (SMMR) on the Nimbus-7 satellite. NASA Earth Observatory chart by Joshua Stevens, using data from the National Snow & Ice Data Center . Caption by Kathryn Hansen, adapted from materials by Maria-José Viñas.
None