

For the past few decades, scientists have been using satellite- and airplane-based radar instruments to detect damage caused by wildfires and human-caused blazes. Radar instruments can observe by day or night and can see land through clouds and smoke, so they are helpful for observing fire fronts and burn scars during and shortly after fire ravages a landscape.
Landscape ecologist Naiara Pinto and colleagues at NASA’s Jet Propulsion Laboratory are now taking a longer view. They are trying to decipher where and how well forests and scrublands are recovering in the years after a fire.
Synthetic aperture radar (SAR) instruments send out pulses of microwaves that bounce off of Earth’s surfaces. The reflected waves are detected and recorded by the instrument and can help map the shape of the land surface (topography) and the land cover—from cities to ice to forests. By comparing changes in the signals between two separate satellite or airplane overpasses, scientists can observe surface changes like land deformation after earthquakes, the extent of flooding, or the exposure of denuded or bare ground after large fires.
SAR instruments are carried on the European Space Agency's Sentinel-1 satellites, while NASA currently deploys its Uninhabited Aerial Vehicle Synthetic Aperture Radar (UAVSAR) via research aircraft. NASA and the Indian Space Research Organization are planning to launch the NISAR satellite in 2022.
Mounted on the bottom of NASA research planes, UAVSAR has been flown over the same portions of Southern California several times since 2009. Pinto and JPL colleagues Latha Baskaran, Yunling Lou, and David Schimel analyzed that data and developed a mapping technique to show the different stages of removal and regrowth of vegetation (chapparal and forest).
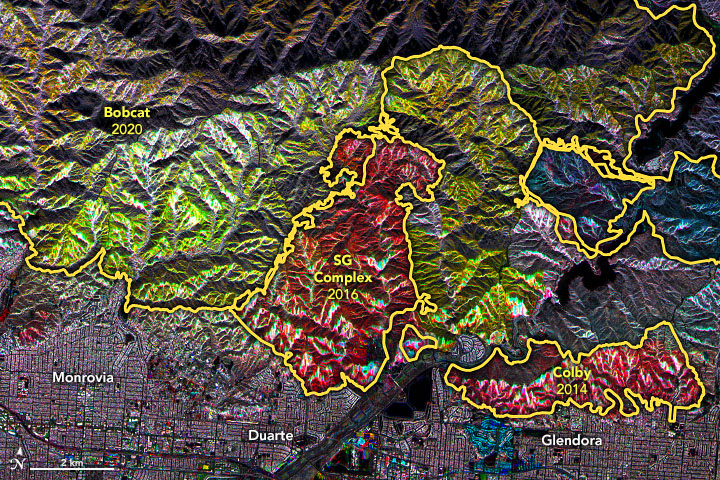
The maps above are essentially mosaics of the observations across a decade. Radar signals bounce off burned, barren terrain differently than they reflect from unburned, brush-covered hillsides or from fresh growth. The colors indicate the relative amount of vegetation observed by different UAVSAR flights at different times. Yellow lines on the maps indicate the extent of several major fires: Station, Colby, San Gabriel (SG) Complex, La Tuna, and Bobcat.
“Overall, the colors are telling us that the Angeles National Forest contains a patchwork of plant communities at different stages of regeneration,” said Pinto, who is a science coordinator for UAVSAR. For instance, areas with more red had more vegetation in 2010 than they do now. Areas with more blue and green shading had more vegetation (regrowth) in recent years. Yellow indicates areas burned in 2020 that had a higher volume of vegetation in 2010 and 2017 (red+green) but lower volume in 2020 (blue)
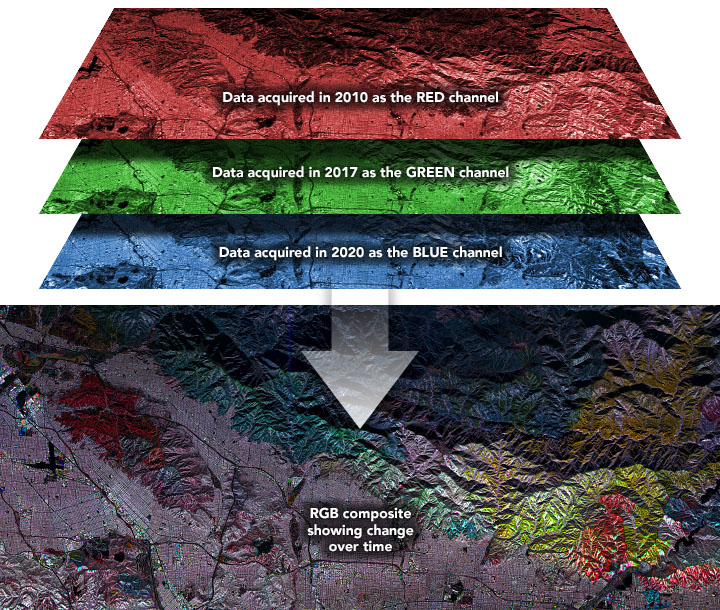
The image above illustrates how those maps were assembled. Radar data were collected during UAVSAR flights in 2010, 2017, and 2020 over Angeles National Forest and other areas northeast of the greater Los Angeles metropolitan area.
The project has been supported by NASA’s Earth Applied Sciences Disasters program, which generates maps and other data products for institutional partners as they work to mitigate and recover from natural hazards and disasters. The SAR technique is still being tested and validated, but the intent is to monitor forest regrowth and fire scar change over time, which are important information for forest and fire managers working to manage risks.
References & Resources
- Ban, Y. et al. (2020) Near Real-Time Wildfire Progression Monitoring with Sentinel-1 SAR Time Series and Deep Learning. Nature Scientific Reports, 10 (1322).
- California EPA (2021, January 8) Governorâs task force outlines actions to reduce wildfire rish, improve health of forests and wildlands. Accessed February 1, 2021.
- Czuchlewski, K.R. and Weissel, J. K. (2005) Synthetic aperture radar (SAR)-based mapping of wildfire burn severity and recovery. Proceedings: 2005 IEEE International Geoscience and Remote Sensing Symposium.
- Donnellan, A., et al. (2018) UAVSAR and Optical Analysis of the Thomas Fire Scar and Montecito Debris Flows: Case Study of Methods for Disaster Response Using Remote Sensing Products. Earth and Space Science 5, 339â347.
- Jung, J., et al. (2018) Damage-Mapping Algorithm Based on Coherence Model Using Multitemporal Polarimetric-Interferometric SAR Data. IEEE Transactions on Geoscience and Remote Sensing 56, 1520â1532.
- NASA EarthData (2020, April 16) What is synthetic aperture radar? Accessed February 1, 2021.
- NASA Jet Propulsion Laboratory (2021) What is UAVSAR? Accessed February 1, 2021.
- NASA Jet Propulsion Laboratory (2020, September 15) NASA Takes Flight to Study Californiaâs Wildfire Burn Areas. Accessed February 1, 2021.
- Parker, J., Donnellan, A., & Glasscoe, M. (2021) Survey of Transverse Range Fire Scars in Ten Years of UAVSAR Polarimetry. Wiley.
- Rains C. (2019) Detection of Fire Burn Scars by UAVSAR: Immediate, Short-term, and Multi-year Observations and Applications. NASA presentation.
NASA Earth Observatory images by Joshua Stevens, using UAVSAR data and imagery courtesy of Anne Marie Peacock, Naiara Pinto, and Yunling Lou and NASA/Caltech UAVSAR. Story by Michael Carlowicz.