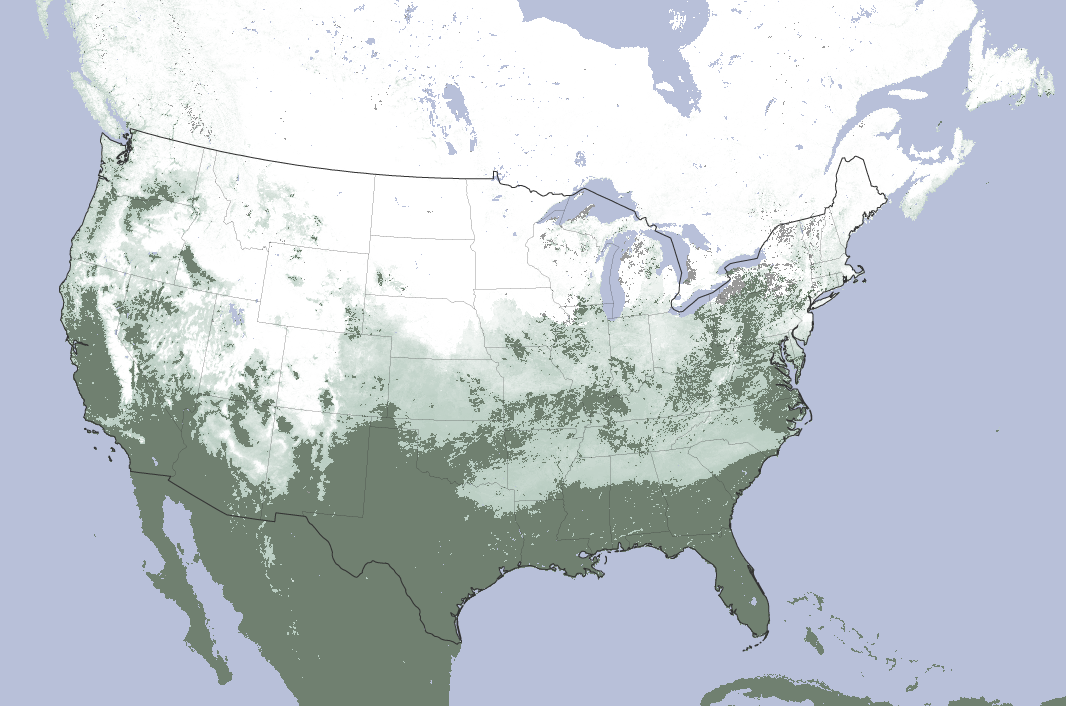


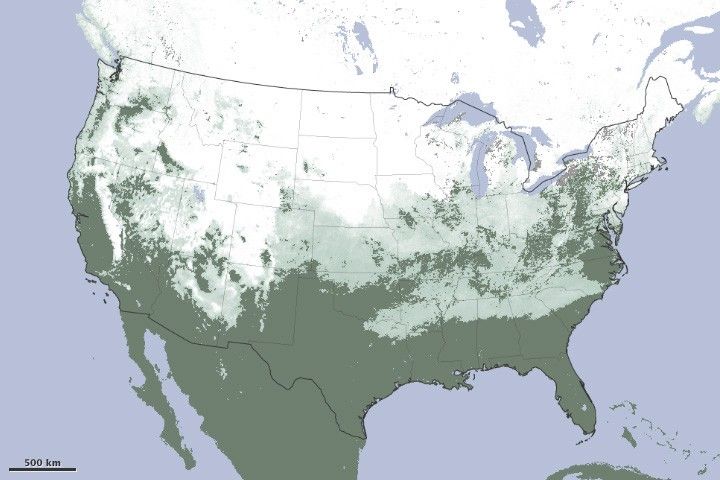
January 2011 was marked by a series of crippling snow storms across theUnited States. By January 12, about 71 percent of the country had snow onthe ground, the fifth-largest snow cover extent in the last 45 years. Thisimage, made with data from the Moderate Resolution Imaging Spectroradiometer(MODIS) on NASA’s Terra satellite (from the monthly snow cover product), shows the maximum snowcover for the month. The image shows that every state in the contiguousUnited States, with the exception of Florida, got snow in January.
The image provides a gauge for both snow extent and the length of timesnow stayed on the ground. Areas that are white in this image were entirelycovered with snow for most of the month. Pale green areas had snow for justpart of the month or were only partly snowy, with areas of exposed ground.Dark green areas are places where MODIS did not observe snow during themonth. The sensor does not see through clouds, so it does not see snow that is only on theground on cloudy days.
With all the snow, it would be easy to think that the United Statesreceived plenty of winter moisture, but snow is deceptive. It takes about 10 inches of fresh snow to make an inch of liquid water when it melts. The winter storms brought more snow, but less rain to much of the UnitedStates, said the National Climatic Data Center. January 2011 was the ninth-driest January in the United States in 117 years. The southern half of thecountry was particularly hard hit. New Mexico experienced its driest Januaryon record.
Satellite snow cover measurements, like this one, play an important rolein helping scientists measure trends in snow cover and how snow influencesEarth’s climate. Satellite measurements show that, despite the snow inJanuary 2011, snow cover extent has dropped on average across the NorthernHemisphere in the last 30 years. Recentresearch indicates that the drop in snow cover is contributing to warmertemperatures in the Northern Hemisphere.
References & Resources
- Hall, D.K. and Riggs, G.A. (2007) Accuracy assessment of the MODISsnow-cover products. Hydrological Processes, 21(12):1534-1547.
- NASA. (n.d.) The MODISsnow and sea ice global mapping project. Accessed February 24,2011.
- National Climate Data Center. (2011, February). State of the climatenational overview, January 2011. National Oceanic and AtmosphericAdministration. Accessed February 24, 2011.
- U.S. Drought Monitor. (2011, February 22). National drought summary– February 22, 2011. Accessed February 24, 2011.
NASA Earth Observatory image by Robert Simmon, based on data from the MODIS Snow and Sea Ice Global Mapping Project. Caption by Holli Riebeek.