While it has been a quiet hurricane season in the Atlantic Basin, the western North Pacific has been churning out typhoons on a near weekly basis. One of the most recent to emerge—Atsani—achieved super typhoon status (equivalent of a Category 4 or 5 storm) earlier this week as it churned over the Pacific well northeast of Guam and Saipan.
Atsani was the twelfth typhoon and sixth super typhoon of the year in the western North Pacific—numbers that meteorologists say put the season on a record-breaking track. While the storm will likely curve northeast in the coming days and miss Japan, it remains of interest to atmospheric scientists studying the inner workings of typhoons.
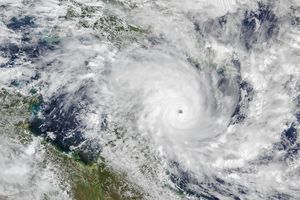
Shortly before Atsani became a super typhoon on August 19, 2015, CloudSat passed near its eye and used cloud-penetrating radar to collect information about the inside of the storm. The CloudSat data (lower image) is a cross-section—it shows what the storm would look like if it had been sliced near the middle and viewed from the side. The top image, acquired the same day by the Moderate Resolution Imaging Spectroradiometer (MODIS) on the Aqua satellite, is shown for reference. The red line is the north-to-south track that CloudSat took over the storm. Note that the storm image has been rotated.
In the CloudSat data, the darkest blues represent areas where clouds and raindrops reflected the strongest signal back to the satellite radar. These areas had the heaviest precipitation and the largest water droplets. The blue horizontal line across the data is the freezing line; ice particles formed above it, raindrops below it. CloudSat passed just west of the eye, offering a good view of the storm’s outward sloping eyewall, intense convection and rainfall, and cloud structure. Atsani’s clouds reached about 16 kilometers (10 miles) altitude at their highest point. When CloudSat imaged the storm, Atsani’s maximum sustained winds were about 150 miles (240 kilometers) per hour.
While the satellite has collected over 10 million radar profiles since launching in 2006, it is relatively unusual to capture data of a major storm’s eye. Over its lifespan, the satellite has imaged about 1,200 hurricane or typhoon strength tropical cyclones, according to a study published recently in the Bulletin of the American Meteorological Society. Among them, CloudSat has acquired about 30 direct eye overpasses. Scientists are compiling all of the storm overpasses into a database that they are using to better understand the anatomy and behavior of tropical cyclones.
References & Resources
- Colorado State University (2015, March 20) Super Typhoon Atsani. Accessed August 20, 2015.
- NASA Hurricane Page (2015, May 20) Atsani. Accessed August 20, 2015.
- Stars and Stripes Super Typhoon 17W (Atsani) Accessed August 20, 2015.
- The Weather Channel (2015, August 20) Western Pacific Tropical Cyclone Activity Sees Record Year to Date. Accessed August 20. 2015.
- Tourville, N. et al, (2015, April) Remote Sensing of Tropical Cyclones: Observations from CloudSat and A-Train Profilers. Bulletin of the American Meteorological Society, 96, 609-622.
NASA Earth Observatory image by Jesse Allen, using CloudSat data provided courtesy of the CloudSat team at Colorado State University . Caption by Adam Voiland.