Over the past two decades, vegetation across Alaska has displayed some dramatic changes. But the patterns are complex, with plants and trees thriving in many parts of the state while degenerating rapidly in the coastal southwest.
“Many regions of Alaska are experiencing a high level of year-to-year variability in the seasonality of vegetation growth—among the highest in the world—and probably due to climate change,” said Christopher Potter, an ecologist at NASA’s Ames Research Center. Potter and colleagues described these transformations in a paper published in May 2020 in the journal Remote Sensing.
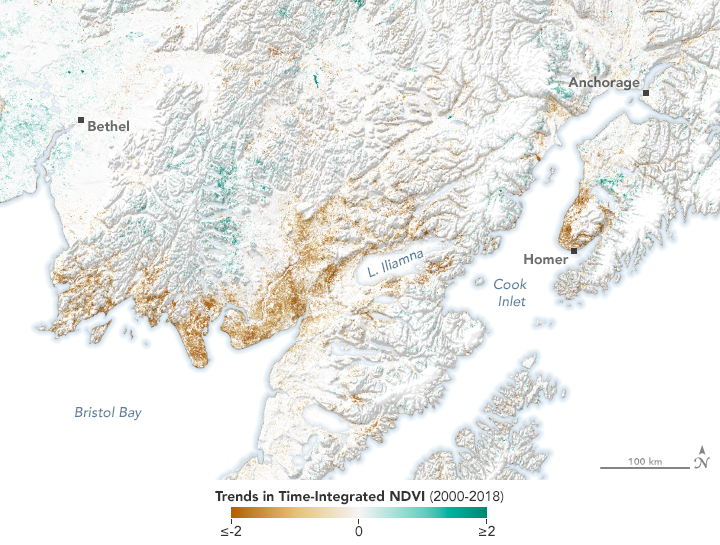
The changes are apparent on the maps on this page, which show where vegetation has increased (greened) or decreased (browned) during the summer growing seasons between 2000 and 2018. Data for the maps are a summation from the Normalized Difference Vegetation Index (NDVI), which uses data from the MODIS instrument on the Terra satellite to measure the productivity or “greenness” of vegetation based on the differences in red and near-infrared radiation that they reflect.
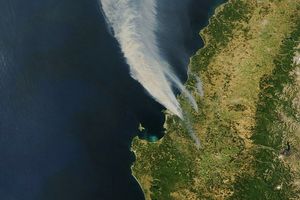
Notice in the wide view (above) that “greening”—areas of increased growth, vegetation cover, or both—is widespread. As soil permafrost thaws in northern Arctic areas, vegetation has more water and nutrients for growth. And in the interior part of the state, some dark green spots reflect the regrowth of vegetation after large patches of forest were burned by wildfire.
In contrast, the vegetation across Alaska’s coastal southwest has declined more than anywhere else in the state. This so-called “browning”—areas of declining growth and vegetation cover—is most pronounced in the lowlands around Cook Inlet and in the watersheds of Bristol Bay. The second map (below) details this decline, which likely reflects changes to the region’s tundra and wetland vegetation. Causes could include rapid soil erosion, more extreme freeze-thaw cycles, insect outbreaks, and the advance of shrubs and coniferous trees into grassy wetland areas.
Maps like these can help scientists and land managers plan future study locations across a state where the response of vegetation to climate change has been so variable. For example, the watersheds showing extensive browning also happen to support half of the world’s supply of sockeye salmon. Whether fish are affected by the vegetation change, either directly or indirectly, remains to be seen.
“The full implications are still to be determined,” Potter said. “But change this rapid is rarely good for ecosystems; it could result in the demise of fisheries, wildlife, and subsistence resources for humans.”
References & Resources
- EPA About Bristol Bay. Accessed July 24, 2020.
- NASA Earth Science at Ames.
- Potter, C. and Alexander, O. (2020) Changes in Vegetation Phenology and Productivity in Alaska Over the Past Two Decades. Remote Sensing, 12 (10), 1546.
NASA Earth Observatory image by Lauren Dauphin, using data from Potter, Christopher, et al. (2020) . Story by Kathryn Hansen .