
Snow fell in the U.S. Deep South, severe storms battered the East Coast, and International Falls, Minnesota, set a new temperature record: -46 degrees Fahrenheit (-43 degrees Celsius) on January 21. But in areas north of the United States and southern Canada, temperatures were above normal. In fact, unusual warmth forced residents of Iqaluit, capital of the Canadian territory of Nunavut, to cancel their New Year’s snowmobile parade.
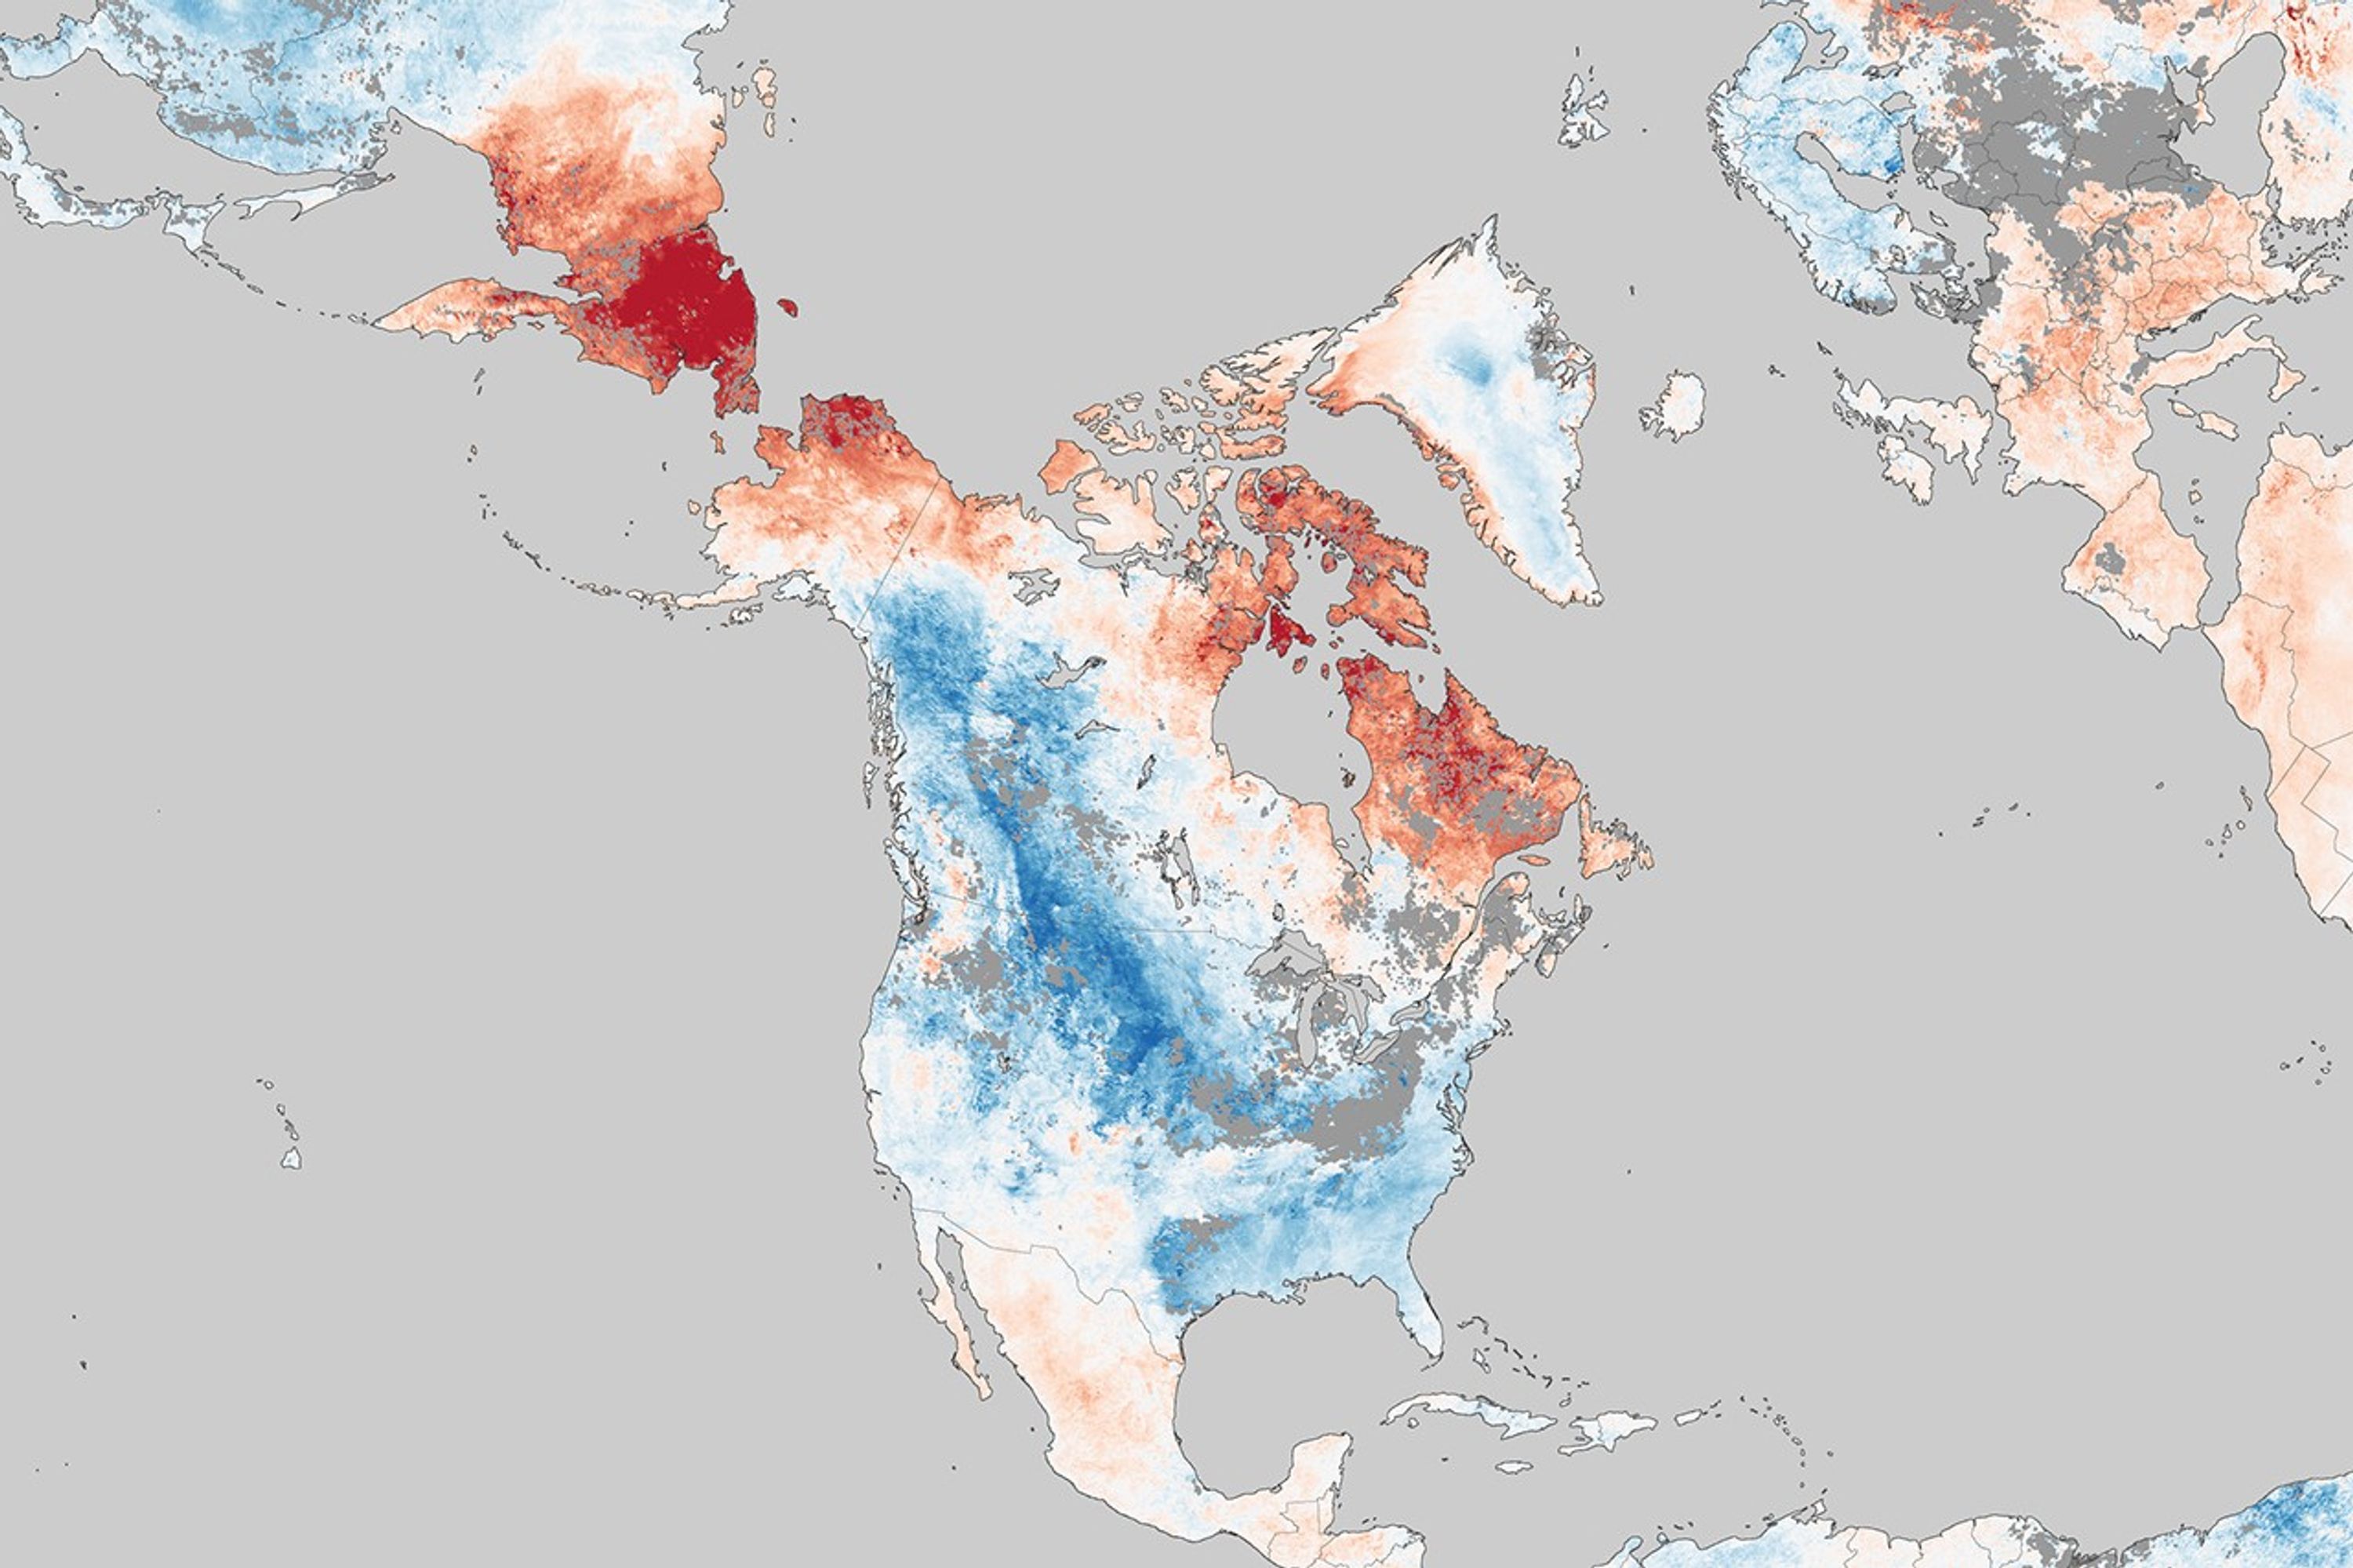
This map of the United States, Canada, eastern Siberia, and Greenland shows temperature anomalies for January 9 to 16, 2011, compared to the same dates from 2003 through 2010. The anomalies are based on land surface temperatures observed by the Moderate Resolution Imaging Spectroradiometer (MODIS) on NASA’s Aqua satellite. Areas with above-average temperatures appear in red and orange, and areas with below-average temperatures appear in shades of blue. Oceans, lakes, and areas with insufficient data (usually because of persistent clouds) appear in gray.
Because this image shows temperature anomalies rather than absolute temperatures, red or orange areas are not necessarily warmer than blue areas. The reds and blues indicate local temperatures that are warmer or colder than the norm for that particular area. The overall configuration of warmer-than-normal temperatures in the north and cooler-than-normal temperatures in the south probably results from a climate pattern known as the Arctic Oscillation (AO).
The AO is a pattern of differences in air pressure between the Arctic and mid-latitudes. When the AO is in “positive” phase, air pressure over the Arctic is low, pressure over the mid-latitudes is high, and prevailing winds confine extremely cold air to the Arctic. But when the AO is in “negative” phase, the pressure gradient weakens. The air pressure over the Arctic is not quite so low, and air pressure at mid-latitudes is not as high. In this negative phase, the AO enables Arctic air to slide south and warm air to slip north.
The AO went into negative phase in the Northern Hemisphere winter of 2009–2010. The AO was in negative mode again in the winter of 2010–2011, affecting temperatures across the Northern Hemisphere as early as December 2010.
The AO can change from positive to negative mode, and vice versa, sometimes in a matter of weeks. Forecasts from the U.S. National Oceanic and Atmospheric Administration (NOAA) indicated that the AO might return to positive mode in February 2011, although the possibility of a lingering negative mode remained.
References & Resources
- Garriss, E.B. (2011, January). Blame the Arctic Oscillation! The Old Farmer's Almanac. Accessed January 25, 2011.
- Gillis, J. (2011, January 24). Cold Jumps Arctic “Fence,” Stoking Winter’s Fury. The New York Times. Accessed January 25, 2011.
- NOAA Climate Prediction Center. (2011, January). Monitoring Weather and Climate. Accessed January 25, 2011.
- O’Carroll, Staff. (2011, January). The Five Coldest Places on Earth. Christian Science Monitor. Accessed January 25, 2011.
NASA Earth Observatory image created by Jesse Allen, using data provided by the Land Processes Distributed Active Archive Center (LPDAAC). Caption by Michon Scott.