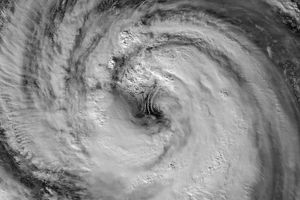


In the absence of direct wind speed measurements, one of the common methods used to estimate the intensity of tropical cyclones is the Dvorak technique. Developed four decades ago by American meteorologist Vernon Dvorak, the technique estimates maximum wind speeds by analyzing subtle differences in visible and infrared satellite imagery. However, the Dvorak method does not directly measure a storm’s winds, and some meteorologists think it overestimates maximum wind speed in some circumstances.
Since meteorological organizations do not send hurricane hunter aircraft to monitor typhoons and cyclones in the Pacific—and few ground instruments survived the storm—the Joint Typhoon Warning Center and other groups had to rely heavily on the Dvorak method to estimate wind speeds for Super Typhoon Haiyan. As meteorologist Eric Holthaus pointed out, the storm even maxed out the Dvorak scale, scoring an 8.0 on an 8.0 scale as Haiyan approached the Philippines on November 7.
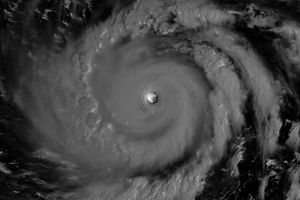
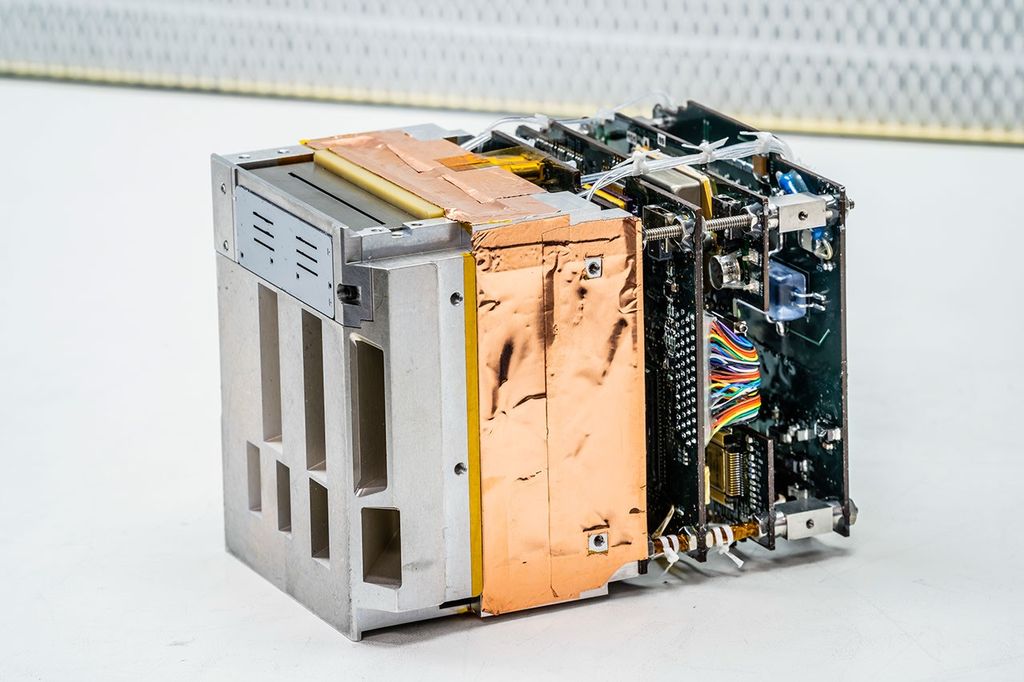
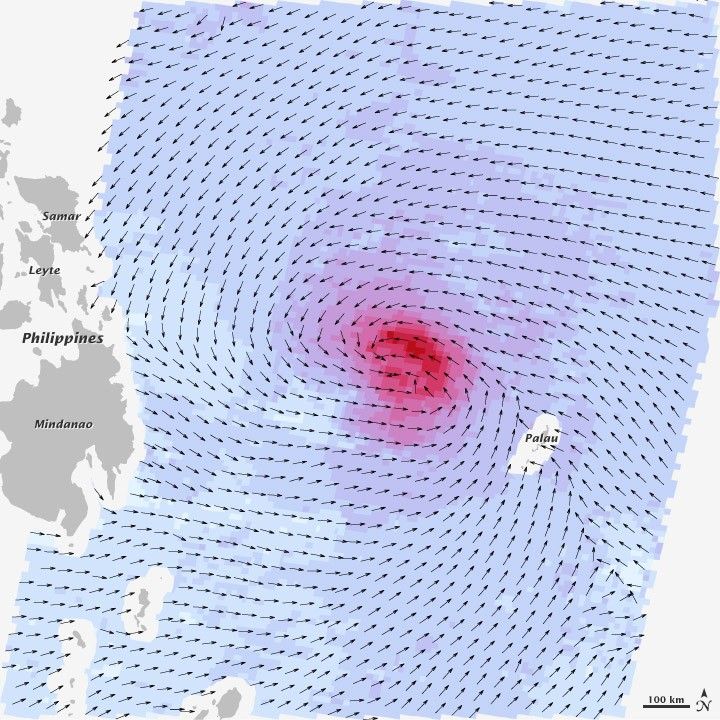
Scatterometers, a type of microwave radar, can also measure the strength of a storm’s winds. The dual-beam rotating scatterometer on the Indian Space Research Organization’s Oceansat-2 satellite, for instance, can be used to measure the strength of the winds at the ocean surface. On November 7, 2013, Oceansat-2 measured Haiyan’s surface winds at 9:30 a.m. local time (5:30 p.m. PST), as shown in the image above. Arrows indicate wind direction and colors indicate wind speed, with darker shades of purple indicating stronger winds. (The strongest are red.) As is typical of cyclones in the northern hemisphere, the area of strongest winds was northeast of the storm center.
According to the Oceansat-2 data, which was processed by scientists at NASA’s Jet Propulsion Laboratory (JPL) using an experimental technique, the storm’s winds peaked at 206 kilometers (128 miles) per hour at the time of measurement—strong enough to devastate the landscape.
However, it is important to note that the maximum winds were likely stronger than what Oceansat-2 measured, explained Bryan Stiles of JPL. His group’s algorithm averages Oceansat-2 data over a 24 by 24 kilometer (15 by 15 mile) area, which yields a value somewhat lower than the storm’s absolute maximum winds. Stiles estimated that the maximum wind speeds were probably about 20 percent faster—about 240 kilometers (150 miles) per hour—when Oceansat-2 acquired the data, but his team has not yet had time to perform a rigorous analysis.
“The resolution of scatterometers is usually around 15 to 30 miles (25 to 50 kilometers), so they are not capable of resolving a storm’s maximum winds,” explained University of Miami meteorologist Brian McNoldy. “They work on the principle of wind roughening the ocean’s surface. So, in a sense, they don’t really measure the wind in a tropical cyclone. What they do is detect differences in how radiation is scattered off the ocean surface, and then a complex model is used to back out what wind speed would be responsible for that amount of roughness.”
“The bottom line is that meteorologists are going to be debating what Haiyan’s top wind speeds were for some time,” said Jeffrey Halverson, a meteorologist at the University of Maryland at Baltimore County. “The best we can do is point to the strengths and shortcomings of each piece of technology or technique that we use to estimate winds—be it Dvorak, a scatterometer, or a barometer. Since we lack reliable in situ measurement for Haiyan, we have to use wide error bars.”
Further Reading
- NASA Earth Observatory (2012, October 28) Comparing the Winds of Sandy and Katrina. Accessed November 11, 2013.
- NASA Jet Propulsion Laboratory Oceansat-2 Scatterometer Level 2B Ocean Wind Vectors in 12.5 km Slice Composites, Version 2. Accessed November 11, 2013.
- item two
- NASA Jet Propulsion Laboratory (2013, November 8) NASA Peers Into One of Earth’s Strongest Storms Ever. Accessed November 11, 2013.
- New Republic (2013, November 11) How Strong is Super Typhoon Haiyan? Accessed November 11, 2013.
- NOAA What is the Dvorak technique and how is it used? Accessed November 11, 2013.
- Business Insider (2013, November 8) Missing Data Means We May Never Know The True Power Of Super Typhoon Haiyan. Accessed November 11, 2013.
References & Resources
Data courtesy of the Jet Propulsion Laboratory and the Indian Space Research Organization’s Oceansat-2 mission. Caption by Adam Voiland, with information from Alexander Fore , Brian McNoldy, Jeffrey Halverson, and Bryan Stiles.
None