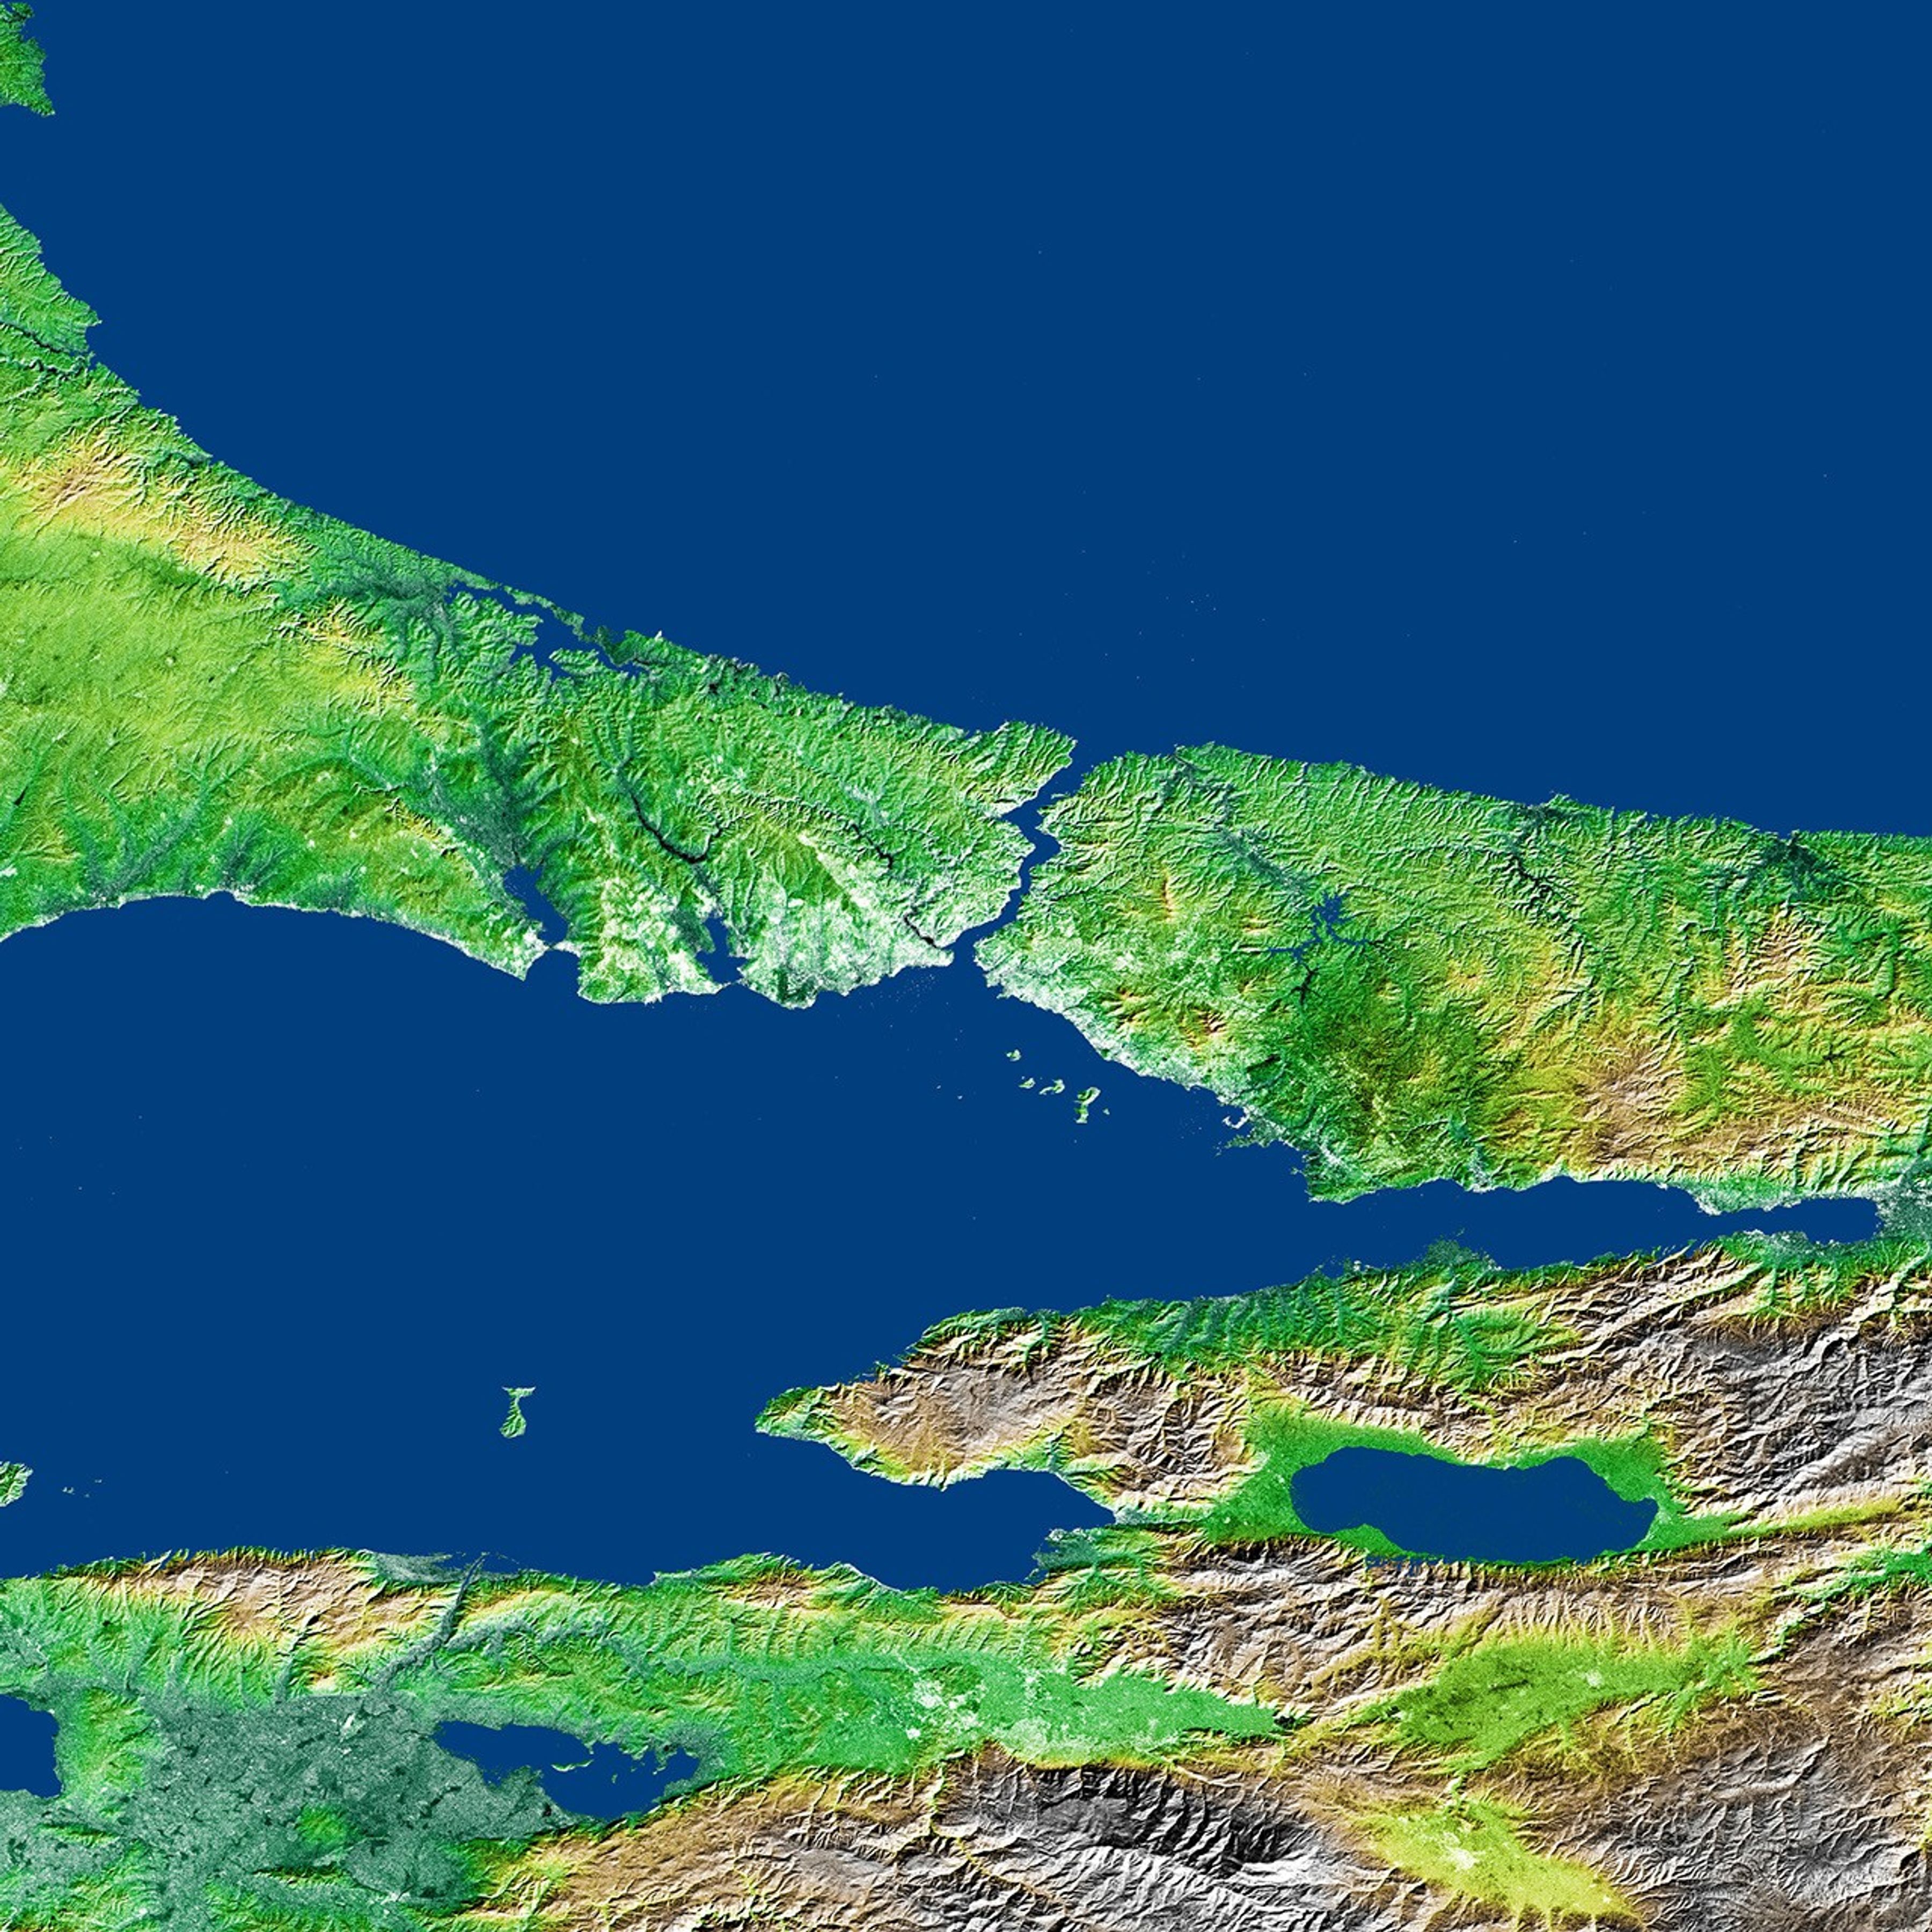


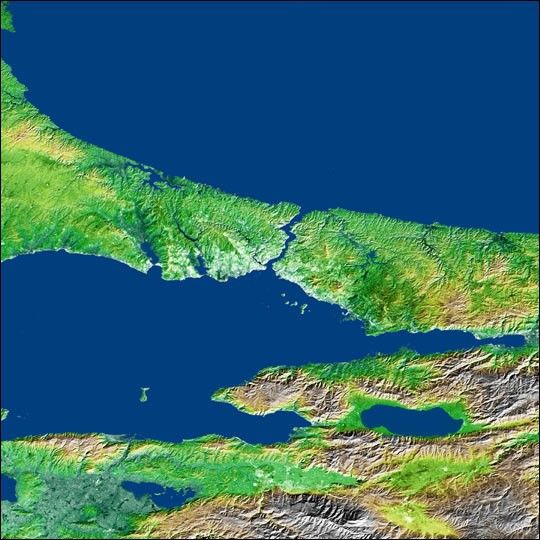
The Bosporus is a strait that connects the Black Sea with the Sea of Marmara inthe center of this view of northwest Turkey, taken during the Shuttle RadarTopography Mission (SRTM). The water of the Black Sea at the top of the image and Seaof Marmara below the center are colored blue in this image, along with severallarge lakes. The largest lake, to the lower right of the Sea of Marmara, isIznik Lake. The Bosporus (Turkish Bogazici) Strait is considered to be theboundary between Europe and Asia, and the large city of Istanbul, Turkey islocated on both sides of the southern end of the strait, visible as a brighter(light green to white) area on the image due to its stronger reflection ofradar. Istanbul is the modern name for a city with a long history, previouslycalled Constantinople and Byzantium. It was rebuilt as the capital of the RomanEmpire in 330 A.D. by Constantine on the site of an earlier Greek city, and itwas later the capital of the Byzantine and Ottoman empires until 1922.
The Gulf of Izmit is the narrow gulf extending to the east (right) from theSea of Marmara. The city of Izmit at the end of the gulf was heavily damaged bya large magnitude 7.4 earthquake on August 17, 1999, often called the Izmitearthquake (also known as the Kocaeli, Turkey, earthquake), that killed at least17,000 people. A previous earthquake under the Gulf of Izmit in 1754 killed atleast 2,000 people. The Izmit earthquake ruptured a long section of the NorthAnatolian Fault system from off the right side of this image continuing underthe Gulf of Izmit. Another strand of the North Anatolian Fault system is visibleas a sharp linear feature in the topography south of Iznik Lake. Bathymetricsurveys show that the North Anatolian Fault system extends beneath and hasformed the Sea of Marmara, in addition to the Gulf of Izmit and Iznik Lake.Scientists are studying the North Anatolian Fault system to determine the riskof a large earthquake on the faults close to Istanbul that could kill many morethan the 1999 event.
Three visualization methods were combined to produce this image: shading andcolor coding of topographic height and radar image intensity. The shade imagewas derived by computing topographic slope in the northwest-southeast direction.Northwest-facing slopes appear dark and southeast-facing slopes appear bright.Color coding is directly related to topographic height, with green at the lowerelevations, rising through yellow and brown to white at the highest elevations.The shade image was combined with the radar intensity image to add detail,especially in the flat areas.
Size: 2x2 degrees (168 by 222 kilometers; 104 by 138 miles)
Location: 40-42 degrees North latitude, 28-30 degrees East longitude
Orientation: North toward the top
Image Data: shaded and colored SRTM elevation model, with SRTM radarintensity added
Original Data Resolution: SRTM 1 arcsecond (about 30 meters or 98 feet)
Date Acquired: February 2000 (SRTM)
References & Resources
Image courtesy NASA/JPL/NIMA